Clustergram
Clustergram: Visualization and diagnostics for cluster analysis - Published in JOSS (2023)
Science Score: 98.0%
This score indicates how likely this project is to be science-related based on various indicators:
-
✓CITATION.cff file
Found CITATION.cff file -
✓codemeta.json file
Found codemeta.json file -
✓.zenodo.json file
Found .zenodo.json file -
✓DOI references
Found 5 DOI reference(s) in README and JOSS metadata -
✓Academic publication links
Links to: zenodo.org -
○Committers with academic emails
-
○Institutional organization owner
-
✓JOSS paper metadata
Published in Journal of Open Source Software
Scientific Fields
Repository
Clustergram - Visualization and diagnostics for cluster analysis in Python
Basic Info
- Host: GitHub
- Owner: martinfleis
- License: mit
- Language: Jupyter Notebook
- Default Branch: main
- Homepage: https://clustergram.readthedocs.io
- Size: 11.7 MB
Statistics
- Stars: 127
- Watchers: 4
- Forks: 8
- Open Issues: 4
- Releases: 11
Metadata Files
README.md
Clustergram
![]()
Visualization and diagnostics for cluster analysis
![]()
Clustergram is a diagram proposed by Matthias Schonlau in his paper The clustergram: A graph for visualizing hierarchical and nonhierarchical cluster analyses:
In hierarchical cluster analysis, dendrograms are used to visualize how clusters are formed. I propose an alternative graph called a “clustergram” to examine how cluster members are assigned to clusters as the number of clusters increases. This graph is useful in exploratory analysis for nonhierarchical clustering algorithms such as k-means and for hierarchical cluster algorithms when the number of observations is large enough to make dendrograms impractical.
The clustergram was later implemented in R by Tal Galili, who also gives a thorough explanation of the concept.
This is a Python implementation, originally based on Tal's script, written for
scikit-learn and RAPIDS cuML implementations of K-Means, Mini Batch K-Means and
Gaussian Mixture Model (scikit-learn only) clustering, plus hierarchical/agglomerative
clustering using SciPy. Alternatively, you can create clustergram using from_*
constructors based on alternative clustering algorithms.
![]()
Getting started
You can install clustergram from conda or pip:
shell
conda install clustergram -c conda-forge
shell
pip install clustergram
In any case, you still need to install your selected backend (scikit-learn and scipy
or cuML).
The example of clustergram on Palmer penguins dataset:
python
import seaborn
df = seaborn.load_dataset('penguins')
First we have to select numerical data and scale them.
python
from sklearn.preprocessing import scale
data = scale(df.drop(columns=['species', 'island', 'sex']).dropna())
And then we can simply pass the data to clustergram.
```python from clustergram import Clustergram
cgram = Clustergram(range(1, 8)) cgram.fit(data) cgram.plot() ```
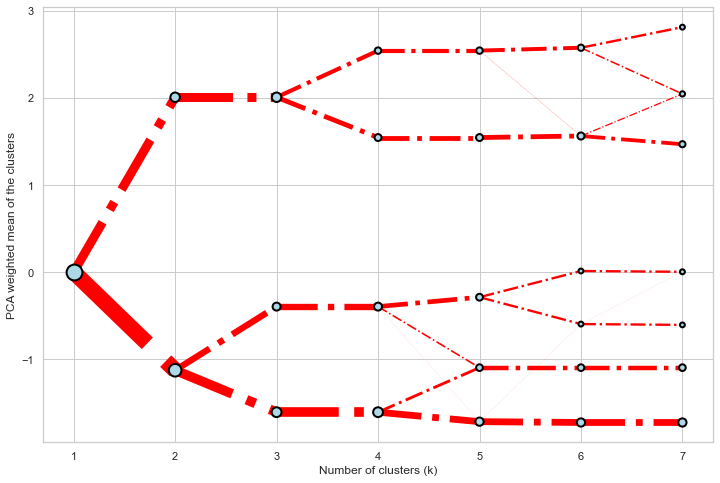
Styling
Clustergram.plot() returns matplotlib axis and can be fully customised as any other
matplotlib plot.
```python seaborn.set(style='whitegrid')
cgram.plot( ax=ax, size=0.5, linewidth=0.5, clusterstyle={"color": "lightblue", "edgecolor": "black"}, linestyle={"color": "red", "linestyle": "-."}, figsize=(12, 8) ) ```
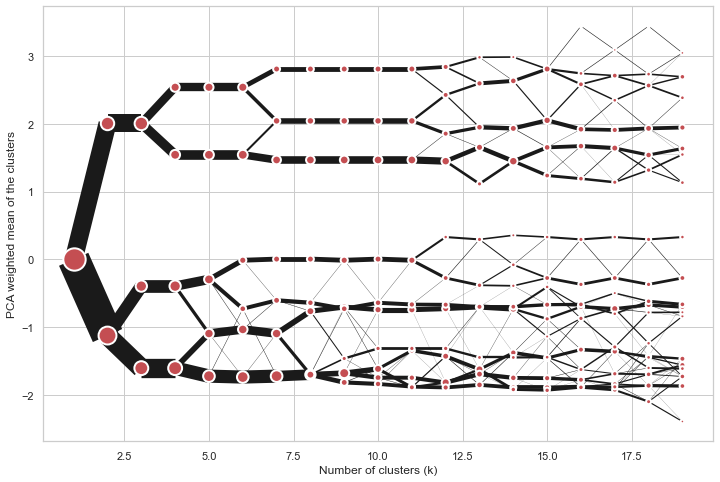
Mean options
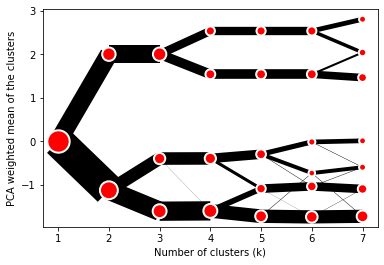
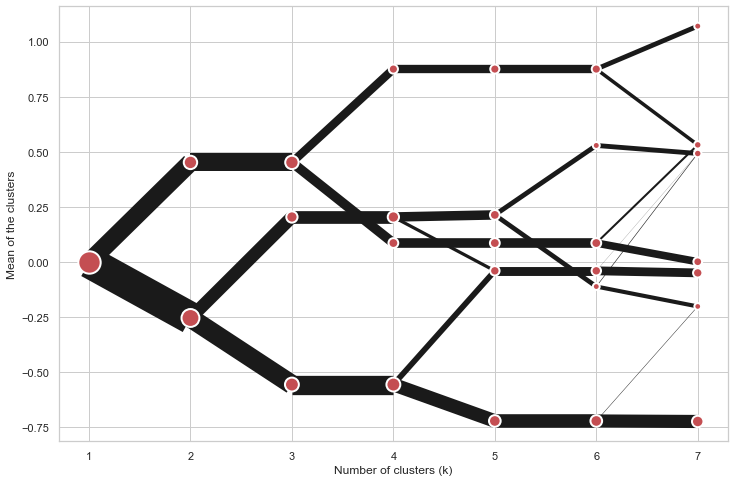
On the y axis, a clustergram can use mean values as in the original paper by Matthias
Schonlau or PCA weighted mean values as in the implementation by Tal Galili.
python
cgram = Clustergram(range(1, 8))
cgram.fit(data)
cgram.plot(figsize=(12, 8), pca_weighted=True)
python
cgram = Clustergram(range(1, 8))
cgram.fit(data)
cgram.plot(figsize=(12, 8), pca_weighted=False)
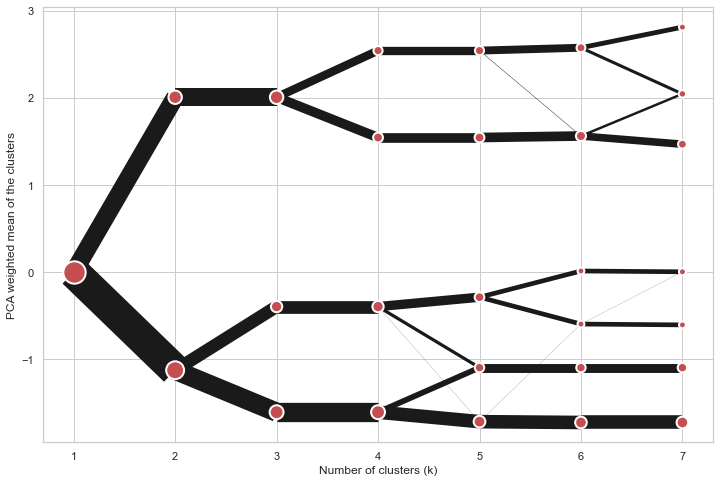
Scikit-learn, SciPy and RAPIDS cuML backends
Clustergram offers three backends for the computation - scikit-learn and scipy which
use CPU and RAPIDS.AI cuML, which uses GPU. Note that all are optional dependencies
but you will need at least one of them to generate clustergram.
Using scikit-learn (default):
python
cgram = Clustergram(range(1, 8), backend='sklearn')
cgram.fit(data)
cgram.plot()
Using cuML:
python
cgram = Clustergram(range(1, 8), backend='cuML')
cgram.fit(data)
cgram.plot()
data can be all data types supported by the selected backend (including
cudf.DataFrame with cuML backend).
Supported methods
Clustergram currently supports K-Means, Mini Batch K-Means, Gaussian Mixture Model and
SciPy's hierarchical clustering methods. Note tha GMM and Mini Batch K-Means are
supported only for scikit-learn backend and hierarchical methods are supported only
for scipy backend.
Using K-Means (default):
python
cgram = Clustergram(range(1, 8), method='kmeans')
cgram.fit(data)
cgram.plot()
Using Mini Batch K-Means, which can provide significant speedup over K-Means:
python
cgram = Clustergram(range(1, 8), method='minibatchkmeans', batch_size=100)
cgram.fit(data)
cgram.plot()
Using Gaussian Mixture Model:
python
cgram = Clustergram(range(1, 8), method='gmm')
cgram.fit(data)
cgram.plot()
Using Ward's hierarchical clustering:
python
cgram = Clustergram(range(1, 8), method='hierarchical', linkage='ward')
cgram.fit(data)
cgram.plot()
Manual input
Alternatively, you can create clustergram using from_data or from_centers methods
based on alternative clustering algorithms.
Using Clustergram.from_data which creates cluster centers as mean or median values:
```python data = numpy.array([[-1, -1, 0, 10], [1, 1, 10, 2], [0, 0, 20, 4]]) labels = pandas.DataFrame({1: [0, 0, 0], 2: [0, 0, 1], 3: [0, 2, 1]})
cgram = Clustergram.from_data(data, labels) cgram.plot() ```
Using Clustergram.from_centers based on explicit cluster centers.:
python
labels = pandas.DataFrame({1: [0, 0, 0], 2: [0, 0, 1], 3: [0, 2, 1]})
centers = {
            1: np.array([[0, 0]]),
            2: np.array([[-1, -1], [1, 1]]),
            3: np.array([[-1, -1], [1, 1], [0, 0]]),
        }
cgram = Clustergram.from_centers(centers, labels)
cgram.plot(pca_weighted=False)
To support PCA weighted plots you also need to pass data:
python
cgram = Clustergram.from_centers(centers, labels, data=data)
cgram.plot()
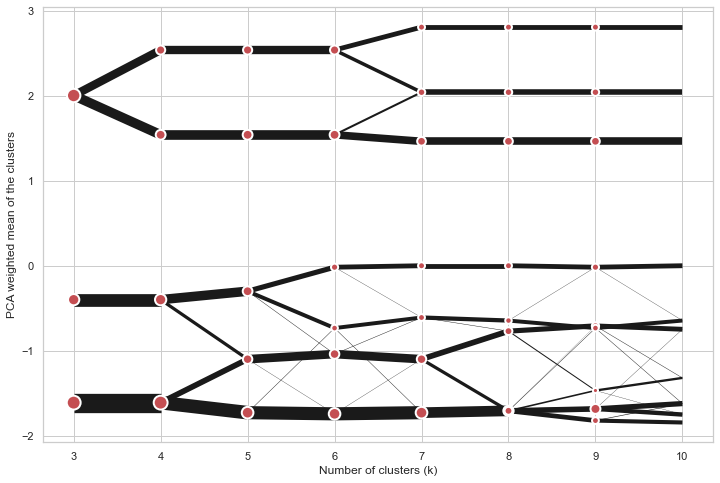
Partial plot
Clustergram.plot() can also plot only a part of the diagram, if you want to focus on a
limited range of k.
python
cgram = Clustergram(range(1, 20))
cgram.fit(data)
cgram.plot(figsize=(12, 8))
python
cgram.plot(k_range=range(3, 10), figsize=(12, 8))
Additional clustering performance evaluation
Clustergam includes handy wrappers around a selection of clustering performance metrics
offered by scikit-learn. Data which were originally computed on GPU are converted to
numpy on the fly.
Silhouette score
Compute the mean Silhouette Coefficient of all samples. See scikit-learn
documentation
for details.
```python
cgram.silhouettescore() 2 0.531540 3 0.447219 4 0.400154 5 0.377720 6 0.372128 7 0.331575 Name: silhouettescore, dtype: float64 ```
Once computed, the resulting Series is available as cgram.silhouette_. Calling the original
method will recompute the score.
Calinski and Harabasz score
Compute the Calinski and Harabasz score, also known as the Variance Ratio Criterion. See
scikit-learn
documentation
for details.
```python
cgram.calinskiharabaszscore() 2 482.191469 3 441.677075 4 400.392131 5 411.175066 6 382.731416 7 352.447569 Name: calinskiharabaszscore, dtype: float64 ```
Once computed, the resulting Series is available as cgram.calinski_harabasz_. Calling the
original method will recompute the score.
Davies-Bouldin score
Compute the Davies-Bouldin score. See scikit-learn
documentation
for details.
```python
cgram.daviesbouldinscore() 2 0.714064 3 0.943553 4 0.943320 5 0.973248 6 0.950910 7 1.074937 Name: daviesbouldinscore, dtype: float64 ```
Once computed, the resulting Series is available as cgram.davies_bouldin_. Calling the
original method will recompute the score.
Accessing labels
Clustergram stores resulting labels for each of the tested options, which can be
accessed as:
```python
cgram.labels_ 1 2 3 4 5 6 7 0 0 0 2 2 3 2 1 1 0 0 2 2 3 2 1 2 0 0 2 2 3 2 1 3 0 0 2 2 3 2 1 4 0 0 2 2 0 0 3 .. .. .. .. .. .. .. .. 337 0 1 1 3 2 5 0 338 0 1 1 3 2 5 0 339 0 1 1 1 1 1 4 340 0 1 1 3 2 5 5 341 0 1 1 1 1 1 5 ```
Saving clustergram
You can save both the plot and clustergram.Clustergram to a disk.
Saving plot
Clustergram.plot() returns matplotlib axis object and as such can be saved as any
other plot:
```python import matplotlib.pyplot as plt
cgram.plot() plt.savefig('clustergram.svg') ```
Saving object
If you want to save your computed clustergram.Clustergram object to a disk, you can
use pickle library:
```python import pickle
with open('clustergram.pickle','wb') as f: pickle.dump(cgram, f) ```
Then loading is equally simple:
python
with open('clustergram.pickle','rb') as f:
    loaded = pickle.load(f)
References
Schonlau M. The clustergram: a graph for visualizing hierarchical and non-hierarchical cluster analyses. The Stata Journal, 2002; 2 (4):391-402.
Schonlau M. Visualizing Hierarchical and Non-Hierarchical Cluster Analyses with Clustergrams. Computational Statistics: 2004; 19(1):95-111.
Owner
- Name: Martin Fleischmann
- Login: martinfleis
- Kind: user
- Location: Prague
- Website: martinfleischmann.net
- Twitter: martinfleis
- Repositories: 96
- Profile: https://github.com/martinfleis
Researcher in geographic data science. Member of @geopandas and @pysal development teams.
JOSS Publication
Clustergram: Visualization and diagnostics for cluster analysis
Authors

Department of Social Geography and Regional Development, Charles University
Editor
Charlotte Soneson
Tags
clustering unsupervised classification data explorationCitation (CITATION.cff)
cff-version: "1.2.0"
authors:
- family-names: Fleischmann
  given-names: Martin
  orcid: "https://orcid.org/0000-0003-3319-3366"
doi: 10.5281/zenodo.8202396
message: If you use this software, please cite our article in the
  Journal of Open Source Software.
preferred-citation:
  authors:
  - family-names: Fleischmann
    given-names: Martin
    orcid: "https://orcid.org/0000-0003-3319-3366"
  date-published: 2023-09-02
  doi: 10.21105/joss.05240
  issn: 2475-9066
  issue: 89
  journal: Journal of Open Source Software
  publisher:
    name: Open Journals
  start: 5240
  title: "Clustergram: Visualization and diagnostics for cluster
    analysis"
  type: article
  url: "https://joss.theoj.org/papers/10.21105/joss.05240"
  volume: 8
title: "Clustergram: Visualization and diagnostics for cluster analysis"
Papers & Mentions
Total mentions: 11
Divergence of protein-coding capacity and regulation in the Bacillus cereus sensu lato group
- DOI: 10.1186/1471-2105-15-S11-S8
- OpenAlex ID: https://openalex.org/W2051421359
- Published: October 2014
Gene expression analysis reveals the tipping points during infant brain development for human and chimpanzee
- DOI: 10.1186/s12864-020-6465-8
- OpenAlex ID: https://openalex.org/W3009710697
- Published: March 2020
Pan-cancer analysis of frequent DNA co-methylation patterns reveals consistent epigenetic landscape changes in multiple cancers
- DOI: 10.1186/s12864-016-3259-0
- OpenAlex ID: https://openalex.org/W2579970155
- Published: January 2017
Constructing network topologies for multiple signal-encoding functions
- DOI: 10.1186/s12918-018-0676-5
- OpenAlex ID: https://openalex.org/W2911288570
- Published: January 2019
Proteotyping of biogas plant microbiomes separates biogas plants according to process temperature and reactor type
- DOI: 10.1186/s13068-016-0572-4
- OpenAlex ID: https://openalex.org/W2500466538
- Published: July 2016
Exposed CendR Domain in Homing Peptide Yields Skin-Targeted Therapeutic in Epidermolysis Bullosa
- DOI: 10.1016/j.ymthe.2020.05.017
- OpenAlex ID: https://openalex.org/W3027722708
- Published: August 2020
Genome-Wide Requirements for Resistance to Functionally Distinct DNA-Damaging Agents
- DOI: 10.1371/journal.pgen.0010024
- OpenAlex ID: https://openalex.org/W2046106802
- Published: August 2005
Coregulation of Terpenoid Pathway Genes and Prediction of Isoprene Production in Bacillus subtilis Using Transcriptomics
- DOI: 10.1371/journal.pone.0066104
- OpenAlex ID: https://openalex.org/W2052933288
- Published: June 2013
Proteomic Properties Reveal Phyloecological Clusters of Archaea
- DOI: 10.1371/journal.pone.0048231
- OpenAlex ID: https://openalex.org/W2068844745
- Published: October 2012
A Comprehensive Spatial Mapping of Muscle Synergies in Highly Variable Upper-Limb Movements of Healthy Subjects
- DOI: 10.3389/fphys.2019.01231
- OpenAlex ID: https://openalex.org/W2976092854
- Published: September 2019
Effects of visual inputs on neural dynamics for coding of location and running speed in medial entorhinal cortex
- DOI: 10.7554/eLife.62500
- OpenAlex ID: https://openalex.org/W3111079134
- Published: December 2020
GitHub Events
Total
- Issues event: 1
- Watch event: 7
- Delete event: 3
- Issue comment event: 1
- Push event: 4
- Pull request event: 6
- Fork event: 1
- Create event: 2
Last Year
- Issues event: 1
- Watch event: 7
- Delete event: 3
- Issue comment event: 1
- Push event: 4
- Pull request event: 6
- Fork event: 1
- Create event: 2
Committers
Last synced: 12 months ago
Top Committers
| Name | Commits | |
|---|---|---|
| Martin Fleischmann | m****n@m****t | 130 |
| pre-commit-ci[bot] | 6****] | 21 |
| Matthew Law | m****w@g****m | 1 |
Committer Domains (Top 20 + Academic)
Issues and Pull Requests
Last synced: 11 months ago
All Time
- Total issues: 16
- Total pull requests: 57
- Average time to close issues: about 1 month
- Average time to close pull requests: 1 day
- Total issue authors: 3
- Total pull request authors: 4
- Average comments per issue: 1.19
- Average comments per pull request: 0.6
- Merged pull requests: 56
- Bot issues: 0
- Bot pull requests: 24
Past Year
- Issues: 1
- Pull requests: 8
- Average time to close issues: N/A
- Average time to close pull requests: about 8 hours
- Issue authors: 1
- Pull request authors: 2
- Average comments per issue: 1.0
- Average comments per pull request: 0.38
- Merged pull requests: 7
- Bot issues: 0
- Bot pull requests: 7
Top Authors
Issue Authors
- martinfleis (14)
- jGaboardi (1)
- behrica (1)
Pull Request Authors
- martinfleis (32)
- pre-commit-ci[bot] (26)
- ljwolf (1)
- matthew-law (1)
Top Labels
Issue Labels
Pull Request Labels
Packages
- Total packages: 2
-
Total downloads:
- pypi 875 last-month
-
Total dependent packages: 0
(may contain duplicates) -
Total dependent repositories: 8
(may contain duplicates) - Total versions: 19
- Total maintainers: 1
pypi.org: clustergram
Clustergram - visualization and diagnostics for cluster analysis
- Homepage: https://clustergram.readthedocs.io
- Documentation: https://clustergram.readthedocs.io/
- License: MIT
-
Latest release: 0.8.1
published over 2 years ago
Rankings
Maintainers (1)
conda-forge.org: clustergram
- Homepage: https://github.com/martinfleis/clustergram
- License: MIT
-
Latest release: 0.6.0
published over 4 years ago
Rankings
Dependencies
- actions/checkout master composite
- actions/create-release v1 composite
- actions/setup-python v2 composite
- actions/upload-release-asset v1 composite
- pypa/gh-action-pypi-publish master composite
- actions/checkout v2 composite
- codecov/codecov-action v3 composite
- mamba-org/provision-with-micromamba main composite
- urbangrammar-graphics *
- matplotlib *
- numpy *
- pandas *