sonification
Science Score: 44.0%
This score indicates how likely this project is to be science-related based on various indicators:
-
✓CITATION.cff file
Found CITATION.cff file -
✓codemeta.json file
Found codemeta.json file -
✓.zenodo.json file
Found .zenodo.json file -
○DOI references
-
○Academic publication links
-
○Academic email domains
-
○Institutional organization owner
-
○JOSS paper metadata
-
○Scientific vocabulary similarity
Low similarity (13.9%) to scientific vocabulary
Repository
Basic Info
- Host: GitHub
- Owner: vsulis5357
- License: other
- Language: Python
- Default Branch: main
- Size: 737 KB
Statistics
- Stars: 0
- Watchers: 1
- Forks: 1
- Open Issues: 0
- Releases: 0
Metadata Files
README.md
Sonification of Astronomical Data
This is an extension to the Astronify* software (https://astronify.readthedocs.io/en/latest/) to allow the sonification of a spatially distributed dataset. In particular, this code was developed as a master project from Durham University to sonify muon images from the VERITAS Array.
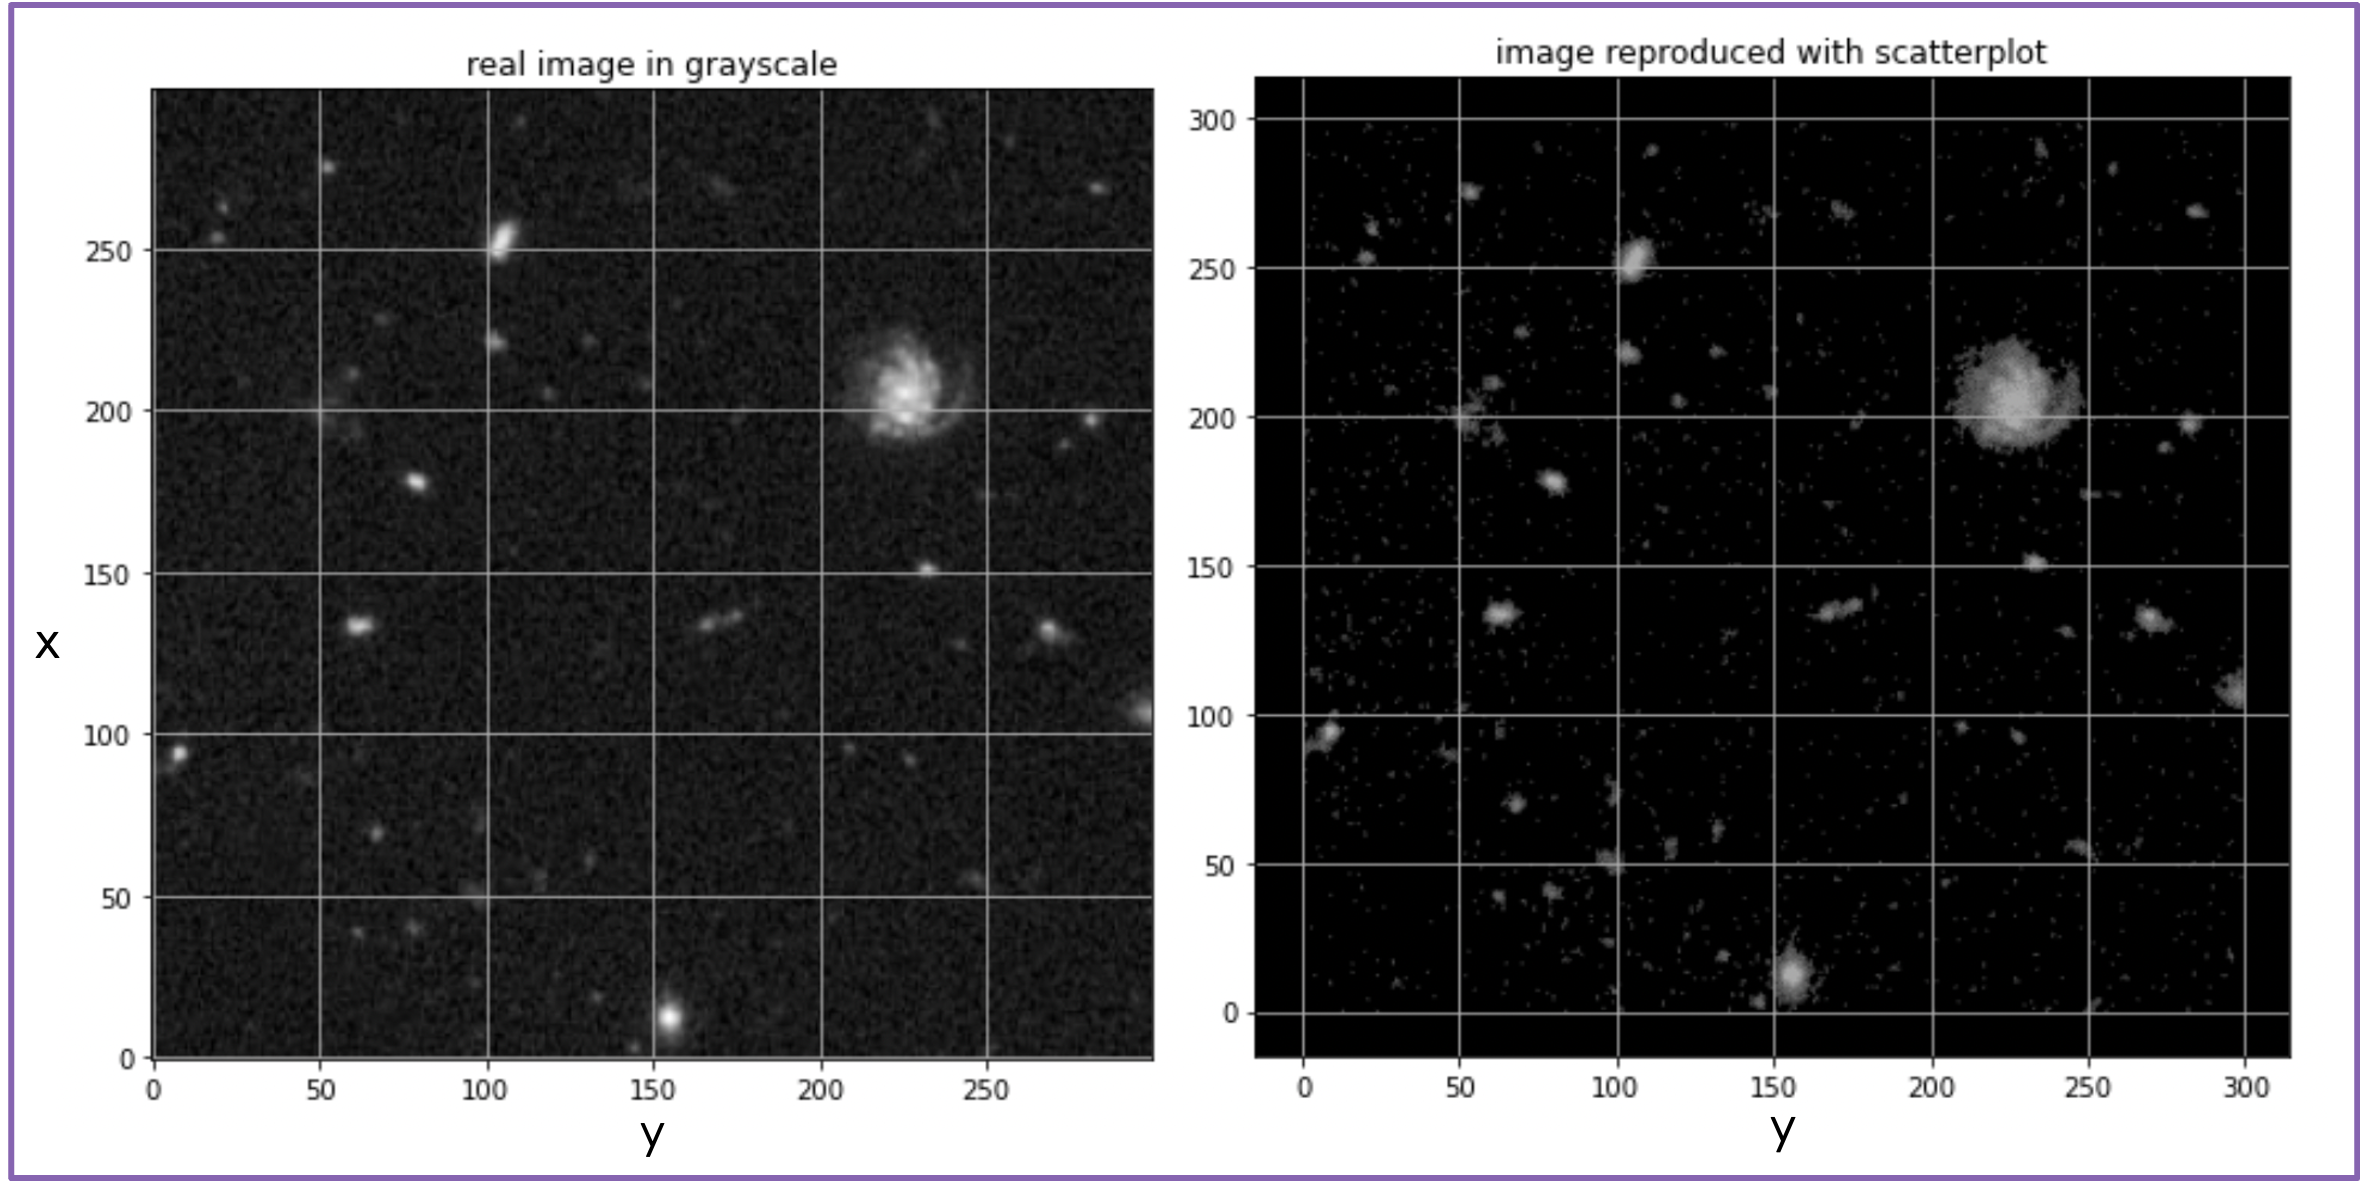
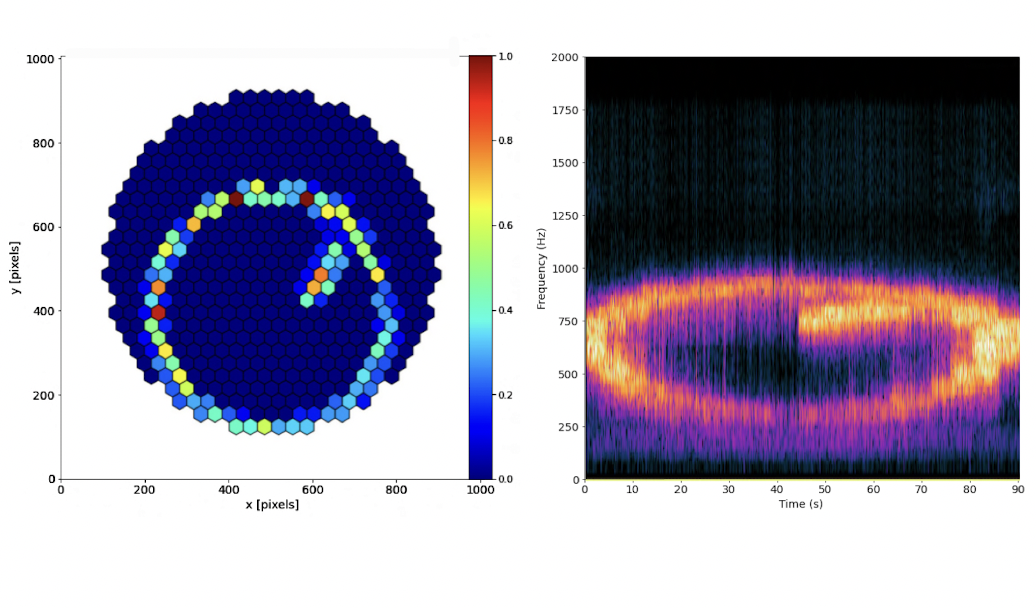
Below you can find an example of how the two parts of the program work: the first one reproduces any image into a scatterplot, the second takes this new array and converts it into an audible map.
*Copyright (c) 2020, Clara Brasseur, Scott Fleming, Jennifer Kotler, Kate Meredith All rights reserved.
Hubble Deep Field Reproduced with Scatterplot
Sonogram of a Sonified Muon Image
ABOUT THIS REPOSITORY
You can read more about the scientific work carried out through this repository on https://papers.ssrn.com/sol3/papers.cfm?abstract_id=4891458#paper-references-widget or my linkedIn https://www.linkedin.com/in/valentina-s-0627a9242/
This repository contains scripts for converting images into scatterplots and sonifications. The files are split into:
- reproduce_image.py: A Python file that reproduces an image as a scatterplot.
- sonifications.py: A Python file that takes scatterplot data and creates a sonification series.
Reproduce Image Script The reproduce_image.py script takes an image file and reproduces it as a scatterplot. The script does the following:
- Converts the input image to grayscale.
- Extracts pixel values and generates scatter data based on these values.
- Plots the scatter data to create a visual representation of the image.
Sonifications Script The sonifications.py script creates the data sonification itself. This script does the following:
- Converts the scatterplot data into an audio series.
- Allows for adjusting note spacing and sonification range to customize the auditory representation.
These are independent scripts.
To run the scripts, use the following commands: - python reproduce_image.py - python sonifications.py
The repository also contains two sample images. The accepted image format is either .png or .jpeg. Depending on the size of the picture the processing time can be quite long. Please change the processing parameters to suit your needs.
The noise threshold (in def generatescatterdata(gray_pixels, threshold=35)) is currently set to 35. It a higher value will result in less image noise and higher processing times but potentially some data loss.
WHAT ARE SONIFICATIONS?
All sciences are by nature highly visual. In Maths, Physics, Biology, right from primary education, we are taught to plot graphs to represent information. This approach is undoubtedly effective but excludes the possibility to use our natural capabilities to their full extent. Naturally, one question arises: is it possible to do research using different sensory abilities? In this project, we explore communication using sound, using a data display method called sonification.
Sonification is the process of converting numerical data – such as the incoming light from a star, the transit of an exoplanet, etc. – into sounds, effectively replacing a visual graph with an auditory chart that conveys the same information. These sounds are not already existing in nature, they are a construct used for communication only, just like visual representation but using a different sense.
WHY USE SOUND?
There are several factors that make sound a worthy opponent for traditional data display methods:
Distinguish particular streams in complex waves:
Think about being on a busy street in a big city. It is very crowded, therefore you are subject to a variety of different sounds coming from anywhere around you. Despite the huge amount of information you can decide to listen to all of these sounds together or focus on the drilling from the construction site across the street, on the businessman talking on the phone about the stock market, or even on the lazy buzzing of a bee in the flower shop you are about to walk into. The ability to isolate particular streams in complex soundwaves is a unique characteristic of this sense, which can be very useful in science to discern hidden patterns in traditionally visually crowded datasets.
Sensitivity to rapid changes:
Sound is much more suitable to detect rapid information variations than sight. In fact, where sight can detect changes lasting milliseconds, our auditory system can detect them even if they are only a few microseconds long. This means that when highly variable information is being displayed, it is possible to hear information that cannot be processed by our eyes.
A wider field of perception:
Our eyes are limited in their field of perception, allowing us to process information from an area around 190 degrees wide. Our ears, however, do not have that restriction. They are able to perceive information from anywhere as long as the sound source is not too far away from the listener. Future sonifications could take full advantage of this by creating 3D sound charts, which provide information about the position and direction of the data points considered.
Effects on memory:
It has been shown that the use of images and sounds simultaneously has a positive effect on memory. Using both data displays can help us understand information better and retain them for a longer period of time.
Inclusivity:
Finally, the most important reason for exploring alternative ways of displaying information and doing data analysis is inclusivity. All sciences represent data using traditional visualization tools, making it extremely challenging for visually impaired individuals to approach research. Using audio can open the doors to a world of opportunities through which to cultivate their interests.
Owner
- Login: vsulis5357
- Kind: user
- Repositories: 1
- Profile: https://github.com/vsulis5357
Citation (CITATION.cff)
cff-version: 1.2.0
message: "If you use this software, please cite it as below."
title: "Sonification of Astronomical Data"
version: 1.0.0
repository-code: "https://github.com/vsulis5357/Sonification"
license: MIT
keywords:
  - sonification
  - muon
  - scatterplots
  - audio
  - data analysis
  - astronomy
  - astrophysics
  - imaging system
  - spatially distributed datasets
authors:
  - family-names: Sulis
    given-names: Valentina
    orcid: "https://orcid.org/0009-0002-7953-9123"
    affiliation: Durham University
date-released: 2024-09-09
url: "https://github.com/vsulis5357/Sonification"
GitHub Events
Total
Last Year
Dependencies
- PyWavelets ==1.4.1
- astronify ==0.1
- astropy ==5.2.2
- imageio ==2.34.2
- lazy_loader ==0.4
- networkx ==3.1
- pyerfa ==2.0.0.3
- pyo ==1.0.5
- pyp ==3.0.9
- scikit-image ==0.21.0
- scipy ==1.10.1
- thinkx ==1.1.3
- tifffile ==2023.7.10
- webencodings ==0.5.1