lida
Automatic Generation of Visualizations and Infographics using Large Language Models
Science Score: 67.0%
This score indicates how likely this project is to be science-related based on various indicators:
-
✓CITATION.cff file
Found CITATION.cff file -
✓codemeta.json file
Found codemeta.json file -
✓.zenodo.json file
Found .zenodo.json file -
✓DOI references
Found 1 DOI reference(s) in README -
✓Academic publication links
Links to: arxiv.org -
○Committers with academic emails
-
○Institutional organization owner
-
○JOSS paper metadata
-
○Scientific vocabulary similarity
Low similarity (17.3%) to scientific vocabulary
Keywords
Repository
Automatic Generation of Visualizations and Infographics using Large Language Models
Basic Info
- Host: GitHub
- Owner: microsoft
- License: mit
- Language: Jupyter Notebook
- Default Branch: main
- Homepage: https://microsoft.github.io/lida/
- Size: 486 MB
Statistics
- Stars: 3,123
- Watchers: 43
- Forks: 346
- Open Issues: 80
- Releases: 0
Topics
Metadata Files
README.md
LIDA: Automatic Generation of Visualizations and Infographics using Large Language Models
![]()
![]()

![]()
LIDA is a library for generating data visualizations and data-faithful infographics. LIDA is grammar agnostic (will work with any programming language and visualization libraries e.g. matplotlib, seaborn, altair, d3 etc) and works with multiple large language model providers (OpenAI, Azure OpenAI, PaLM, Cohere, Huggingface). Details on the components of LIDA are described in the paper here and in this tutorial notebook. See the project page here for updates!.
Note on Code Execution: To create visualizations, LIDA generates and executes code. Ensure that you run LIDA in a secure environment.
Features
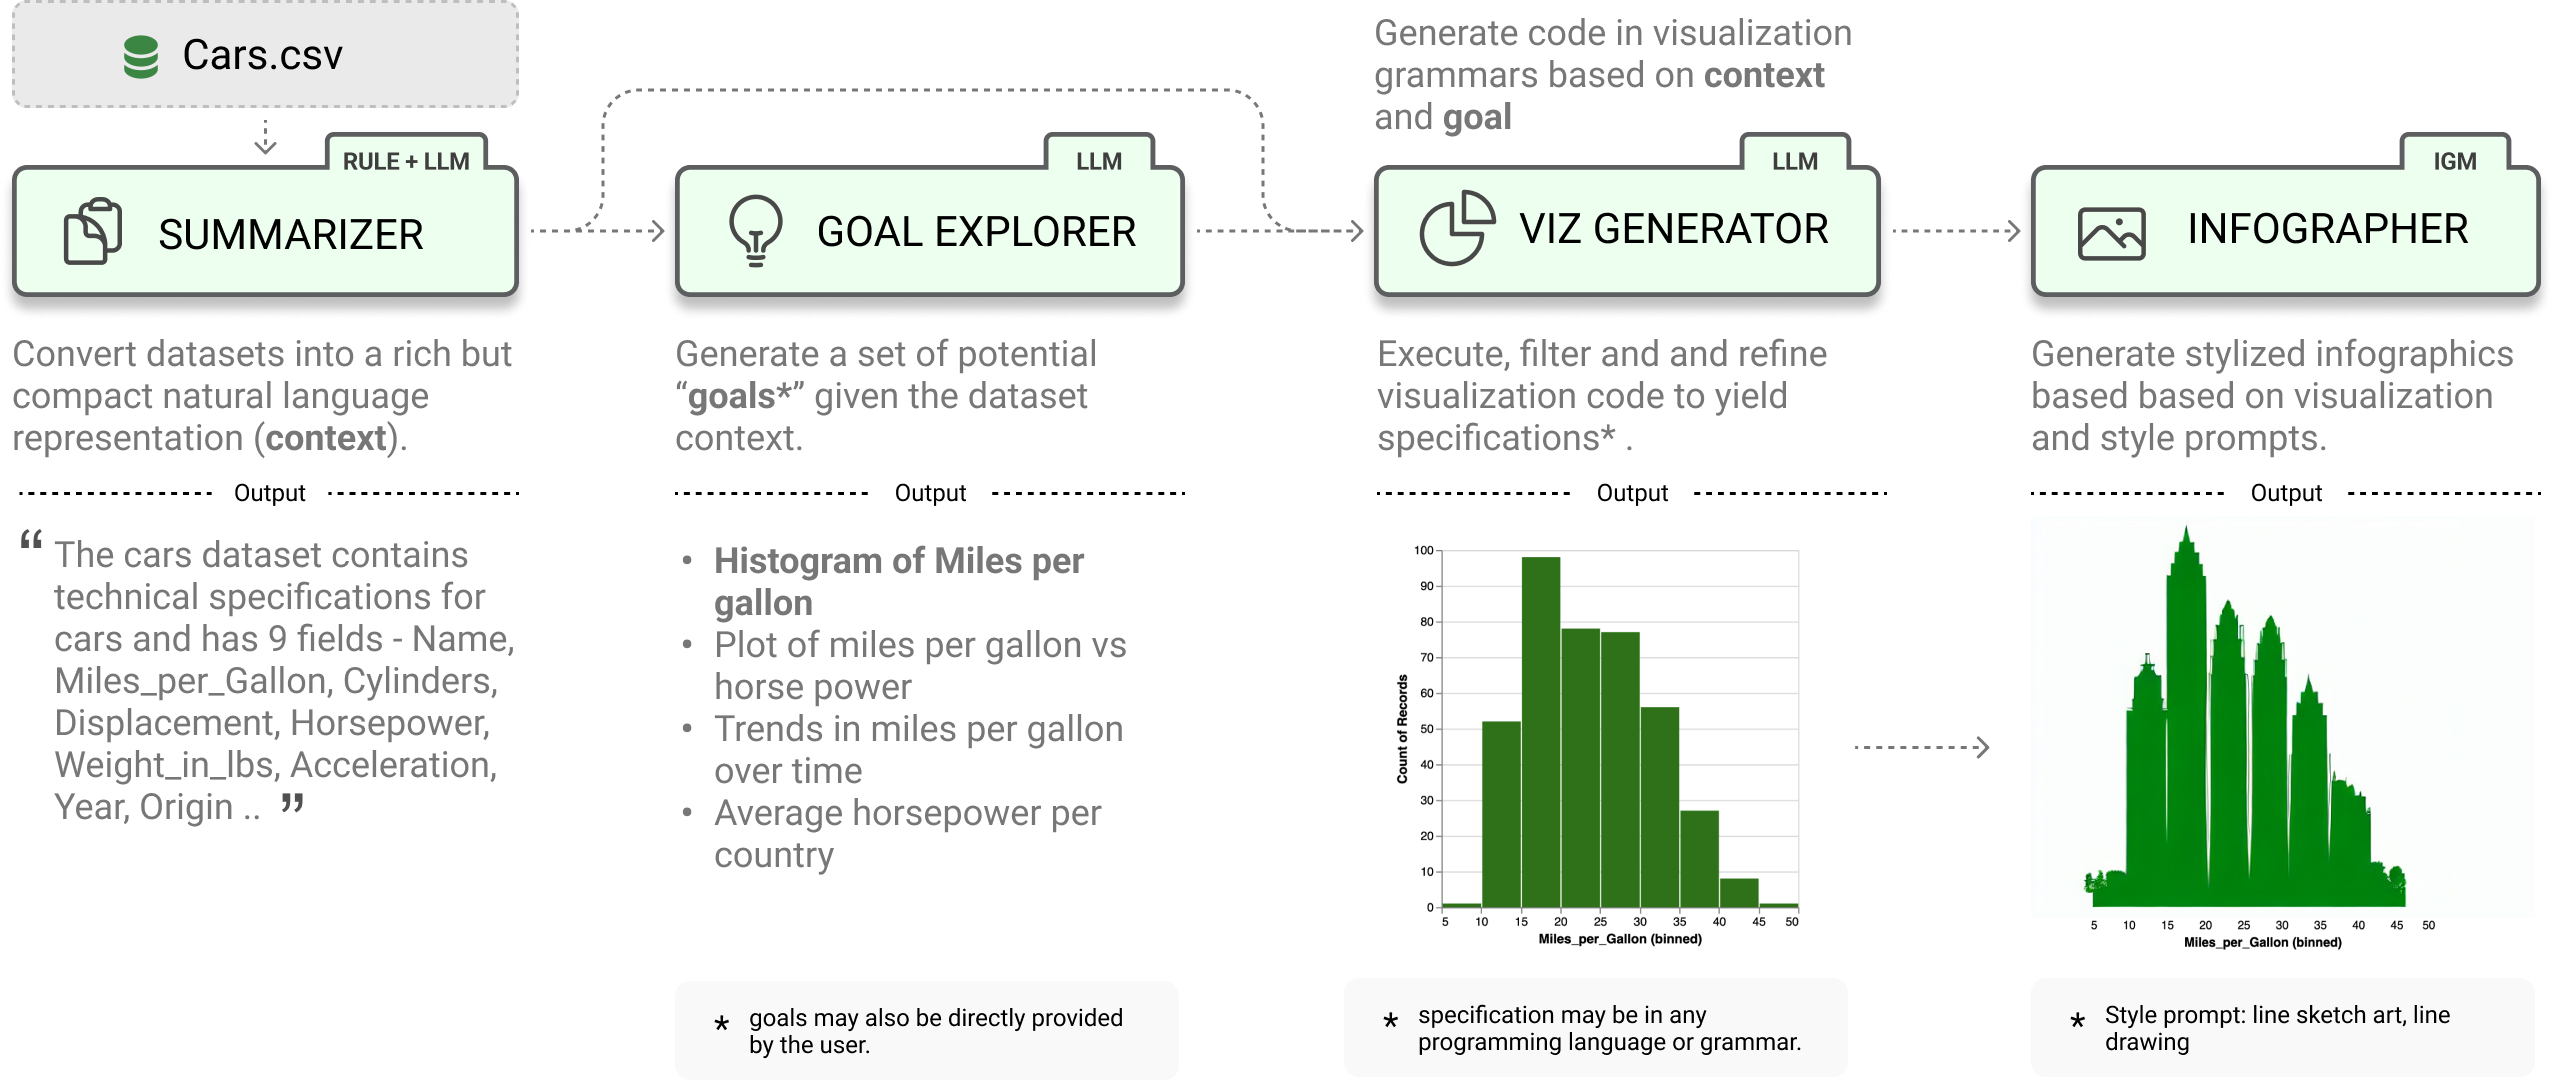
LIDA treats visualizations as code and provides a clean api for generating, executing, editing, explaining, evaluating and repairing visualization code.
- [x] Data Summarization
- [x] Goal Generation
- [x] Visualization Generation
- [x] Visualization Editing
- [x] Visualization Explanation
- [x] Visualization Evaluation and Repair
- [x] Visualization Recommendation
- [x] Infographic Generation (beta) # pip install lida[infographics]
```python
from lida import Manager, llm
lida = Manager(text_gen = llm("openai")) # palm, cohere .. summary = lida.summarize("data/cars.csv") goals = lida.goals(summary, n=2) # exploratory data analysis charts = lida.visualize(summary=summary, goal=goals[0]) # exploratory data analysis ```
Getting Started
Setup and verify that your python environment is python 3.10 or higher (preferably, use Conda). Install the library via pip.
bash
pip install -U lida
LIDA depends on llmx and openai. If you had these libraries installed previously, consider updating them.
bash
pip install -U llmx openai
Once requirements are met, setup your api key. Learn more about setting up keys for other LLM providers here.
bash
export OPENAI_API_KEY=<your key>
Alternatively you can install the library in dev model by cloning this repo and running pip install -e . in the repository root.
Web API and UI
LIDA comes with an optional bundled ui and web api that you can explore by running the following command:
bash
lida ui  --port=8080 --docs
Then navigate to http://localhost:8080/ in your browser. To view the web api specification, add the --docs option to the cli command, and navigate to http://localhost:8080/api/docs in your browser.
The fastest and recommended way to get started after installation will be to try out the web ui above or run the tutorial notebook.
Building the Web API and UI with Docker
The LIDA web api and ui can be setup using docker and the command below (ensure that you have docker installed, and you have set your OPENAI_API_KEY environment variable).
bash
docker compose up
Data Summarization
Given a dataset, generate a compact summary of the data.
```python from lida import Manager
lida = Manager() summary = lida.summarize("data/cars.json") # generate data summary ```
Goal Generation
Generate a set of visualization goals given a data summary.
python
goals = lida.goals(summary, n=5, persona="ceo with aerodynamics background") # generate goals
Add a persona parameter to generate goals based on that persona.
Visualization Generation
Generate, refine, execute and filter visualization code given a data summary and visualization goal. Note that LIDA represents visualizations as code.
```python
generate charts (generate and execute visualization code)
charts = lida.visualize(summary=summary, goal=goals[0], library="matplotlib") # seaborn, ggplot .. ```
Visualization Editing
Given a visualization, edit the visualization using natural language.
```python
modify chart using natural language
instructions = ["convert this to a bar chart", "change the color to red", "change y axes label to Fuel Efficiency", "translate the title to french"] editedcharts = lida.edit(code=code, summary=summary, instructions=instructions, library=library, textgenconfig=textgen_config)
```
Visualization Explanation
Given a visualization, generate a natural language explanation of the visualization code (accessibility, data transformations applied, visualization code)
```python
generate explanation for chart
explanation = lida.explain(code=charts[0].code, summary=summary) ```
Visualization Evaluation and Repair
Given a visualization, evaluate to find repair instructions (which may be human authored, or generated), repair the visualization.
python
evaluations = lida.evaluate(code=code,  goal=goals[i], library=library)
Visualization Recommendation
Given a dataset, generate a set of recommended visualizations.
python
recommendations = lida.recommend(code=code, summary=summary, n=2,  textgen_config=textgen_config)
Infographic Generation [WIP]
Given a visualization, generate a data-faithful infographic. This methods should be considered experimental, and uses stable diffusion models from the peacasso library. You will need to run pip install lida[infographics] to install the required dependencies.
python
infographics = lida.infographics(visualization = charts[0].raster, n=3, style_prompt="line art")
Using LIDA with Locally Hosted LLMs (HuggingFace)
LIDA uses the llmx library as its interface for text generation. llmx supports multiple local models including HuggingFace models. You can use the huggingface models directly (assuming you have a gpu) or connect to an openai compatible local model endpoint e.g. using the excellent vllm library.
Using HuggingFace Models Directly
```python !pip3 install --upgrade llmx==0.0.17a0
Restart the colab session
from lida import Manager from llmx import llm textgen = llm(provider="hf", model="uukuguy/speechless-llama2-hermes-orca-platypus-13b", devicemap="auto") lida = Manager(textgen=textgen)
now you can call lida methods as above e.g.
sumamry = lida.summarize("data/cars.csv") # .... ```
Using an OpenAI Compatible Endpoint e.g. vllm server
```python from lida import Manager, TextGenerationConfig , llm
modelname = "uukuguy/speechless-llama2-hermes-orca-platypus-13b" modeldetails = [{'name': modelname, 'maxtokens': 2596, 'model': {'provider': 'openai', 'parameters': {'model': model_name}}}]
assuming your vllm endpoint is running on localhost:8000
textgen = llm(provider="openai", apibase="http://localhost:8000/v1", apikey="EMPTY", models=modeldetails) lida = Manager(textgen = textgen) ```
Important Notes / Caveats / FAQs
- LIDA generates and executes code based on provided input. Ensure that you run LIDA in a secure environment with appropriate permissions.
- LIDA currently works best with datasets that have a small number of columns (<= 10). This is mainly due to the limited context size for most models. For larger datasets, consider preprocessing your dataset to use a subset of the columns.
- LIDA assumes the dataset exists and is in a format that can be loaded into a pandas dataframe. For example, a csv file, or a json file with a list of objects. In practices the right dataset may need to be curated and preprocessed to ensure that it is suitable for the task at hand.
- Smaller LLMs (e.g., OSS LLMs on Huggingface) have limited instruction following capabilities and may not work well with LIDA. LIDA works best with larger LLMs (e.g., OpenAI GPT 3.5, GPT 4).
- How reliable is the LIDA approach? The LIDA paper describes experiments that evaluate the reliability of LIDA using a visualization error rate metric. With the current version of prompts, data summarization techniques, preprocessing/postprocessing logic and LLMs, LIDA has an error rate of < 3.5% on over 2200 visualizations generated (compared to a baseline of over 10% error rate). This area is work in progress.
- Can I build my own apps with LIDA? Yes! You can either use the python api directly in your app or setup a web api endpoint and use the web api in your app. See the web api section for more details.
- How is LIDA related to OpenAI Code Interpreter: LIDA shares several similarities with code interpreter in the sense that both involve writing and executing code to address user intent. LIDA differs in its focus on visualization, providing a modular api for developer reuse and providing evaluation metrics on the visualization use case.
Naturally, some of the limitations above could be addressed by a much welcomed PR.
Community Examples Built with LIDA
- LIDA + Streamlit: lida-streamlit,
Documentation and Citation
A short paper describing LIDA (Accepted at ACL 2023 Conference) is available here.
bibtex
@inproceedings{dibia2023lida,
    title = "{LIDA}: A Tool for Automatic Generation of Grammar-Agnostic Visualizations and Infographics using Large Language Models",
    author = "Dibia, Victor",
    booktitle = "Proceedings of the 61st Annual Meeting of the Association for Computational Linguistics (Volume 3: System Demonstrations)",
    month = jul,
    year = "2023",
    address = "Toronto, Canada",
    publisher = "Association for Computational Linguistics",
    url = "https://aclanthology.org/2023.acl-demo.11",
    doi = "10.18653/v1/2023.acl-demo.11",
    pages = "113--126",
}
LIDA builds on insights in automatic generation of visualization from an earlier paper - Data2Vis: Automatic Generation of Data Visualizations Using Sequence to Sequence Recurrent Neural Networks.
Owner
- Name: Microsoft
- Login: microsoft
- Kind: organization
- Email: opensource@microsoft.com
- Location: Redmond, WA
- Website: https://opensource.microsoft.com
- Twitter: OpenAtMicrosoft
- Repositories: 7,257
- Profile: https://github.com/microsoft
Open source projects and samples from Microsoft
Citation (CITATION.cff)
cff-version: 1.2.0
message: "If you use this software, please cite it as below."
authors:
  - family-names: Dibia
    given-names: Victor
title: "LIDA: A Tool for Automatic Generation of Grammar-Agnostic Visualizations and Infographics using Large Language Models"
version: 1.0.0
date-released: 2023-07-01
url: "https://aclanthology.org/2023.acl-demo.11"
doi: "10.18653/v1/2023.acl-demo.11"
conference:
  name: "Proceedings of the 61st Annual Meeting of the Association for Computational Linguistics (Volume 3: System Demonstrations)"
  month: jul
  year: 2023
  address: "Toronto, Canada"
  publisher: "Association for Computational Linguistics"
GitHub Events
Total
- Issues event: 7
- Watch event: 359
- Issue comment event: 8
- Pull request event: 5
- Fork event: 65
Last Year
- Issues event: 7
- Watch event: 359
- Issue comment event: 8
- Pull request event: 5
- Fork event: 65
Committers
Last synced: over 1 year ago
Top Committers
| Name | Commits | |
|---|---|---|
| Victor Dibia | v****a@m****m | 91 |
| inspectorGadget | 6****a | 6 |
| Kyle Kelley | r****k@g****m | 5 |
| Microsoft Open Source | m****e | 5 |
| huangbaixi | h****i@m****m | 5 |
| trojrobert | t****t@g****m | 4 |
| Hesham | 6****t | 3 |
| Aiden | 3****n | 2 |
| AlexHorduz | 7****z | 1 |
| Ikko Eltociear Ashimine | e****r@g****m | 1 |
| JasonDing96 | 1****6 | 1 |
| Matt Hendrick | 7****k | 1 |
| Péter Gyarmati | d****y@g****m | 1 |
| microsoft-github-operations[bot] | 5****] | 1 |
| vignesh_arivazhagan | v****n@s****m | 1 |
Committer Domains (Top 20 + Academic)
Issues and Pull Requests
Last synced: 10 months ago
All Time
- Total issues: 107
- Total pull requests: 41
- Average time to close issues: 11 days
- Average time to close pull requests: 5 days
- Total issue authors: 86
- Total pull request authors: 24
- Average comments per issue: 1.48
- Average comments per pull request: 0.9
- Merged pull requests: 23
- Bot issues: 0
- Bot pull requests: 0
Past Year
- Issues: 10
- Pull requests: 7
- Average time to close issues: about 1 month
- Average time to close pull requests: less than a minute
- Issue authors: 10
- Pull request authors: 4
- Average comments per issue: 0.4
- Average comments per pull request: 0.43
- Merged pull requests: 0
- Bot issues: 0
- Bot pull requests: 0
Top Authors
Issue Authors
- victordibia (5)
- lawyinking (3)
- nssidhu (3)
- agvaishali (2)
- Omotade-MY (2)
- Jesusdiazrivero (2)
- trojrobert (2)
- 0xaaiden (2)
- nuaabuaa07 (2)
- himanshu-nakrani (2)
- MohamedKHALILRouissi (2)
- RaviChanduUmmadisetti (2)
- akozhikkot (1)
- Shu-Ji (1)
- ShaikSohail263 (1)
Pull Request Authors
- victordibia (6)
- trojrobert (4)
- Alfred-Onuada (4)
- h9-tect (4)
- TJ202 (2)
- rgbkrk (2)
- matt-hendrick (2)
- tramphan748 (2)
- bx-h (2)
- vignesh14052002 (2)
- okanyenigun (2)
- sawradip (2)
- Aya-Abdellatif (2)
- MichaelMcCulloch (2)
- IlyaKaftanov (2)
Top Labels
Issue Labels
Pull Request Labels
Packages
- Total packages: 1
-
Total downloads:
- pypi 5,387 last-month
- Total dependent packages: 4
- Total dependent repositories: 1
- Total versions: 16
- Total maintainers: 1
pypi.org: lida
LIDA: Automatic Generation of Visualizations from Data
- Homepage: https://github.com/microsoft/lida
- Documentation: https://lida.readthedocs.io/
- License: MIT License Copyright (c) Microsoft Corporation. Permission is hereby granted, free of charge, to any person obtaining a copy of this software and associated documentation files (the "Software"), to deal in the Software without restriction, including without limitation the rights to use, copy, modify, merge, publish, distribute, sublicense, and/or sell copies of the Software, and to permit persons to whom the Software is furnished to do so, subject to the following conditions: The above copyright notice and this permission notice shall be included in all copies or substantial portions of the Software. THE SOFTWARE IS PROVIDED "AS IS", WITHOUT WARRANTY OF ANY KIND, EXPRESS OR IMPLIED, INCLUDING BUT NOT LIMITED TO THE WARRANTIES OF MERCHANTABILITY, FITNESS FOR A PARTICULAR PURPOSE AND NONINFRINGEMENT. IN NO EVENT SHALL THE AUTHORS OR COPYRIGHT HOLDERS BE LIABLE FOR ANY CLAIM, DAMAGES OR OTHER LIABILITY, WHETHER IN AN ACTION OF CONTRACT, TORT OR OTHERWISE, ARISING FROM, OUT OF OR IN CONNECTION WITH THE SOFTWARE OR THE USE OR OTHER DEALINGS IN THE SOFTWARE
-
Latest release: 0.0.14
published over 2 years ago