GSAreport
GSAreport: Easy to Use Global Sensitivity Reporting - Published in JOSS (2022)
Science Score: 59.0%
This score indicates how likely this project is to be science-related based on various indicators:
-
○CITATION.cff file
-
✓codemeta.json file
Found codemeta.json file -
✓.zenodo.json file
Found .zenodo.json file -
✓DOI references
Found 7 DOI reference(s) in README -
✓Academic publication links
Links to: ieee.org, joss.theoj.org, zenodo.org -
✓Committers with academic emails
1 of 3 committers (33.3%) from academic institutions -
○Institutional organization owner
-
○JOSS paper metadata
-
○Scientific vocabulary similarity
Low similarity (17.4%) to scientific vocabulary
Keywords
Scientific Fields
Repository
Global Sensitivity reporting for Explainable AI
Basic Info
Statistics
- Stars: 14
- Watchers: 2
- Forks: 0
- Open Issues: 1
- Releases: 5
Topics
Metadata Files
README.md
 Global Sensitivity Analysis Reporting
![]()
![]()

- See here the full documentation and how to contribute
- How to install
- Quickstart and common usecases
- Runnable demo on Code Ocean
- Scientific paper
GSAreport is an application to easily generate reports that describe the global sensitivities of your input parameters as best as possible. You can use the reporting application to inspect which features are important for a given real world function / simulator or model. Using the dockerized application you can generate a report with just one line of code and no additional dependencies (except for Docker of course).
Global Sensitivity Analysis is one of the tools to better understand your machine learning models or get an understanding in real-world processes.
What is Sensitivity Analysis?
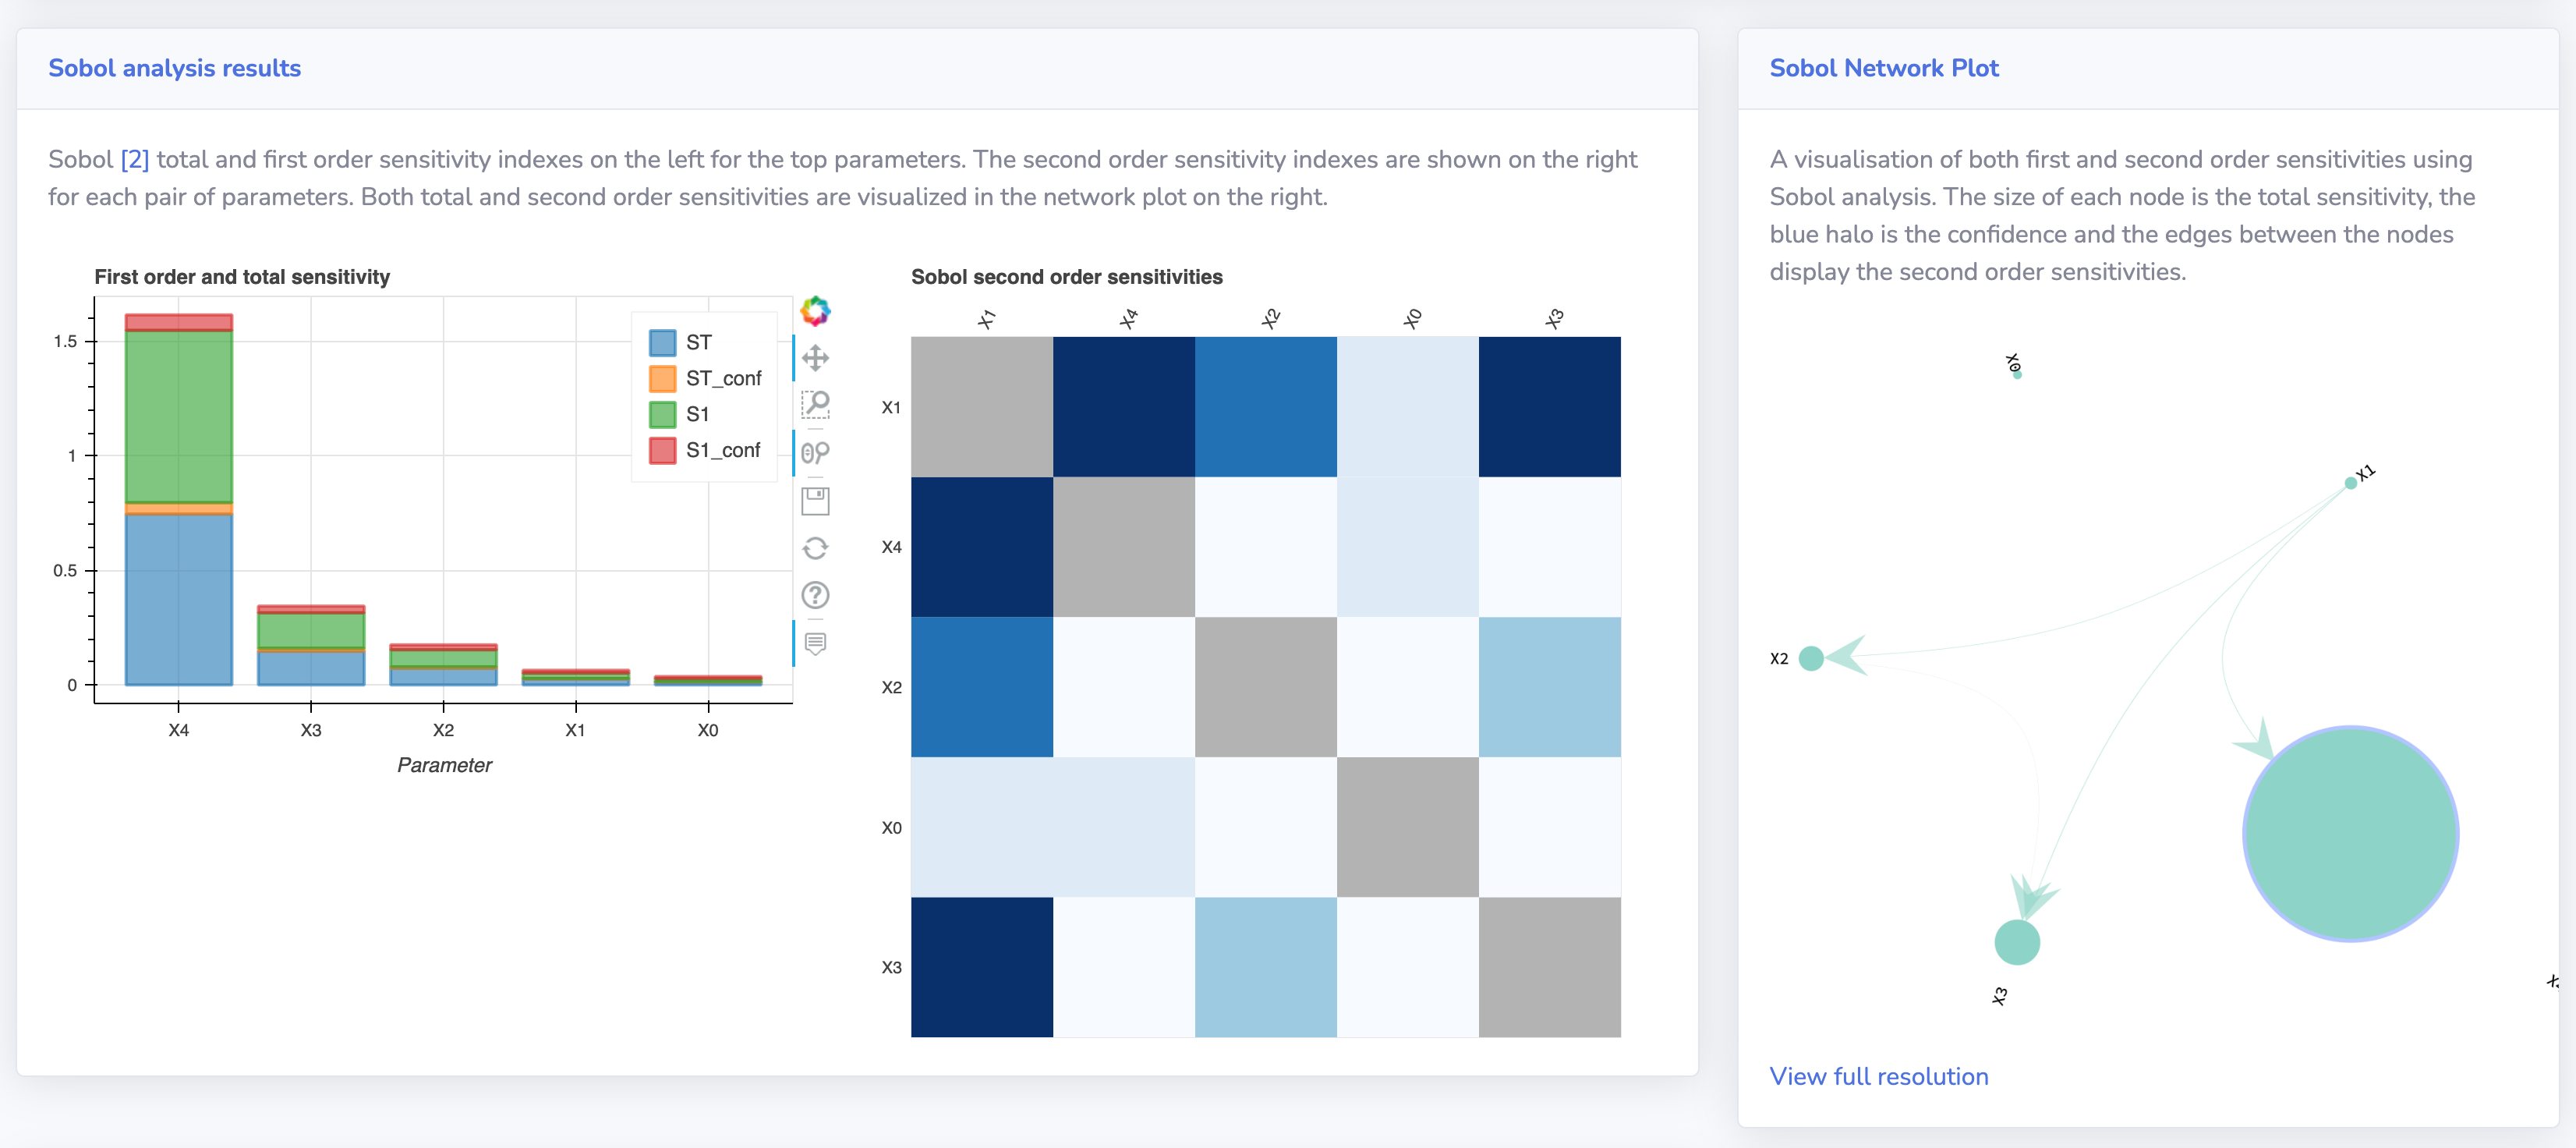
According to Wikipedia, sensitivity analysis is "the study of how the uncertainty in the output of a mathematical model or system (numerical or otherwise) can be apportioned to different sources of uncertainty in its inputs." The sensitivity of each input is often represented by a numeric value, called the sensitivity index. Sensitivity indices come in several forms:
- First-order indices: measures the contribution to the output variance by a single model input alone.
- Second-order indices: measures the contribution to the output variance caused by the interaction of two model inputs.
- Total-order index: measures the contribution to the output variance caused by a model input, including both its first-order effects (the input varying alone) and all higher-order interactions.
Sensitivity Analysis is a great way of getting a better understanding of how machine learning models work (Explainable AI), what parameters are of importance in real-world applications and processes and what interactions parameters have with other parameters.
GSAreport makes it easy to run a wide set of SA techniques and generates a nice and visually attractive report to inspect the results of these techniques. By using Docker no additional software needs to be installed and no coding experience is required.
Downloading and setting up the source code
You can also use the python package by installing the dependencies on your own system.
- Install graph-tool (https://graph-tool.skewed.de/)
- Install python 3.7+
- Install node (v14+)
- Clone the repository with git or download the zip
- Install all python requirements (
pip install -r src/requirements.txt) - Run
python src/GSAreport.py -h
How to use
Generate a global sensitivity analysis report for a given data set or function with the simple Docker / python or executable command options.
To start, you always need to provide the program with a problem definition. This definition can be supplied as json file, see also data/problem.json for an example. The problem definition contains the dimensionality of your problem (number of input variables) num_vars, the names of these variables (X0 to X4 in the example), and the bounds of each variables as a list of tuples (lower bound, upper bound).
```python
Example problem definition in python (you can store this dict using json.dump to a json file)
dim = 5 problem = { 'num_vars': dim, 'names': ['X'+str(x) for x in range(dim)], 'bounds': [[-5.0, 5.0]] * dim } ```
Once you have the problem definition (specify it with -p path/to/problem.json) you can directly load an existing data set containing input and output files for analysis by passing the path to the directory (with -d <path>) in which these files are stored. The application searches for the following csv files:
- x.csv, y.csv #optional, in case you use an existing design of experiments
- xsobol.csv, ysobol.csv
- xmorris.csv, ymorris.csv
- xlhs.csv, ylhs.csv
Sample csv files can be found in the /data/ directory of this repository. Sample files can also be generated with the --demo parameter.
When you have your own design of experiments you can store these in x and y.csv (space delimited). The Sobol, Morris and LHS (Latin Hypercube Sampling) files can be used when you have samples and results from a specific sampling technique which can be used for different Sensitivity analysis algorithms. The GSA report application can generate the x_ version of these files (the input). Using the input files you can then evaluate the data points and store the target values y in the csv file with the same name convention. If you only provide an x.csv and y.csv file, a machine learning algorithm will be used to interpolate the remaining samples to generate the appropriate design of experiments required for the sensitivity analysis.
A python example to read the x_*.csv files and produce the correspondig y_*.csv files using your own objective function is provided in the next section.
Testing the Installation
Run
zsh
cd src
python -m pytest
To execute the automated tests to verify the installation.
Building binaries (for developers)
If you want to build the executables yourself you can use the following commands. We use pyinstaller to package the executables.
Make sure you have pyinstaller installed using pip install pyinstaller.
On your operating system, build the exe once you have the python source code up and running:
zsh
pyinstaller --distpath dist/darwin/ GSAreport.spec
We provide binaries for Linux and Mac-OS in the releases section.
To generate a new version of the documentation run mike deploy --push --update-aliases 1.3.0 latest
References
This tool uses Savvy [1] and SALib [2].
[1] Hough, B., Fu, C. and Paliwal, S. (2016). savvy: visualize high dimensionality sensitivity analysis data. Updated with full sensitivity analysis from ligpy model. (v2.0). Zenodo. https://doi.org/10.5281/zenodo.53099
[2] Herman, J. and Usher, W. (2017) SALib: An open-source Python library for sensitivity analysis. Journal of Open Source Software, 2(9). doi:10.21105/joss.00097
Cite our paper
Use the following bibtex to cite our paper when you use GSAreport.
@ARTICLE{9903639,
    author={Stein, Niki van and Raponi, Elena and Sadeghi, Zahra and Bouman, Niek and Van Ham, Roeland C. H. J. and Bäck, Thomas},
    journal={IEEE Access},
    title={A Comparison of Global Sensitivity Analysis Methods for Explainable AI With an Application in Genomic Prediction},
    year={2022},
    volume={10},
    number={},
    pages={103364-103381},
    doi={10.1109/ACCESS.2022.3210175}
}
Owner
- Name: Niki van Stein
- Login: nikivanstein
- Kind: user
- Location: Leiden, the Netherlands
- Company: Univerity Leiden
- Website: https://nikivanstein.nl
- Repositories: 1
- Profile: https://github.com/nikivanstein
Researcher at University Leiden and cofounder of @Van-Stein-Groentjes-B-V
GitHub Events
Total
- Issues event: 1
- Watch event: 5
Last Year
- Issues event: 1
- Watch event: 5
Committers
Last synced: 12 months ago
Top Committers
| Name | Commits | |
|---|---|---|
| Bas van Stein | b****2@g****m | 141 |
| Bas van Stein | s****n@l****l | 10 |
| Elena | 7****i | 2 |
Committer Domains (Top 20 + Academic)
Issues and Pull Requests
Last synced: 11 months ago
All Time
- Total issues: 10
- Total pull requests: 20
- Average time to close issues: 2 days
- Average time to close pull requests: 1 day
- Total issue authors: 4
- Total pull request authors: 1
- Average comments per issue: 1.8
- Average comments per pull request: 0.05
- Merged pull requests: 20
- Bot issues: 0
- Bot pull requests: 0
Past Year
- Issues: 1
- Pull requests: 0
- Average time to close issues: N/A
- Average time to close pull requests: N/A
- Issue authors: 1
- Pull request authors: 0
- Average comments per issue: 0.0
- Average comments per pull request: 0
- Merged pull requests: 0
- Bot issues: 0
- Bot pull requests: 0
Top Authors
Issue Authors
- xtruan (4)
- elenaraponi (3)
- rreinecke (2)
- Saran-nns (1)
Pull Request Authors
- nikivanstein (24)
Top Labels
Issue Labels
Pull Request Labels
Dependencies
- mike *
- mkdocs ==1.2.3
- mkdocs-material *
- mkgendocs ==0.9.0
- IProgress ==0.4
- Jinja2 ==3.0.3
- MarkupSafe ==2.0.1
- Pillow ==9.0.0
- Pygments ==2.11.2
- SALib ==1.4.5
- Send2Trash ==1.8.0
- appnope ==0.1.2
- argon2-cffi ==21.3.0
- argon2-cffi-bindings ==21.2.0
- attrs ==21.4.0
- backcall ==0.2.0
- bleach ==4.1.0
- cffi ==1.15.0
- colorama ==0.4.4
- cycler ==0.11.0
- deap ==1.3.1
- debugpy ==1.5.1
- decorator ==5.1.1
- defusedxml ==0.7.1
- dill ==0.3.4
- entrypoints ==0.3
- fonttools ==4.28.5
- importlib-resources ==5.4.0
- ipykernel ==6.6.1
- ipython ==7.31.0
- ipython-genutils ==0.2.0
- ipywidgets ==7.6.5
- jedi ==0.18.1
- joblib ==1.1.0
- jsonschema ==4.4.0
- jupyter-client ==7.1.0
- jupyter-core ==4.9.1
- jupyterlab-pygments ==0.1.2
- jupyterlab-widgets ==1.0.2
- kiwisolver ==1.3.2
- matplotlib ==3.5.1
- matplotlib-inline ==0.1.3
- mistune ==0.8.4
- multiprocess ==0.70.12.2
- nbclient ==0.5.10
- nbconvert ==6.4.0
- nbformat ==5.1.3
- nest-asyncio ==1.5.4
- notebook ==6.4.7
- numpy ==1.22.0
- packaging ==21.3
- pandas ==1.3.5
- pandocfilters ==1.5.0
- parso ==0.8.3
- pathos ==0.2.8
- pexpect ==4.8.0
- pickleshare ==0.7.5
- pox ==0.3.0
- ppft ==1.6.6.4
- prometheus-client ==0.12.0
- prompt-toolkit ==3.0.24
- ptyprocess ==0.7.0
- pycparser ==2.21
- pyparsing ==3.0.6
- pyrsistent ==0.18.1
- python-dateutil ==2.8.2
- pytz ==2021.3
- pyzmq ==22.3.0
- scikit-learn ==1.0.2
- scipy ==1.7.3
- seaborn ==0.11.2
- six ==1.16.0
- sklearn ==0.0
- terminado ==0.12.1
- testpath ==0.5.0
- threadpoolctl ==3.0.0
- tornado ==6.1
- tqdm ==4.62.3
- traitlets ==5.1.1
- wcwidth ==0.2.5
- webencodings ==0.5.1
- widgetsnbextension ==3.5.2
- zipp ==3.7.0
- CacheControl ==0.12.6
- Jinja2 ==3.0.3
- MarkupSafe ==2.0.1
- Pillow ==8.4.0
- PyGObject ==3.42.0
- PyYAML ==6.0
- Pygments ==2.11.1
- SALib ==1.4.5
- Send2Trash ==1.8.0
- appdirs ==1.4.4
- argon2-cffi ==21.1.0
- async-generator ==1.10
- attrs ==21.3.0
- backcall ==0.2.0
- black ==22.3.0
- bleach ==4.1.0
- bokeh ==2.4.2
- cairocffi ==1.3.0
- cffi ==1.15.0
- chardet ==4.0.0
- cloudpickle ==2.1.0
- colorama ==0.4.4
- contextlib2 ==0.6.0.post1
- cryptography ==36.0.1
- cycler ==0.10.0
- deap ==1.3.1
- debugpy ==1.5.1
- decorator ==5.1.0
- defusedxml ==0.7.1
- dill ==0.3.4
- distlib ==0.3.3
- distro ==1.6.0
- entrypoints ==0.3
- fonttools ==4.28.5
- html5lib ==1.1
- idna ==3.3
- importlib-metadata ==4.8.1
- ipykernel ==6.6.0
- ipython ==7.30.1
- ipython-genutils ==0.2.0
- ipywidgets ==7.6.5
- isort ==5.10.1
- jedi ==0.18.1
- joblib ==1.1.0
- jsonschema ==3.2.0
- jupyter-client ==7.1.0
- jupyter-console ==6.4.0
- jupyter-core ==4.9.1
- jupyterlab-pygments ==0.1.2
- kiwisolver ==1.3.2
- llvmlite ==0.38.1
- matplotlib ==3.5.1
- matplotlib-inline ==0.1.3
- mistune ==0.8.4
- more-itertools ==8.10.0
- msgpack ==1.0.3
- multiprocess ==0.70.12.2
- nbclient ==0.5.4
- nbconvert ==6.1.0
- nbformat ==5.1.3
- nest-asyncio ==1.5.4
- notebook ==6.4.4
- numba ==0.55.2
- numpy ==1.21.5
- ordered-set ==4.0.2
- packaging ==21.3
- pandas ==1.3.5
- pandas-bokeh ==0.5.5
- pandocfilters ==1.4.3
- parso ==0.8.2
- pathos ==0.2.8
- pep517 ==0.12.0
- pexpect ==4.8.0
- pickleshare ==0.7.5
- ply ==3.11
- pox ==0.3.0
- ppft ==1.6.6.4
- progress ==1.6
- prometheus-client ==0.11.0
- prompt-toolkit ==3.0.24
- ptyprocess ==0.7.0
- pyOpenSSL ==21.0.0
- pycairo ==1.20.1
- pycparser ==2.21
- pyparsing ==2.4.7
- pyrsistent ==0.18.0
- python-dateutil ==2.8.2
- pytz ==2021.3
- pyzmq ==22.2.1
- requests ==2.26.0
- resolvelib ==0.5.5
- retrying ==1.3.3
- scikit-learn ==1.0.2
- scipy ==1.7.3
- shap ==0.40.0
- six ==1.16.0
- sklearn ==0.0
- slicer ==0.0.7
- terminado ==0.11.1
- testpath ==0.5.0
- threadpoolctl ==3.1.0
- toml ==0.10.2
- tomli ==1.2.2
- tornado ==6.1
- tqdm ==4.64.0
- traitlets ==5.1.0
- typing-extensions ==4.2.0
- urllib3 ==1.26.7
- wcwidth ==0.2.5
- webencodings ==0.5.1
- widgetsnbextension ==3.5.1
- xcffib ==0.11.1
- zipp ==3.6.0
- zstandard ==0.16.0
- actions/checkout v2 composite
- actions/setup-python v2 composite
- actions/checkout v3 composite
- docker/build-push-action ad44023a93711e3deb337508980b4b5e9bcdc5dc composite
- docker/login-action f054a8b539a109f9f41c372932f1ae047eff08c9 composite
- docker/metadata-action 98669ae865ea3cffbcbaa878cf57c20bbf1c6c38 composite
- SALib *
- bokeh *
- matplotlib *
- numpy *
- pandas *
- scikit-learn *
- shap *
- actions/checkout v3 composite
- actions/setup-python v3 composite
- pypa/gh-action-pypi-publish release/v1 composite