Science Score: 57.0%
This score indicates how likely this project is to be science-related based on various indicators:
-
✓CITATION.cff file
Found CITATION.cff file -
✓codemeta.json file
Found codemeta.json file -
✓.zenodo.json file
Found .zenodo.json file -
✓DOI references
Found 4 DOI reference(s) in README -
○Academic publication links
-
○Academic email domains
-
○Institutional organization owner
-
○JOSS paper metadata
-
○Scientific vocabulary similarity
Low similarity (15.1%) to scientific vocabulary
Repository
Plotting graphs from XVGs generated by GROMACS in Python
Basic Info
Statistics
- Stars: 28
- Watchers: 0
- Forks: 5
- Open Issues: 3
- Releases: 4
Metadata Files
README.md
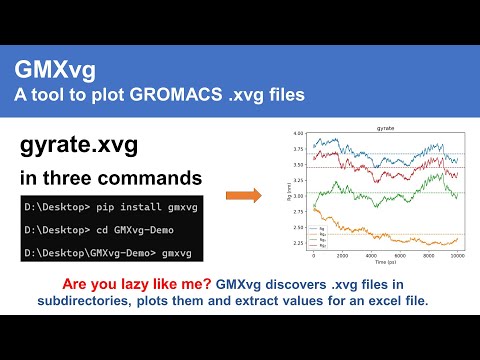
GMXvg: A tool to plot GROMACS .xvg files
GMXvg is a command-line utility designed for converting and plotting GROMACS XVG files. It simplifies the process of handling XVG files by automatically discovering all XVG files in the current or subdirectories and converting them to specified file formats, with JPG as the default format. Additionally, GMXvg logs the summary of plots in a CSV file, providing quick access to plot values along with their standard deviation.
Features
- Automatically discovers and converts GROMACS XVG files.
- Supports conversion to multiple file formats (e.g., JPG, PNG, PDF).
- Logs plot summaries in a CSV file for easy access to plot values and standard deviations.
- Provides options to customize plot titles, legends, and other outputs.
- Merge multiple plots
Quick Installation and Usage
Install using pypi or other directly from source using python's pip module:
- Install using:
pip install gmxvg - Check Version:
gmxvg --version - Help options:
gmxvg -h - Video tutorial or demo
- Example CSV output

Supported Platforms
GMXvg is developed and tested for Ubuntu (20, 22, 24) and Windows (10, 11) environments. However, it is expected to work on all Windows, Linux, and macOS platforms.
Customise output
Command Structure
gmxvg --<key>=<value>: Double dash separated by equal signgmxvg -<key> <val1> <val2> <val3>Single dash (single dash is not recommended) and multiple values
Overriding default variables
Use gmxvg -h to see all options.
path_base: Base path if running from different directorycsv_filename: File name for CSV output else default will be usedcsv_filepath: Path where CSV output file will be storedpath_move: Path where generated images will be moved (images will be deleted from the dir where XVG are stored)path_copy: Path where generated images will be copied (source graphics will NOT be deleted)pattern_xvg: Pattern to specify XVG images for conversion e.g., --new.xvg, *-RMSD.xvg (Helpful when you want to convert some selected files)merge_patterns: Pattern to select XVGs to group their output e.g., Protein-*-RMSD.xvg (This will merge file names matching the pattern into single graph for comparative visualisation)export_ext: Type of outputs, e.g., JPEG, PNG, JPG, PDF (Any output format supported by Matplotlib)dpi: Resolution of the output, e.g., 72 for quick visualisation and 600 for standard publicationsflag_plot_mean: yes|no; Use yes to enable plotting average value lineflag_plot_std: yes|no; Use yes to enable plotting standard deviation lineflag_export_csv: yes|no; If results should be exported in a CSV file (includes directory name, file name, average of lines plotted and their standard deviation)flag_export_plot: yes|no; To specify if graphics should be exported or not (in case only values are needed)
Executable Files (Older version NOT RECOMMENDED!)
- Download GMXvg executable file (Windows 10/11) and copy/paste the exe file in the directory where XVGs are contained. It will discover all xvg extension files in current or child folders and process them automatically.
pathbase_: Define path if not running from the same directory
gmxvg --path_base <path-to-dir-containing-xvg-files>
dpi: Generate multiple qualities of graphics
gmxvg --dpi 96 300 600 --path_copy <path-to-aggregate-results-outside>
pathcopy_: Copy all the generated graphs to another directory
gmxvg --path_copy <path-to-aggregate-results-outside>
Export in multiple format(s)
gmxvg --export_ext JPEG pdf
mergepatterns_: Merging multiple plots
- To merge multiple xvg files having ending (e.g., /complex1/lig.xvg, /complex2/lig.xvg, /complex3/lig.xvg) passed to
--merge_patterns RMSD.xvgso that it will combine all to plot one file.--uid_part -1parameter can be useful to define the Legend of the merged graphs.
gmxvg --merge_patterns RMSD-of-Ligand.xvg RMSD-of-Protein-C-Alpha.xvg Gyration-of-Protein.xvg NPT-Temperature.xvg Inter-Ligand-Protein-H-Bonds.xvg
- Example to merge Protein-RMSD.xvg and Ligand-RMSD.xvg files in the same directory.
gmxvg --merge_patterns RMSD.xvg --uid_part -1
Managing texts on the plots
- Use
-replacementsoptions to replace any text in the plot will change the labels and legends of the plotgmxvg --replacements "Receptor1--Lig2":p53-miR5 "Recptor2--Lig3":p53-miR3
Development and Future Plans
GMXvg is open-source and welcomes contributions. Future plans include:
- GUI or web interface for interactive visualization.
- Customizable labels and text through GUI.
- Fast and efficient executable.
For development and contributions, fork the repository or create a pull request.
Accessory Details
- The code is free to use by students, scholars, and professors.
- If you find the work useful and want to provide credit, you can cite the source code using DOI:10.5281/zenodo.6563931.
Troubleshooting installation
If you encounter installation issues, try using the pip cache purge command pip cache purge.
Owner
- Name: The Biomics
- Login: TheBiomics
- Kind: user
- Company: @TheBiomicsIndia
- Website: https://www.thebiomics.com
- Twitter: TheBiomics
- Repositories: 2
- Profile: https://github.com/TheBiomics
@TheBiomicsIndia Administrator
Citation (CITATION.cff)
cff-version: 1.2.0
title: 'GMXvg: A tool to plot GROMACS .xvg files'
message: >-
  Consider citing this package if used using the
  metadata from this file.
type: software
authors:
  - affiliation: 'Dr. D.Y. Patil Vidyapeeth, Pune'
    family-names: Sahu
    given-names: Vishal Kumar
    orcid: 'https://orcid.org/0000-0003-1487-3526'
  - affiliation: 'Dr. D.Y. Patil Vidyapeeth, Pune'
    family-names: Ranjan
    given-names: Amit
    orcid: 'https://orcid.org/0000-0002-7900-982X'
  - affiliation: 'Dr. D.Y. Patil Vidyapeeth, Pune'
    family-names: Basu
    given-names: Soumya
    orcid: 'https://orcid.org/0000-0002-1726-0154'
identifiers:
  - type: doi
    value: 10.5281/zenodo.6563931
  - type: url
    value: 'https://github.com/TheBiomics/GMXvg'
repository-code: 'https://github.com/TheBiomics/GMXvg'
url: 'https://www.thebiomics.com/node/637'
abstract: An Automated Drug Discovery Pipeline
keywords:
  - GROMACS XVG Plot
  - Graph Plot
  - XMGrace
version: v0.4.8
date-released: '2024-05-25'
GitHub Events
Total
- Issues event: 2
- Watch event: 9
- Delete event: 2
- Issue comment event: 4
- Push event: 10
- Create event: 3
Last Year
- Issues event: 2
- Watch event: 9
- Delete event: 2
- Issue comment event: 4
- Push event: 10
- Create event: 3
Packages
- Total packages: 1
-
Total downloads:
- pypi 100 last-month
- Total dependent packages: 0
- Total dependent repositories: 0
- Total versions: 6
- Total maintainers: 1
pypi.org: gmxvg
A tool to plot GROMACS .xvg files.
- Homepage: https://github.com/TheBiomics/GMXvg
- Documentation: https://gmxvg.readthedocs.io/
- License: gpl-3.0
-
Latest release: 0.4.20230830
published almost 3 years ago
Rankings
Maintainers (1)
Dependencies
- UtilityLib *
- latex *
- matplotlib *
- pandas *