https://github.com/beardymcjohnface/spers
SPatialomics Enhanced Research Suite
Science Score: 13.0%
This score indicates how likely this project is to be science-related based on various indicators:
-
○CITATION.cff file
-
✓codemeta.json file
Found codemeta.json file -
○.zenodo.json file
-
○DOI references
-
○Academic publication links
-
○Academic email domains
-
○Institutional organization owner
-
○JOSS paper metadata
-
○Scientific vocabulary similarity
Low similarity (9.7%) to scientific vocabulary
Repository
SPatialomics Enhanced Research Suite
Basic Info
- Host: GitHub
- Owner: beardymcjohnface
- Language: Python
- Default Branch: main
- Size: 90.1 MB
Statistics
- Stars: 8
- Watchers: 4
- Forks: 2
- Open Issues: 1
- Releases: 0
Metadata Files
README.md
SPERS
SPatialomics Enhanced Research Suite
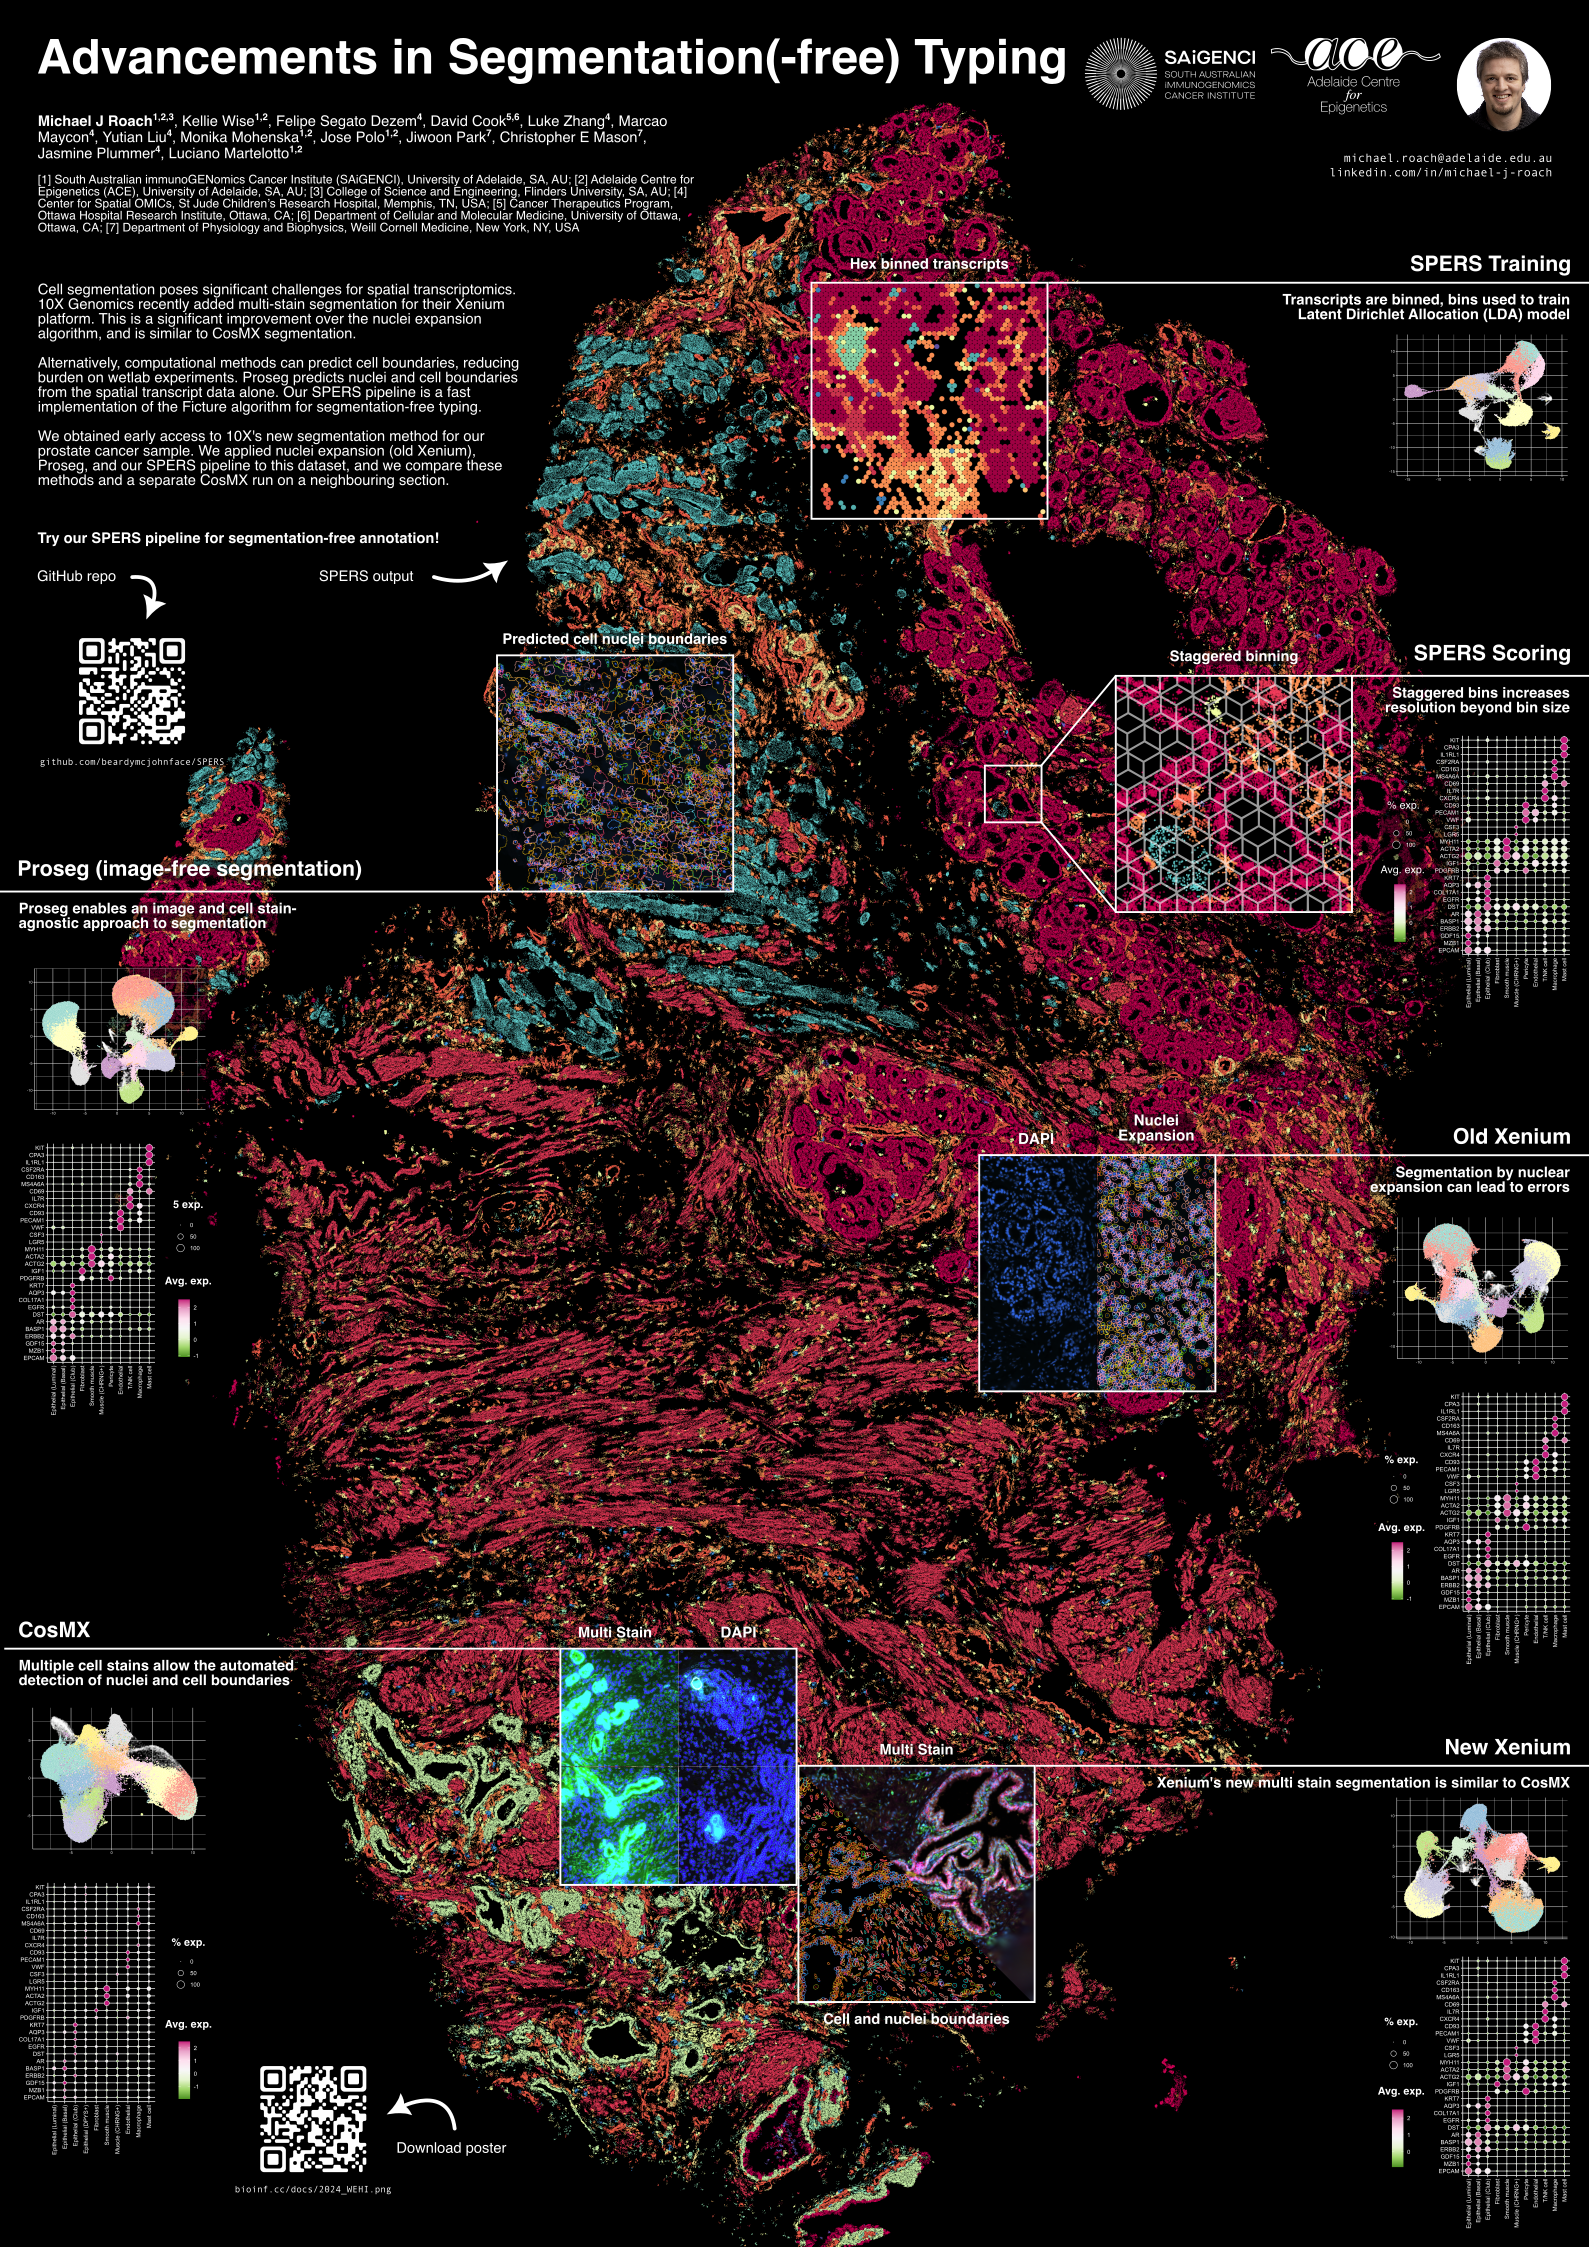
This package is intended to house a collection of pipelines for spatialomics analysis. It currently only includes our Ficture implementation.
Install
```shell
create a conda env for the install
conda create -n spers python=3.12 conda activate spers
clone this repo
git clone https://github.com/beardymcjohnface/SPERS.git cd SPERS/
install
pip install -e .
check
spers --help spers ficture --help
to update - just use git
git pull ```
Ficture wrapper
Wrapper for the ficture package, including file conversion.
```shell
for xenium
spers ficture --input transcripts.csv.gz --platform xenium
for cosmx
spers ficture --input transcripts.csv.gz --platform cosmx ```
Run the test dataset
shell
spers ficture-test
Current steps covered: - Convert CosMX or Xenium CSV to TSV - Hex binning - Minibatch binning for model training - Model generation - Trained model plot - Transcript rescoring (with overlapping hex bins) - Final plot
Get bins of clustered transcripts
This will let you analyse with single cell tools. TODO: add this as default output.
```python import pandas as pd from spers.ficture.workflow.scripts.hexbin import transcripttohexbins
transcriptsdf = pd.readcsv( "spers.out/ficture/results/transcripts.tsv.gz", sep="\t", compression="gzip", indexcol="transcriptid") scoreddf = pd.readcsv( "spers.out/ficture/results/scoredtranscripts/transcripts.rescored.tsv.gz", sep="\t", compression="gzip", indexcol="transcript_id")
transcriptsdf = pd.concat((transcriptsdf, scoreddf), axis=1, join="inner") transcriptsdf = transcripttohexbins(transcriptsdf, hexwidth=16) # I used 24 but 16 um is probably better IDK transcriptsdf = transcriptsdf.groupby(["hexid", "topK", "gene"]).size().resetindex() transcriptsdf["bin"] = transcriptsdf.groupby(["hexid", "topK"]).ngroup() transcriptsdf = transcriptsdf.loc[:, ["bin", "gene", 0]] transcriptsdf = pd.pivottable(transcriptsdf, index="bin", values=0, columns="gene", fillvalue=0) transcriptsdf.tocsv("spers.out/ficture/results/transcripts.scored.binned.csv") ```
You will probably want to filter low count bins when analysing.
```r spers = read.csv( "spers.out/ficture/results/transcripts.scored.binned.csv", row.names = 1) spers = t(as.matrix(spers)) spers = CreateSeuratObject( counts=spers, min.cells = 3, min.features = 16 )
...
```
Have a look at our preliminary comparison HERE
GitHub Events
Total
Last Year
Issues and Pull Requests
Last synced: over 1 year ago
All Time
- Total issues: 1
- Total pull requests: 0
- Average time to close issues: N/A
- Average time to close pull requests: N/A
- Total issue authors: 1
- Total pull request authors: 0
- Average comments per issue: 0.0
- Average comments per pull request: 0
- Merged pull requests: 0
- Bot issues: 0
- Bot pull requests: 0
Past Year
- Issues: 1
- Pull requests: 0
- Average time to close issues: N/A
- Average time to close pull requests: N/A
- Issue authors: 1
- Pull request authors: 0
- Average comments per issue: 0.0
- Average comments per pull request: 0
- Merged pull requests: 0
- Bot issues: 0
- Bot pull requests: 0
Top Authors
Issue Authors
- pakiessling (1)