https://github.com/biocore/evident
Science Score: 33.0%
This score indicates how likely this project is to be science-related based on various indicators:
-
○CITATION.cff file
-
○codemeta.json file
-
○.zenodo.json file
-
✓DOI references
Found 1 DOI reference(s) in README -
✓Academic publication links
Links to: biorxiv.org -
✓Committers with academic emails
1 of 4 committers (25.0%) from academic institutions -
○Institutional organization owner
-
○JOSS paper metadata
-
○Scientific vocabulary similarity
Low similarity (13.2%) to scientific vocabulary
Repository
Basic Info
- Host: GitHub
- Owner: biocore
- License: bsd-3-clause
- Language: Python
- Default Branch: master
- Size: 2.16 MB
Statistics
- Stars: 15
- Watchers: 9
- Forks: 9
- Open Issues: 4
- Releases: 0
Metadata Files
README.md



Evident
Evident is a tool for performing effect size and power calculations on microbiome data.
Installation
You can install the most up-to-date version of Evident from PyPi using the following command:
pip install evident
QIIME 2
Evident is also available as a QIIME 2 plugin. Make sure you have activated a QIIME 2 environment and run the same installation command as above.
To check that Evident installed correctly, run the following from the command line:
qiime evident --help
You should see something like this if Evident installed correctly:
``` Usage: qiime evident [OPTIONS] COMMAND [ARGS]...
Description: Perform power analysis on microbiome data. Supports calculation of effect size given metadata covariates and supporting visualizations.
Plugin website: https://github.com/biocore/evident
Getting user support: Please post to the QIIME 2 forum for help with this plugin: https://forum.qiime2.org
Options: --version Show the version and exit. --example-data PATH Write example data and exit. --citations Show citations and exit. --help Show this message and exit.
Commands: multivariate-effect-size-by-category Multivariate data effect size by category. multivariate-power-analysis Multivariate data power analysis. plot-power-curve Plot power curve. univariate-effect-size-by-category Univariate data effect size by category. univariate-power-analysis Univariate data power analysis. univariate-power-analysis-repeated-measures Univariate data power analysis for repeated measures.
visualize-results Tabulate evident results. ```
Standalone Usage
Evident can operate on two types of data:
- Univariate (vector)
- Multivariate (distance matrix)
Univariate data can be alpha diversity. log ratios, PCoA coordinates, etc. Multivariate data is usually a beta diversity distance matrix.
For this tutorial we will be using alpha diversity values, but the commands are nearly the same for beta diversity distance matrices.
First, open Python and import Evident
python
import evident
Next, load your diversity file and sample metadata.
```python import pandas as pd
metadata = pd.readtable("data/metadata.tsv", sep="\t", indexcol=0) faithpd = metadata["faithpd"] ```
The main data structure in Evident is the 'DataHandler'.
This is the way that Evident stores the data and metadata for power calculations.
For our alpha diversity example, we'll load the UnivariateDataHandler class from Evident.
UnivariateDataHandler takes as input the pandas Series with the diversity values and the pandas DataFrame containing the sample metadata.
By default, Evident will only consider metadata columns with, at max, 5 levels.
We choose 5 samples as the default value because columns with more than 5 groups may be indicative of technical columns (e.g. subject ID).
To modify this behavior, provide a value for the max_levels_per_category argument.
You can set this value to -1 to not provide an upper limit of levels at which to drop a column.
Additionally, Evident will not consider any category levels represented by fewer than 3 samples.
We choose 3 samples as the default value because levels with fewer than 3 samples may exhibit high variances.
To modify this behavior, use the min_count_per_level argument (must be > 1).
python
adh = evident.UnivariateDataHandler(faith_pd, metadata)
Next, let's say we want to get the effect size of the diversity differences between two groups of samples. We have in our example a column in the metadata "classification" comparing two groups of patients with Crohn's disease. First, we'll look at the mean of Faith's PD between these two groups.
python
metadata.groupby("classification").agg(["count", "mean", "std"])["faith_pd"]
which results in
                count       mean       std
classification
B1                 99  13.566110  3.455625
Non-B1            121   9.758946  3.874911
Looks like there's a pretty large difference between these two groups. What we would like to do now is calculate the effect size of this difference. Because we are comparing only two groups, we can use Cohen's d. Evident automatically chooses the correct effect size to calculate - either Cohen's d if there are only two categories or Cohen's f if there are more than 2.
python
adh.calculate_effect_size(column="classification")
This tells us that our effect size is 1.03.
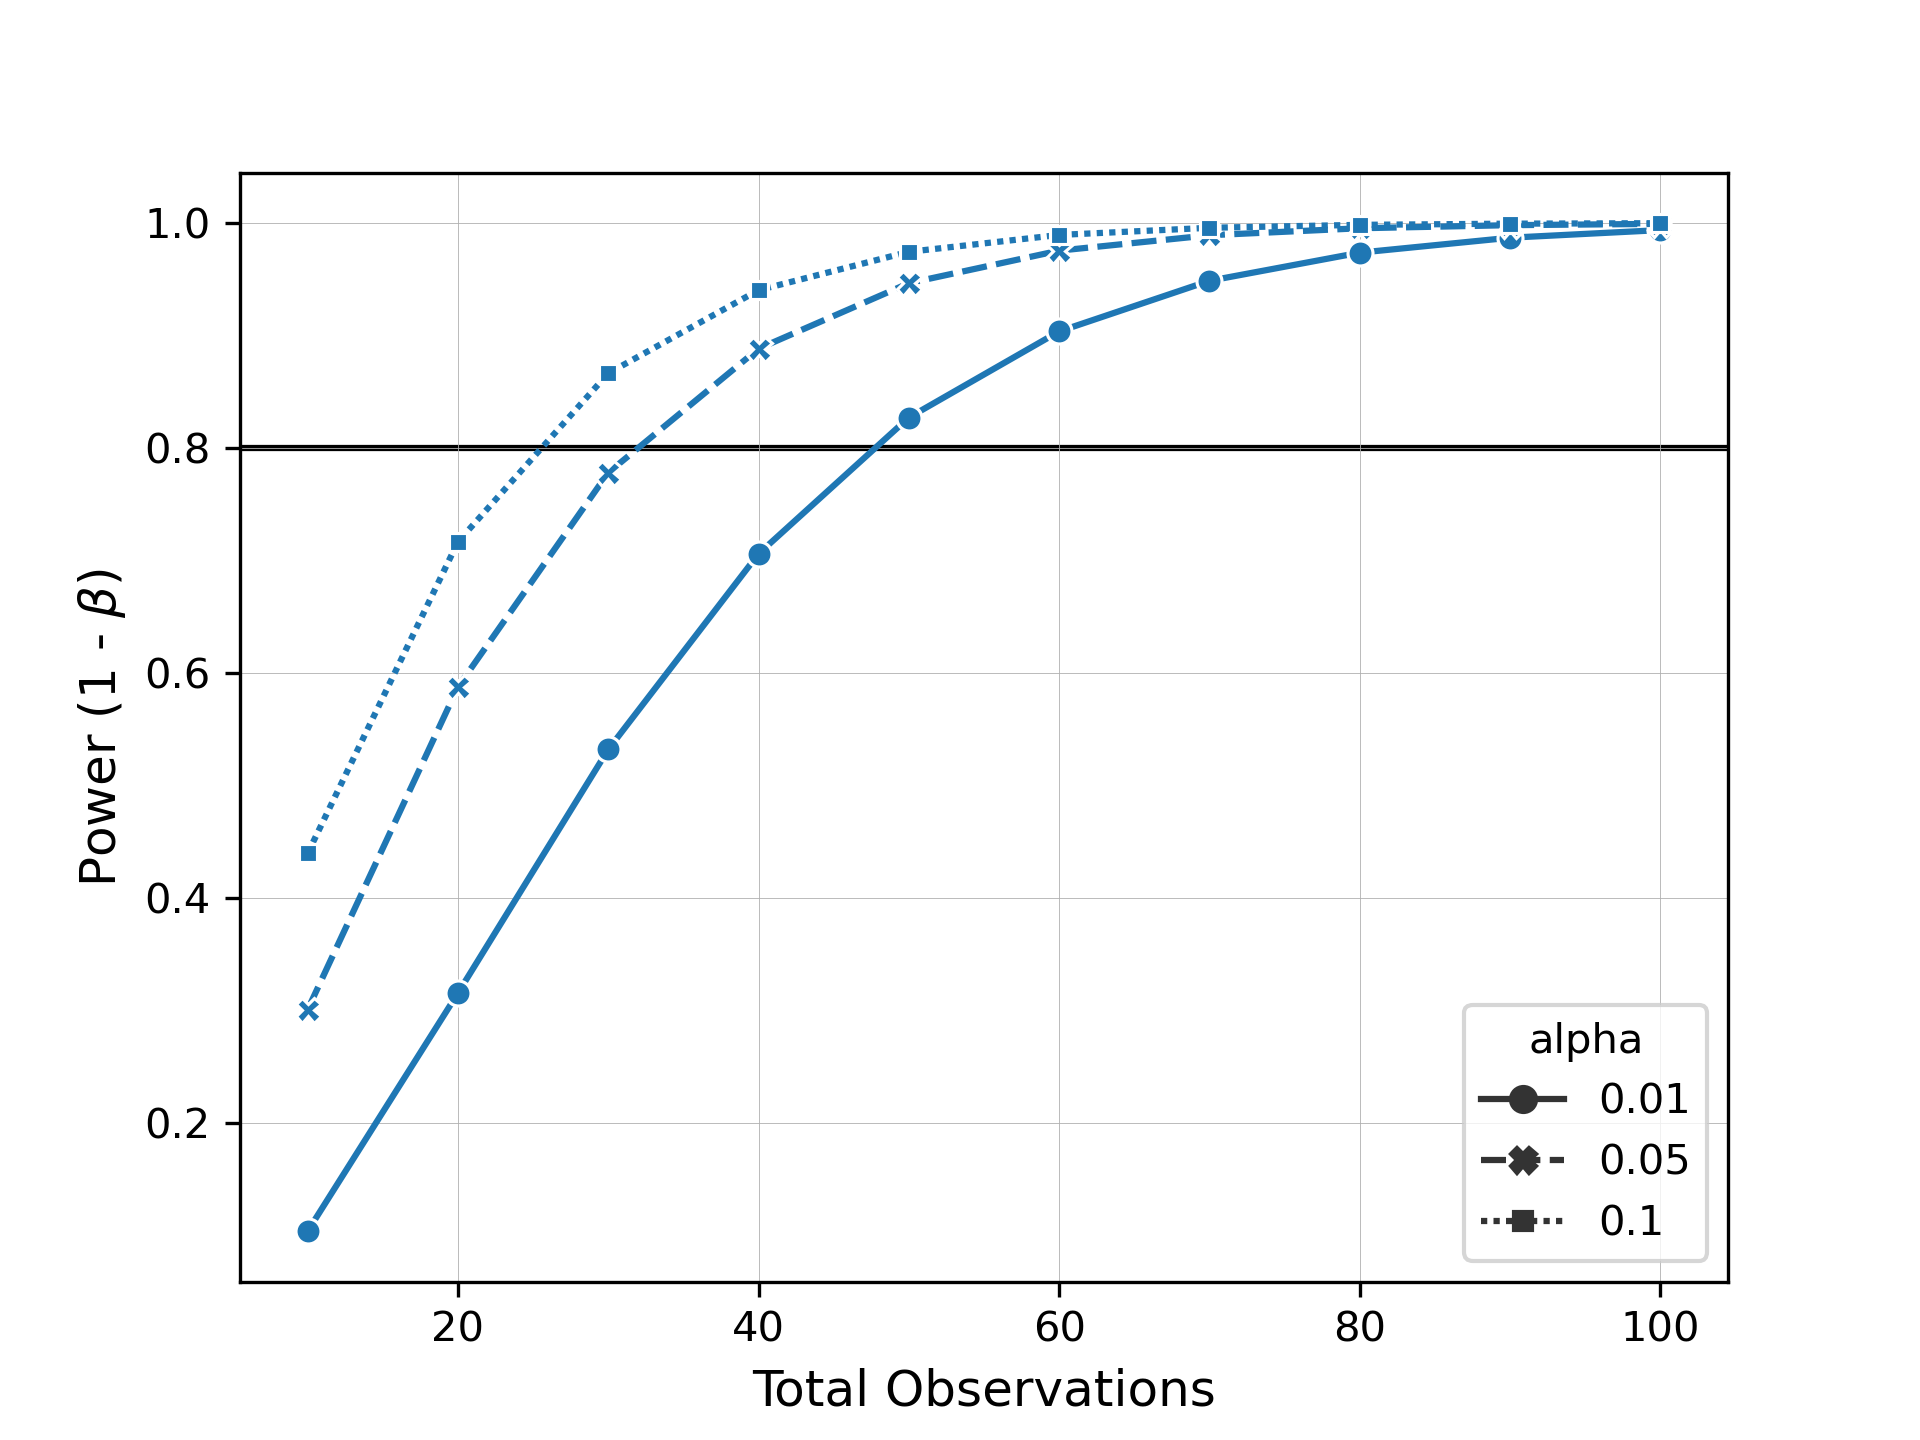
Now let's say we want to see how many samples we need to be able to detect this difference with a power of 0.8. Evident allows you to easily specify arguments for alpha, power, or total observations for power analysis. We can then plot these results as a power curve to summarize the data.
```python from evident.plotting import plotpowercurve import numpy as np
alphavals = [0.01, 0.05, 0.1] obsvals = np.arange(10, 101, step=10) results = adh.poweranalysis( "classification", alpha=alphavals, totalobservations=obsvals ) plotpowercurve(results, target_power=0.8, style="alpha", markers=True) ```
When we inspect this plot, we can see how many samples we would need to collect to observe the same effect size at different levels of significance and power.
Interactive power curve with Bokeh
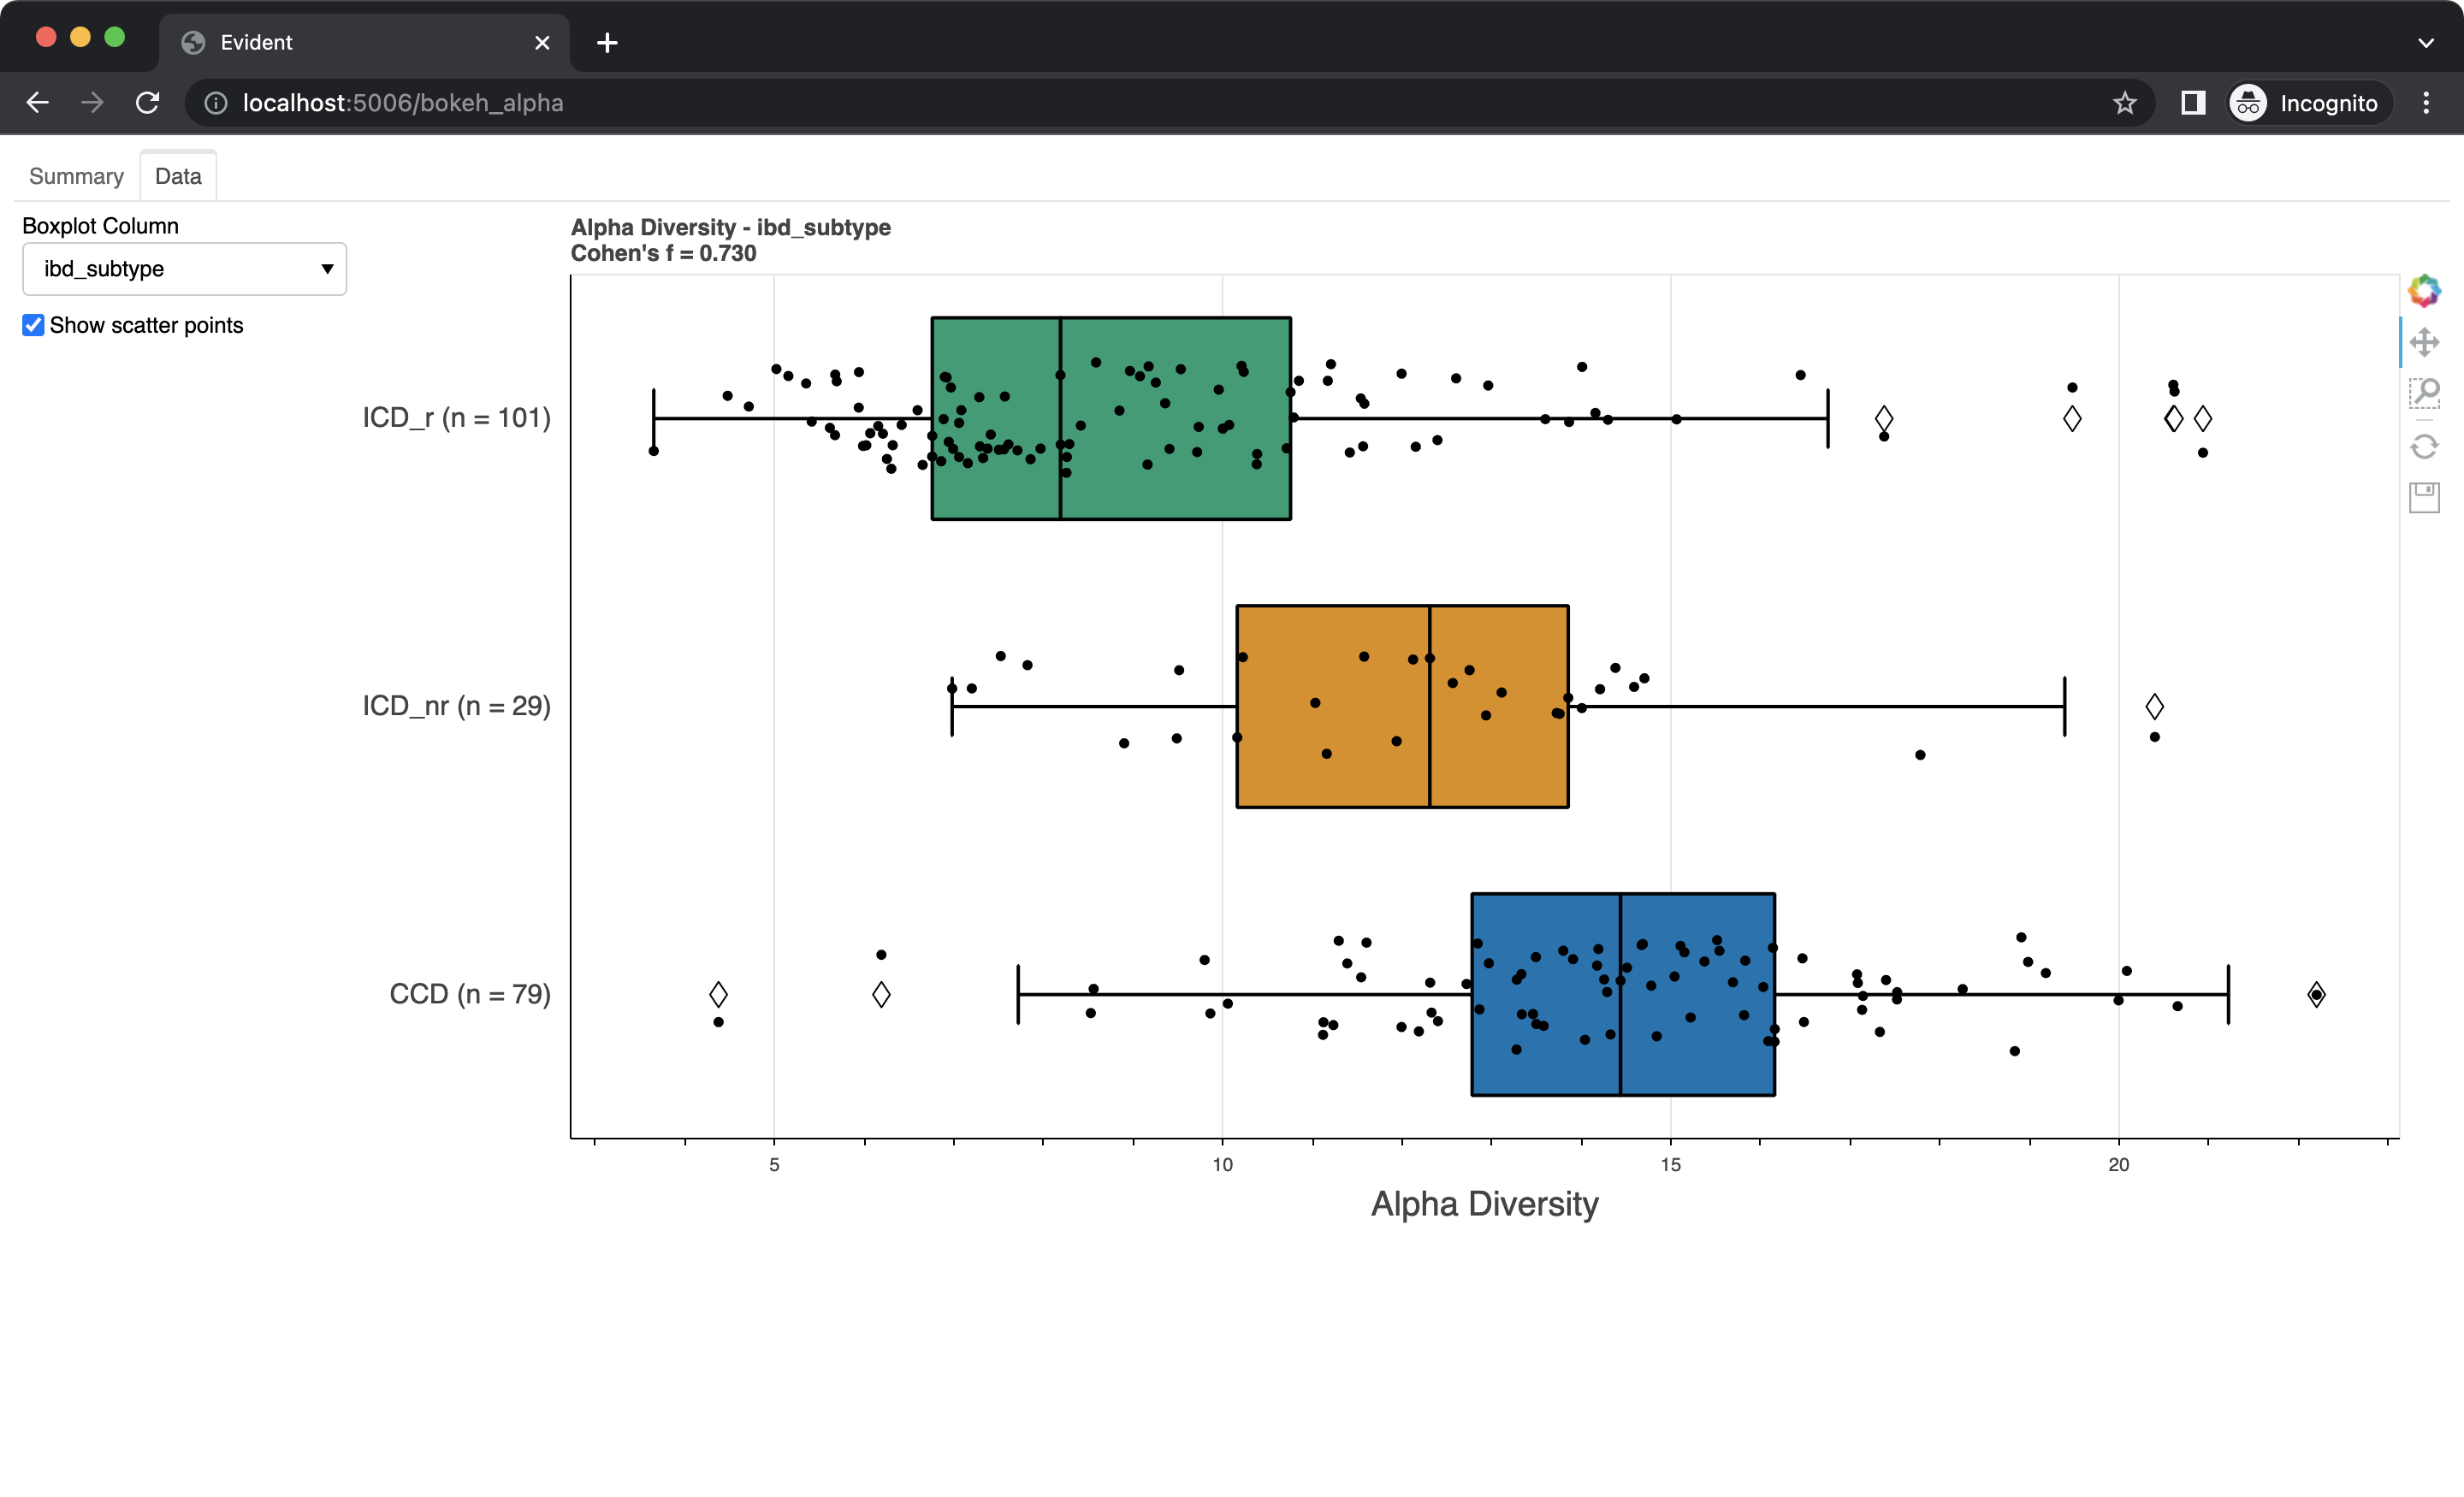
Evident allows users to interactively perform effect size and power calculations using Bokeh. To create a Bokeh app, use the following command:
```python from evident.interactive import createbokehapp
createbokehapp(adh, "app") ```
This will save the necessary files into a new directory app/.
Navigate to the directory containing app/ (not app/ itself) and execute this command from your terminal:
bokeh serve --show app
This should open up a browser window with the interactive visualizations. The "Summary" tab gives an overview of the data and the effect sizes/power. Barplots showing the metadata effect sizes for both binary and multi-class categories (ranked in descending order) are shown. On the right is a dynamic power curve showing the power analysis for metadata columns. The significance level, total observation range, and chosen columns can be modified by using the control panel on the left side of the tab.

Swap to the "Data" tab using the bar on the top. Here you can see boxplots of the data for each metadata category. Select a column from the dropdown to change which data is shown. You can also check the "Show scatter points" box to overlay the raw data onto the boxplots.
Note that because evident uses Python to perform the power calculations, it is at the moment not possible to embed this interactive app into a standalone webpage.
QIIME 2 Usage
Evident provides support for the popular QIIME 2 framework of microbiome data analysis. We assume in this tutorial that you are familiar with using QIIME 2 on the command line. If not, we recommend you read the excellent documentation before you get started with Evident. Note that we have only tested Evident on QIIME 2 version 2021.11. If you are using a different version and encounter an error please let us know via an issue.
To calculate power, we can run the following command:
qiime evident univariate-power-analysis \
    --m-sample-metadata-file metadata.qza \
    --m-sample-metadata-file faith_pd.qza \
    --p-data-column faith_pd \
    --p-group-column classification \
    --p-alpha 0.01 0.05 0.1 \
    --p-total-observations $(seq 10 10 100) \
    --o-power-analysis-results results.qza
We provide multiple sample metadata files to QIIME 2 because they are internally merged.
You should provide a value for --p-data-column so Evident knows which column in the merged metadata contains the numeric values (this is only necessary for univariate analysis).
In this case, the name of the faith_pd.qza vector is faith_pd so we use that as input.
Notice how we used $(seq 10 10 100) to provide input into the --p-total-observations argument.
seq is a command on UNIX-like systems that generates a sequence of numbers.
In our example, we used seq to generate the values from 10 to 100 in intervals of 10 (10, 20, ..., 100).
With this results artifact, we can visualize the power curve to get a sense of how power varies with number of observations and significance level. Run the following command:
qiime evident plot-power-curve \
    --i-power-analysis-results results.qza \
    --p-target-power 0.8 \
    --p-style alpha \
    --o-visualization power_curve.qzv
You can view this visualization at view.qiime2.org directly in your browser.
Parallelization
Evident provides support for parallelizing effect size calculations through joblib.
Parallelization is performed across different columns when using effect_size_by_category and pairwise_effect_size_by_category.
Consider parallelization if you have a lot of samples and/or a lot of different metadata categories of interest.
By default, no parallelization is performed.
With Python:
```python from evident.effectsize import effectsizebycategory
effectsizebycategory( adh, ["classification", "cdresection", "cdbehavior"], njobs=2 ) ```
With QIIME 2:
qiime evident univariate-effect-size-by-category \
    --m-sample-metadata-file metadata.qza \
    --m-sample-metadata-file faith_pd.qza \
    --p-data-column faith_pd \
    --p-group-columns classification sex cd_behavior \
    --p-n-jobs 2 \
    --o-effect-size-results alpha_effect_sizes.qza
Help with Evident
If you encounter a bug in Evident, please post a GitHub issue and we will get to it as soon as we can. We welcome any ideas or documentation updates/fixes so please submit an issue and/or a pull request if you have thoughts on making Evident better.
If your question is regarding the QIIME 2 version of Evident, consider posting to the QIIME 2 forum. You can open an issue on the Community Plugin Support board and tag @gibsramen if required.
Citation
If you use Evident in your work, please cite our preprint on bioRxiv.
Owner
- Name: biocore
- Login: biocore
- Kind: organization
- Location: Cyberspace
- Website: http://biocore.github.io/
- Repositories: 76
- Profile: https://github.com/biocore
Collaboratively developed bioinformatics software.
GitHub Events
Total
- Watch event: 1
Last Year
- Watch event: 1
Committers
Last synced: over 3 years ago
All Time
- Total Commits: 226
- Total Committers: 4
- Avg Commits per committer: 56.5
- Development Distribution Score (DDS): 0.142
Top Committers
| Name | Commits | |
|---|---|---|
| Gibraan Rahman | g****n@e****u | 194 |
| Serene | s****0@g****m | 25 |
| Antonio Gonzalez | a****a@g****m | 5 |
| Gibs | g****n@g****m | 2 |
Committer Domains (Top 20 + Academic)
Issues and Pull Requests
Last synced: about 1 year ago
All Time
- Total issues: 9
- Total pull requests: 22
- Average time to close issues: about 1 month
- Average time to close pull requests: 11 days
- Total issue authors: 6
- Total pull request authors: 3
- Average comments per issue: 2.11
- Average comments per pull request: 1.77
- Merged pull requests: 22
- Bot issues: 0
- Bot pull requests: 0
Past Year
- Issues: 0
- Pull requests: 0
- Average time to close issues: N/A
- Average time to close pull requests: N/A
- Issue authors: 0
- Pull request authors: 0
- Average comments per issue: 0
- Average comments per pull request: 0
- Merged pull requests: 0
- Bot issues: 0
- Bot pull requests: 0
Top Authors
Issue Authors
- gibsramen (2)
- melissaszy (2)
- antgonza (2)
- YilingWang1997 (1)
- ElDeveloper (1)
- sjanssen2 (1)
Pull Request Authors
- gibsramen (15)
- serenejiang (4)
- antgonza (3)
Top Labels
Issue Labels
Pull Request Labels
Packages
- Total packages: 1
-
Total downloads:
- pypi 67 last-month
- Total dependent packages: 0
- Total dependent repositories: 5
- Total versions: 9
- Total maintainers: 1
pypi.org: evident
Effect size calculations for microbiome data.
- Homepage: https://github.com/biocore/evident
- Documentation: https://evident.readthedocs.io/
- License: BSD-3-Clause
-
Latest release: 0.4.0
published about 4 years ago
Rankings
Maintainers (1)
Dependencies
- bokeh *
- click *
- matplotlib *
- numpy *
- pandas >=1.0.0
- scikit-bio >=0.5.6
- seaborn *
- statsmodels *
- actions/checkout v2 composite
- conda-incubator/setup-miniconda v2 composite
- actions/checkout v2 composite
- conda-incubator/setup-miniconda v2 composite