https://github.com/biocore/qurro
Visualize differentially ranked features (taxa, metabolites, ...) and their log-ratios across samples
Science Score: 59.0%
This score indicates how likely this project is to be science-related based on various indicators:
-
○CITATION.cff file
-
✓codemeta.json file
Found codemeta.json file -
✓.zenodo.json file
Found .zenodo.json file -
✓DOI references
Found 5 DOI reference(s) in README -
✓Academic publication links
Links to: ncbi.nlm.nih.gov, wiley.com, nature.com, zenodo.org -
✓Committers with academic emails
2 of 4 committers (50.0%) from academic institutions -
○Institutional organization owner
-
○JOSS paper metadata
-
○Scientific vocabulary similarity
Low similarity (13.2%) to scientific vocabulary
Keywords
Keywords from Contributors
Repository
Visualize differentially ranked features (taxa, metabolites, ...) and their log-ratios across samples
Basic Info
- Host: GitHub
- Owner: biocore
- License: bsd-3-clause
- Language: JavaScript
- Default Branch: master
- Homepage: https://biocore.github.io/qurro
- Size: 80.7 MB
Statistics
- Stars: 34
- Watchers: 5
- Forks: 10
- Open Issues: 124
- Releases: 11
Topics
Metadata Files
README.md
Qurro: Quantitative Rank/Ratio Observations


(Pronounced "churro.")
What does this tool do?
Lots of tools for analyzing " 'omic" datasets can produce feature rankings. These rankings can be used as a guide to look at the log-ratios of certain features in a dataset. Qurro is a tool for visualizing and exploring both of these types of data.
What are feature rankings?
The term "feature rankings" includes differentials, which we define as the estimated log-fold changes for features' abundances across different sample types. You can get this sort of output from lots of "differential abundance" tools, including but definitely not limited to ALDEx2, Songbird, Corncob, DESeq2, edgeR, etc.
The term "feature rankings" also includes feature loadings in a biplot (see Aitchison and Greenacre 2002); you can get biplots from running DEICODE, which is a tool that works well with microbiome datasets, or from a variety of other methods.
Differentials and feature loadings alike can be interpreted as rankings -- you can sort them numerically to "rank" features based on their association with some sort of variation in your dataset.
What can we do with feature rankings?
A common use of these rankings is examining the log-ratios of particularly high- or low-ranked features across the samples in your dataset, and seeing how these log-ratios relate to your sample metadata (e.g. "does this log-ratio differ between 'healthy' and 'sick' samples?"). For details as to why this approach is useful, check out this open access paper.
How does this tool help?
Qurro is an interactive web application for visualizing feature rankings and log-ratios. It does this using a two-plot interface: on the left side of the screen, a "rank plot" shows how features are ranked for a selected ranking, and on the right side of the screen a "sample plot" shows the log-ratios of selected features' abundances within samples. There are a variety of controls available for selecting features for a log-ratio, and changing the selected log-ratio updates both the rank plot (highlighting selected features) and the sample plot (changing the y-axis value of each sample to match the selected log-ratio).
A paper describing Qurro is now available at NAR Genomics and Bioinformatics here.
How do I use this tool?
Qurro can be used standalone (as a Python 3 script that generates a
folder containing a HTML/JS/CSS visualization) or as a
QIIME 2 plugin (that generates a QZV file that can be
visualized at view.qiime2.org or by using
qiime tools view).
Qurro is still being developed, so backwards-incompatible changes might occur. If you have any bug reports, feature requests, questions, or if you just want to yell at me, then feel free to open an issue in this repository!
Demos
See the Qurro website for a list of interactive demos using real datasets.
Screenshot: Visualizing KEGG orthologs in metagenomic data from the Red Sea
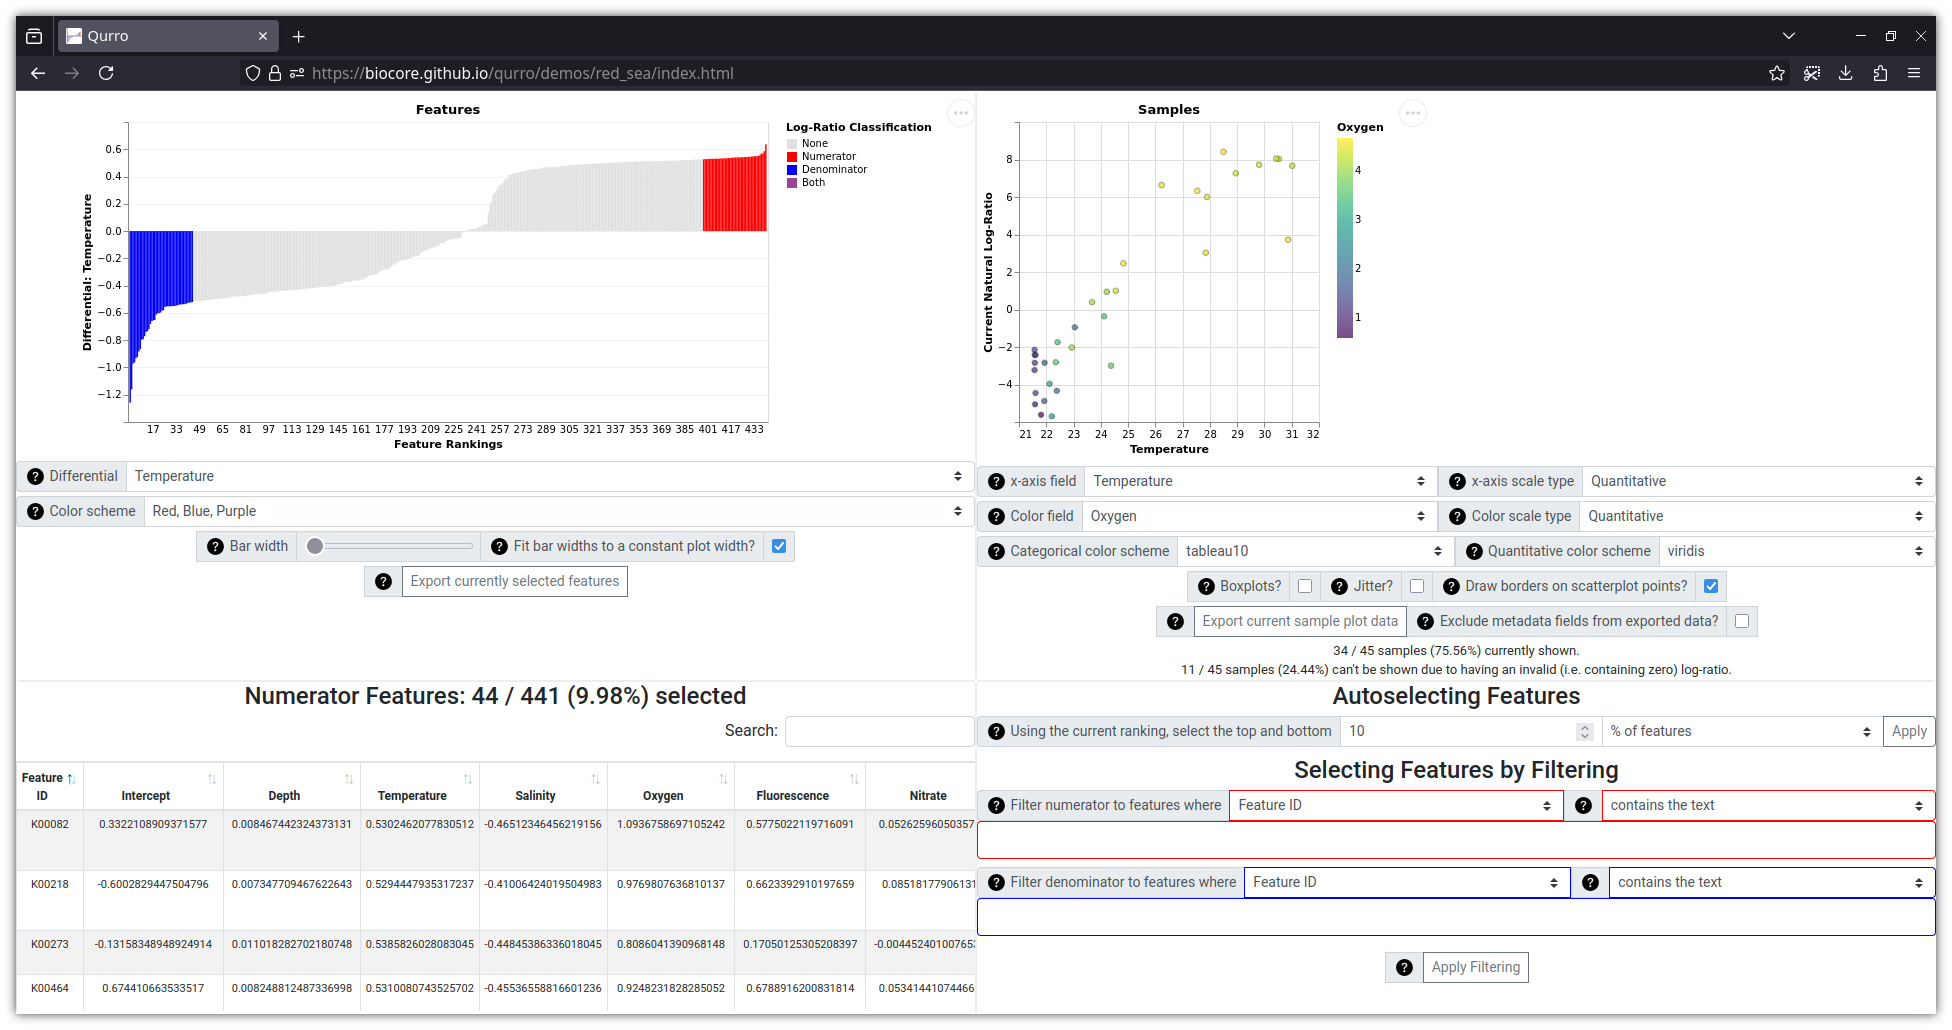
This visualization (which uses data from this study, with differentials generated by Songbird) can be viewed online here.
Installation and Usage
You can install Qurro using pip or conda.
System requirements
If you're using Qurro within QIIME 2, you will need a QIIME 2 version of at least 2020.11. It has been tested with QIIME 2 versions up through the most recent release, as of writing (QIIME 2 2024.10).
If you're using Qurro outside of QIIME 2, you will need a Python version of at least 3.6.
In either case, Qurro should work with most modern web browsers; Firefox or Chrome are recommended.
Installing with pip
bash
pip install cython "numpy >= 1.12.0"
pip install qurro
Installing with conda
bash
conda install -c conda-forge qurro
Slight field name adjustments
Certain characters in column names in the sample metadata, feature metadata (if passed), and feature differentials (if passed) will be replaced with similar characters or just removed entirely:
| Old Character(s) | New Character |
| ------------- | ------------- |
| . | _ |
| : | ; |
| ] | ) |
| [ | ( |
| \ | | |
| ' or " | Nothing |
This is due to some downstream issues with handling these sorts of characters in field names. See this issue for context.
Tutorials
In-depth tutorials
These tutorials are all good places to start, depending on what sort of data and feature rankings you have.
-
- Data Summary: Color composition data from abstract paintings
- Feature rankings: Feature loadings in an arbitrary compositional biplot
- Qurro used through QIIME 2 or standalone?: Standalone
-
- Data Summary: Microbiome 16S rRNA marker gene sequencing data from four types of body site samples
- Feature rankings: Feature loadings in a DEICODE biplot
- Qurro used through QIIME 2 or standalone?: QIIME 2
-
- Data Summary: Gene expression ("RNA-Seq") data from TCGA tumor and "solid tissue normal" samples
- Feature rankings: ALDEx2 differentials
- Qurro used through QIIME 2 or standalone?: Standalone
Selection tutorial
There are a lot of different ways to select features in Qurro, and the interface can be difficult to get used to. This document describes all of these methods, and provides some examples of where they could be useful in practice.
Basic command-line tutorials
These tutorials show examples of using Qurro in identical ways both inside and outside of QIIME 2.
Qarcoal
Qarcoal (pronounced "charcoal") is a new part of Qurro that lets you compute log-ratios based on taxonomic searching directly from the command-line. This can be useful for a variety of reasons.
Currently, Qarcoal is only available through Qurro's QIIME 2 plugin interface.
Please see qarcoal_example.ipynb
for a demonstration of using Qarcoal.
Poster
We presented this poster on Qurro at the 2019 CRISP Annual Review. The data shown here is already slightly outdated compared to the actual Qurro paper (e.g. the differentials are slightly different), but feel free to check out the poster anyway!
Acknowledgements
Dependencies
Code files for the following projects are distributed within
qurro/support_files/vendor/.
See the qurro/dependency_licenses/ directory for copies of these software projects'
licenses (each of which includes a respective copyright notice).
- Vega
- Vega-Lite
- Vega-Embed
- jQuery
- DataTables
- RequireJS
- Bootstrap
- Bootstrap Icons
- We make use of the "Question fill" icon's SVG, as well as some example code
for embedding this or other icons in CSS.
- Popper.js (included within the Bootstrap JS "bundle" file)
The following software projects are required for Qurro's python code to function, although they are not distributed with Qurro (and are instead installed alongside Qurro). - Altair - biom-format - click - NumPy - pandas - scikit-bio
Testing Dependencies
For python testing/style checking, Qurro uses
pytest,
pytest-cov,
flake8, and
black. You'll also need to have QIIME 2
installed to run most of the python tests (note that, due to click vs. black
vs. QIIME 2 dependency issues, you should use a QIIME 2 environment of at least
2022.8; see
CONTRIBUTING.md
for details).
For JavaScript testing/style checking, Qurro uses Mocha, Chai, mocha-headless-chrome, nyc, jshint, and prettier.
Qurro also uses GitHub Actions and Codecov.
The Jupyter notebooks in Qurro's example_notebooks/ folder are automatically
rerun using nbconvert,
also.
Data Sources
The test data located in qurro/tests/input/mackerel/ were exported from
QIIME 2 artifacts in this repository. These data are from Minich et al. 2020 [1].
The test data located in qurro/tests/input/byrd/ are from
this repository.
These data, in turn, originate from Byrd et al.'s 2017 study on atopic
dermatitis [2].
The test data located in qurro/tests/input/sleep_apnea/
(and in example_notebooks/DEICODE_sleep_apnea/input/)
are from this Qiita study,
which is associated with Tripathi et al.'s 2018 study on sleep apnea [4].
The test data located in qurro/tests/input/moving_pictures/ (and in
example_notebooks/moving_pictures/data/)
are from the QIIME 2 moving pictures tutorial.
The ordination files in these folders were computed based on the
DEICODE moving pictures tutorial.
These data (sans the DEICODE ordination) are associated with Caporaso et al. 2011 [5].
Lastly, the data located in qurro/tests/input/red_sea
(and in example_notebooks/songbird_red_sea/input/, and shown in the
screenshot above) were taken from Songbird's GitHub repository in its
data/redsea/
folder, and are associated with Thompson et al. 2017 [3].
Logo
Qurro's logo was created using the Lalezar font. Also, shout out to this gist for showing how to center images in GitHub markdown files (which is more of a hassle than it sounds).
Special Thanks
The design of Qurro was strongly inspired by EMPeror and q2-emperor, along with DEICODE. A big shoutout to Yoshiki Vázquez-Baeza for his help in planning this project, as well as to Cameron Martino for a ton of work on getting the code in a distributable state (and making it work with QIIME 2). Thanks also to Jamie Morton, who wrote the original code for producing rank and sample plots from which this is derived.
And thanks to a bunch of the Knight Lab for helping name the tool :)
Citing Qurro
If you use Qurro in your research, please cite it!
The preferred citation for Qurro is this manuscript at NAR Genomics and
Bioinformatics.
Here's the BibTeX:
@article {fedarko2020,
    author = {Fedarko, Marcus W and Martino, Cameron and Morton, James T and González, Antonio and Rahman, Gibraan and Marotz, Clarisse A and Minich, Jeremiah J and Allen, Eric E and Knight, Rob},
    title = "{Visualizing ’omic feature rankings and log-ratios using Qurro}",
    journal = {NAR Genomics and Bioinformatics},
    volume = {2},
    number = {2},
    year = {2020},
    month = {04},
    issn = {2631-9268},
    doi = {10.1093/nargab/lqaa023},
    url = {https://doi.org/10.1093/nargab/lqaa023},
    note = {lqaa023},
    eprint = {https://academic.oup.com/nargab/article-pdf/2/2/lqaa023/33137933/lqaa023.pdf},
}
References
[1] Minich, J. J., Petrus, S., Michael, J. D., Michael, T. P., Knight, R., & Allen, E. E. (2020). Temporal, environmental, and biological drivers of the mucosal microbiome in a wild marine fish, Scomber japonicus. mSphere, 5(3), e00401-20. Link.
[2] Byrd, A. L., Deming, C., Cassidy, S. K., Harrison, O. J., Ng, W. I., Conlan, S., ... & NISC Comparative Sequencing Program. (2017). Staphylococcus aureus and Staphylococcus epidermidis strain diversity underlying pediatric atopic dermatitis. Science Translational Medicine, 9(397), eaal4651. Link.
[3] Thompson, L. R., Williams, G. J., Haroon, M. F., Shibl, A., Larsen, P., Shorenstein, J., ... & Stingl, U. (2017). Metagenomic covariation along densely sampled environmental gradients in the Red Sea. The ISME Journal, 11(1), 138. Link.
[4] Tripathi, A., Melnik, A. V., Xue, J., Poulsen, O., Meehan, M. J., Humphrey, G., ... & Haddad, G. (2018). Intermittent hypoxia and hypercapnia, a hallmark of obstructive sleep apnea, alters the gut microbiome and metabolome. mSystems, 3(3), e00020-18. Link.
[5] Caporaso, J. G., Lauber, C. L., Costello, E. K., Berg-Lyons, D., Gonzalez, A., Stombaugh, J., ... & Gordon, J. I. (2011). Moving pictures of the human microbiome. Genome Biology, 12(5), R50. Link.
License
This tool is licensed under the BSD 3-clause license. Our particular version of the license is based on scikit-bio's license.
Owner
- Name: biocore
- Login: biocore
- Kind: organization
- Location: Cyberspace
- Website: http://biocore.github.io/
- Repositories: 76
- Profile: https://github.com/biocore
Collaboratively developed bioinformatics software.
GitHub Events
Total
- Create event: 1
- Release event: 1
- Issues event: 11
- Watch event: 3
- Issue comment event: 4
- Push event: 5
- Pull request event: 2
Last Year
- Create event: 1
- Release event: 1
- Issues event: 11
- Watch event: 3
- Issue comment event: 4
- Push event: 5
- Pull request event: 2
Committers
Last synced: 11 months ago
Top Committers
| Name | Commits | |
|---|---|---|
| Marcus Fedarko | m****o@u****u | 1,380 |
| Gibraan Rahman | g****n@e****u | 46 |
| cameronmartino | c****o@g****m | 19 |
| Antonio Gonzalez | a****a@g****m | 5 |
Committer Domains (Top 20 + Academic)
Issues and Pull Requests
Last synced: 10 months ago
All Time
- Total issues: 91
- Total pull requests: 16
- Average time to close issues: 11 months
- Average time to close pull requests: about 2 months
- Total issue authors: 10
- Total pull request authors: 4
- Average comments per issue: 1.47
- Average comments per pull request: 2.38
- Merged pull requests: 16
- Bot issues: 0
- Bot pull requests: 0
Past Year
- Issues: 2
- Pull requests: 1
- Average time to close issues: 12 days
- Average time to close pull requests: 7 days
- Issue authors: 1
- Pull request authors: 1
- Average comments per issue: 0.5
- Average comments per pull request: 1.0
- Merged pull requests: 1
- Bot issues: 0
- Bot pull requests: 0
Top Authors
Issue Authors
- fedarko (73)
- gibsramen (7)
- johannesbjork (2)
- pavlo888 (2)
- mestaki (1)
- mortonjt (1)
- gwarmstrong (1)
- manuss11 (1)
- ivanllampy (1)
- 3TInfoTinker (1)
Pull Request Authors
- fedarko (12)
- gibsramen (3)
- cameronmartino (1)
- antgonza (1)
Top Labels
Issue Labels
Pull Request Labels
Packages
- Total packages: 2
-
Total downloads:
- pypi 99 last-month
- Total docker downloads: 11
-
Total dependent packages: 0
(may contain duplicates) -
Total dependent repositories: 1
(may contain duplicates) - Total versions: 15
- Total maintainers: 1
pypi.org: qurro
Visualizes differentially ranked features and log-ratios of their sample abundances
- Homepage: https://github.com/biocore/qurro
- Documentation: https://qurro.readthedocs.io/
- License: BSD
-
Latest release: 0.9.0
published over 1 year ago
Rankings
Maintainers (1)
conda-forge.org: qurro
Qurro generates interactive visualizations of feature rankings (defined as some sortable measure of feature-wise variation, for example estimated log-fold changes or the feature loadings in a biplot) alongside a plot of selected features' log-ratios across samples in a dataset. The visualization contains various controls to support exploration of log-ratios of features using the feature rankings as a starting point.
- Homepage: https://github.com/biocore/qurro
- License: BSD-3-Clause
-
Latest release: 0.8.0
published over 3 years ago
Rankings
Dependencies
- altair *
- biom-format *
- actions/checkout v4 composite
- actions/setup-node v4 composite
- codecov/codecov-action v2 composite
- conda-incubator/setup-miniconda v3 composite
- actions/checkout v4 composite
- actions/setup-node v4 composite
- conda-incubator/setup-miniconda v3 composite
- actions/checkout v4 composite
- actions/setup-node v4 composite
- actions/setup-python v5 composite