


  rgee: Google Earth Engine for R


rgee is an R binding package for calling Google Earth Engine API from within R. Various functions are implemented to simplify the connection with the R spatial ecosystem.


  Installation
  Hello World
  How does rgee work?
  Guides
  Contributing
  Citation
  Credits


## What is Google Earth Engine?

[Google Earth Engine](https://earthengine.google.com/) is a cloud-based platform that lets users access a petabyte-scale archive of remote sensing data and run geospatial analysis on Google's infrastructure. Currently, Google offers support only for Python and JavaScript. `rgee` fills the gap **by providing support for R!**. Below you will find the comparison between the syntax of `rgee` and the two other Google-supported client libraries.
| JS (Code Editor) |
Python |
R |
|
``` javascript
var db = 'CGIAR/SRTM90_V4'
var image = ee.Image(db)
print(image.bandNames())
#> 'elevation'
```
|
``` python
import ee
ee.Initialize()
db = 'CGIAR/SRTM90_V4'
image = ee.Image(db)
image.bandNames().getInfo()
#> [u'elevation']
```
|
``` r
library(rgee)
ee_Initialize()
db <- 'CGIAR/SRTM90_V4'
image <- ee$Image(db)
image$bandNames()$getInfo()
#> [1] "elevation"
```
|
**Quite similar, isn't it?**. However, additional more minor changes should be considered when using Google Earth Engine with R. Please check the [consideration section](https://r-spatial.github.io/rgee/articles/rgee02.html) before you start coding!
## How to use
**NOTE: Create a [.Renviron file](https://cran.r-project.org/web/packages/startup/vignettes/startup-intro.html) file to prevent setting RETICULATE_PYTHON and EARTHENGINE_GCLOUD every time you authenticate/init your account.**
``` r
library(rgee)
# Set your Python ENV
Sys.setenv("RETICULATE_PYTHON" = "/usr/bin/python3")
# Set Google Cloud SDK. Only need it the first time you log in.
Sys.setenv("EARTHENGINE_GCLOUD" = "home/csaybar/google-cloud-sdk/bin/")
ee_Authenticate()
# Init your Earth Session
ee_Initialize()
```
## Installation
Install from CRAN with:
``` r
install.packages("rgee")
```
Install the development versions from github with
``` r
library(remotes)
install_github("r-spatial/rgee")
```
Additionally, `rgee` depends on [numpy](https://pypi.org/project/numpy/) and [earthengine-api](https://pypi.org/project/earthengine-api/) and requires **[gcloud CLI](https://cloud.google.com/sdk/docs/install#deb)** to authenticate new users. The next example shows how to set rgee up on a new Ubuntu computer (If you are trying to use rgee in a server, see this example in Rstudio cloud -- https://posit.cloud/content/5175749)
``` r
install.packages(c("remotes", "googledrive"))
remotes::install_github("r-spatial/rgee")
library(rgee)
# Get the username
HOME <- Sys.getenv("HOME")
# 1. Install miniconda
reticulate::install_miniconda()
# 2. Install Google Cloud SDK
system("curl -sSL https://sdk.cloud.google.com | bash")
# 3 Set global parameters
Sys.setenv("RETICULATE_PYTHON" = sprintf("%s/.local/share/r-miniconda/bin/python3", HOME))
Sys.setenv("EARTHENGINE_GCLOUD" = sprintf("%s/google-cloud-sdk/bin/", HOME))
# 4 Install rgee Python dependencies
ee_install()
# 5. Authenticate and init your EE session
ee_Initialize()
```
There are three different ways to install rgee Python dependencies:
1. Use [**ee_install**](https://r-spatial.github.io/rgee/reference/ee_install.html) (Highly recommended for users with no experience with Python environments)
``` r
rgee::ee_install()
```
2. Use [**ee_install_set_pyenv**](https://r-spatial.github.io/rgee/reference/ee_install_set_pyenv.html) (Recommended for users with experience with Python environments)
``` r
rgee::ee_install_set_pyenv(
py_path = "/home/csaybar/.virtualenvs/rgee/bin/python", # Change it for your own Python PATH
py_env = "rgee" # Change it for your own Python ENV
)
```
Take into account that the Python PATH you set must have installed earthengine-api and numpy. The use of **miniconda/anaconda is mandatory for Windows users,** Linux and MacOS users could also use virtualenv. See [reticulate](https://rstudio.github.io/reticulate/articles/python_packages.html) documentation for more details.
Another option, only possible for MacOS and Linux, is just set the Python PATH:
``` r
rgee::ee_install_set_pyenv(
py_path = "/usr/bin/python3",
py_env = NULL
)
```
However, [**rgee::ee_install_upgrade**](https://r-spatial.github.io/rgee/reference/ee_install_upgrade.html) and [**reticulate::py_install**](https://rstudio.github.io/reticulate/reference/py_install.html) will not work until you set a Python ENV.
3. Use the Python PATH setting support that offer [Rstudio v.1.4 \>](https://blog.rstudio.com/2020/10/07/rstudio-v1-4-preview-python-support/). See this [tutorial](https://github.com/r-spatial/rgee/tree/help/rstudio/).
After install `Python dependencies`, you might want to use the function below for checking the rgee status.
``` r
ee_check() # Check non-R dependencies
```
## Sync rgee with other Python packages
Integrate [rgee](https://r-spatial.github.io/rgee/) with [geemap](https://geemap.org/).
``` r
library(reticulate)
library(rgee)
# 1. Initialize the Python Environment
ee_Initialize()
# 2. Install geemap in the same Python ENV that use rgee
py_install("geemap")
gm <- import("geemap")
```
Upgrade the [earthengine-api](https://pypi.org/project/earthengine-api/)
``` r
library(rgee)
ee_Initialize()
ee_install_upgrade()
```
## Package Conventions
- All `rgee` functions have the prefix ee\_. Auto-completion is your friend :).
- Full access to the Earth Engine API with the prefix [**ee\$...**](https://developers.google.com/earth-engine/).
- Authenticate and Initialize the Earth Engine R API with [**ee_Initialize**](https://r-spatial.github.io/rgee/reference/ee_Initialize.html). It is necessary once per session!.
- `rgee` is "pipe-friendly"; we re-export %\>% but do not require its use.
## Hello World
### 1. Compute the trend of night-time lights ([JS version](https://github.com/google/earthengine-api/))
Authenticate and Initialize the Earth Engine R API.
``` r
library(rgee)
ee_Initialize()
```
Adds a band containing image date as years since 1991.
``` r
createTimeBand <-function(img) {
year <- ee$Date(img$get('system:time_start'))$get('year')$subtract(1991L)
ee$Image(year)$byte()$addBands(img)
}
```
Map the time band creation helper over the [night-time lights collection](https://developers.google.com/earth-engine/datasets/catalog/NOAA_DMSP-OLS_NIGHTTIME_LIGHTS/).
``` r
collection <- ee$
ImageCollection('NOAA/DMSP-OLS/NIGHTTIME_LIGHTS')$
select('stable_lights')$
map(createTimeBand)
```
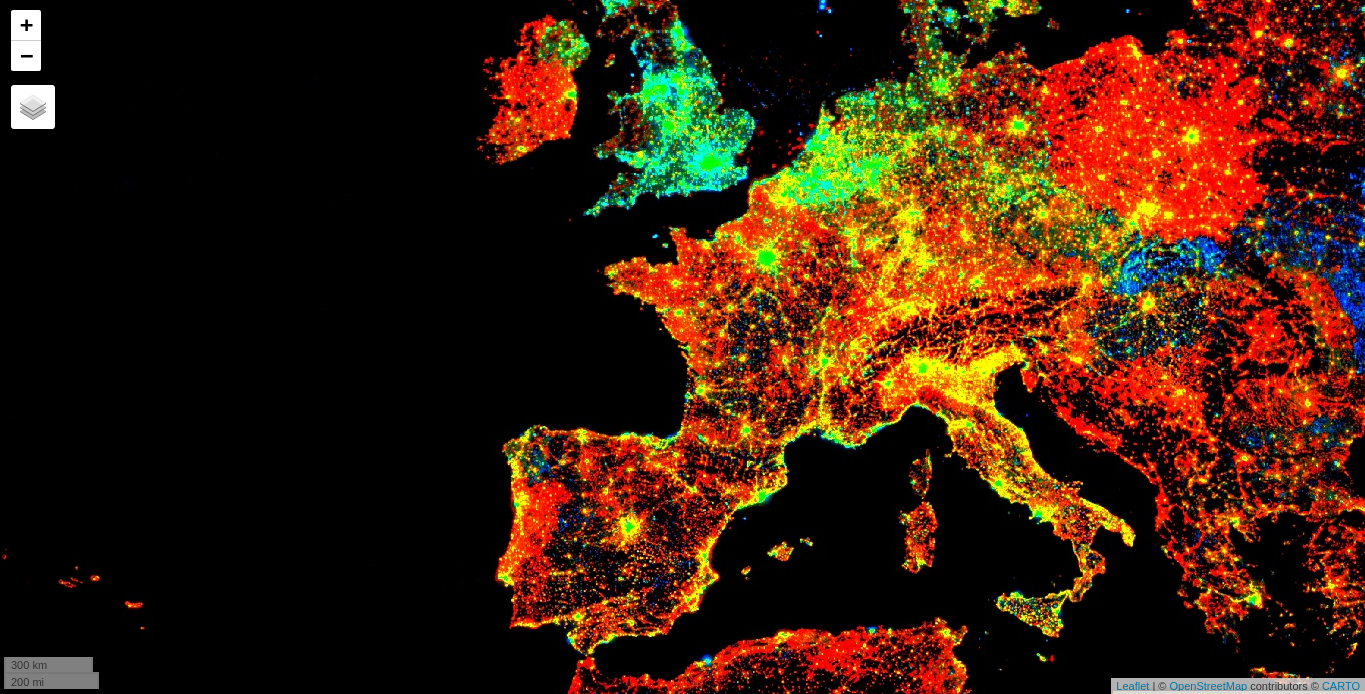
Compute a linear fit over the series of values at each pixel, visualizing the y-intercept in green, and positive/negative slopes as red/blue.
``` r
col_reduce <- collection$reduce(ee$Reducer$linearFit())
col_reduce <- col_reduce$addBands(
col_reduce$select('scale'))
ee_print(col_reduce)
```
Create an interactive visualization!
``` r
Map$setCenter(9.08203, 47.39835, 3)
Map$addLayer(
eeObject = col_reduce,
visParams = list(
bands = c("scale", "offset", "scale"),
min = 0,
max = c(0.18, 20, -0.18)
),
name = "stable lights trend"
)
```
### 2. Extract precipitation values
Install and load `tidyverse` and `sf` R packages, and initialize the Earth Engine R API.
``` r
library(tidyverse)
library(rgee)
library(sf)
ee_Initialize()
```
Read the `nc` shapefile.
``` r
nc <- st_read(system.file("shape/nc.shp", package = "sf"), quiet = TRUE)
```
Map each image from 2001 to extract the monthly precipitation (Pr) from the [Terraclimate dataset](https://developers.google.com/earth-engine/datasets/catalog/IDAHO_EPSCOR_TERRACLIMATE/)
``` r
terraclimate <- ee$ImageCollection("IDAHO_EPSCOR/TERRACLIMATE") %>%
ee$ImageCollection$filterDate("2001-01-01", "2002-01-01") %>%
ee$ImageCollection$map(function(x) x$select("pr")) %>% # Select only precipitation bands
ee$ImageCollection$toBands() %>% # from imagecollection to image
ee$Image$rename(sprintf("PP_%02d",1:12)) # rename the bands of an image
```
Extract monthly precipitation values from the Terraclimate ImageCollection through `ee_extract`. `ee_extract` works similar to `raster::extract`, you just need to define: the ImageCollection object (x), the geometry (y), and a function to summarize the values (fun).
``` r
ee_nc_rain <- ee_extract(x = terraclimate, y = nc["NAME"], sf = FALSE)
```
Use ggplot2 to generate a beautiful static plot!
``` r
ee_nc_rain %>%
pivot_longer(-NAME, names_to = "month", values_to = "pr") %>%
mutate(month, month=gsub("PP_", "", month)) %>%
ggplot(aes(x = month, y = pr, group = NAME, color = pr)) +
geom_line(alpha = 0.4) +
xlab("Month") +
ylab("Precipitation (mm)") +
theme_minimal()
```

### 3. Create an NDVI-animation ([JS version](https://developers.google.com/earth-engine/tutorials/community/modis-ndvi-time-series-animation/))
Install and load `sf`, after that, initialize the Earth Engine R API.
``` r
library(magick)
library(rgee)
library(sf)
ee_Initialize()
```
Define the regional bounds of animation frames and a mask to clip the NDVI data by.
``` r
mask <- system.file("shp/arequipa.shp", package = "rgee") %>%
st_read(quiet = TRUE) %>%
sf_as_ee()
region <- mask$geometry()$bounds()
```
Retrieve the MODIS Terra Vegetation Indices 16-Day Global 1km dataset as an `ee.ImageCollection` and select the NDVI band.
``` r
col <- ee$ImageCollection('MODIS/006/MOD13A2')$select('NDVI')
```
Group images by composite date
``` r
col <- col$map(function(img) {
doy <- ee$Date(img$get('system:time_start'))$getRelative('day', 'year')
img$set('doy', doy)
})
distinctDOY <- col$filterDate('2013-01-01', '2014-01-01')
```
Define a filter that identifies which images from the complete collection match the DOY from the distinct DOY collection.
``` r
filter <- ee$Filter$equals(leftField = 'doy', rightField = 'doy')
```
Define a join; convert the resulting FeatureCollection to an ImageCollection.
``` r
join <- ee$Join$saveAll('doy_matches')
joinCol <- ee$ImageCollection(join$apply(distinctDOY, col, filter))
```
Apply median reduction among matching DOY collections.
``` r
comp <- joinCol$map(function(img) {
doyCol = ee$ImageCollection$fromImages(
img$get('doy_matches')
)
doyCol$reduce(ee$Reducer$median())
})
```
Define RGB visualization parameters.
``` r
visParams = list(
min = 0.0,
max = 9000.0,
bands = "NDVI_median",
palette = c(
'FFFFFF', 'CE7E45', 'DF923D', 'F1B555', 'FCD163', '99B718', '74A901',
'66A000', '529400', '3E8601', '207401', '056201', '004C00', '023B01',
'012E01', '011D01', '011301'
)
)
```
Create RGB visualization images for use as animation frames.
``` r
rgbVis <- comp$map(function(img) {
do.call(img$visualize, visParams) %>%
ee$Image$clip(mask)
})
```
Define GIF visualization parameters.
``` r
gifParams <- list(
region = region,
dimensions = 600,
crs = 'EPSG:3857',
framesPerSecond = 10
)
```
Get month names
``` r
dates_modis_mabbr <- distinctDOY %>%
ee_get_date_ic %>% # Get Image Collection dates
'[['("time_start") %>% # Select time_start column
lubridate::month() %>% # Get the month component of the datetime
'['(month.abb, .) # subset around month abbreviations
```
Use ee_utils_gif\_\* functions to render the GIF animation and add some texts.
``` r
animation <- ee_utils_gif_creator(rgbVis, gifParams, mode = "wb")
animation %>%
ee_utils_gif_annotate(
text = "NDVI: MODIS/006/MOD13A2",
size = 15, color = "white",
location = "+10+10"
) %>%
ee_utils_gif_annotate(
text = dates_modis_mabbr,
size = 30,
location = "+290+350",
color = "white",
font = "arial",
boxcolor = "#000000"
) # -> animation_wtxt
# ee_utils_gif_save(animation_wtxt, path = "raster_as_ee.gif")
```

## How does rgee work?
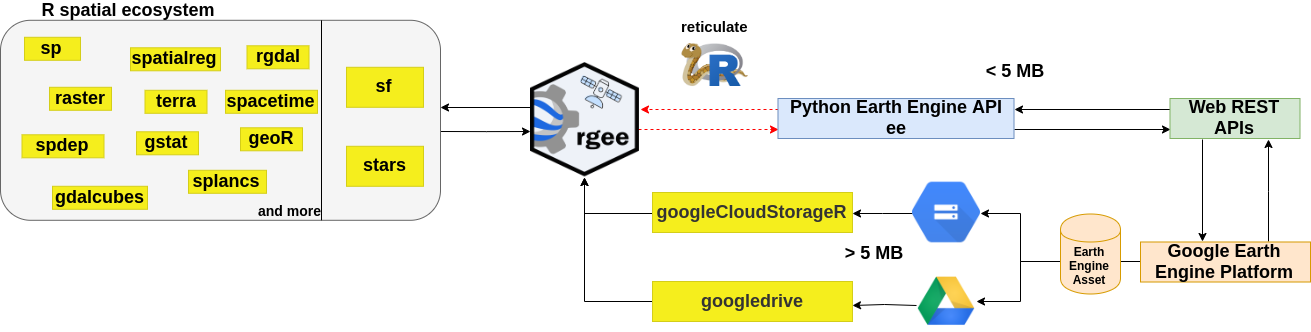
`rgee` is **not** a native Earth Engine API like the Javascript or Python client. Developing an Earth Engine API from scratch would create too much maintenance burden, especially considering that the API is in [active development](https://github.com/google/earthengine-api). So, how is it possible to run Earth Engine using R? the answer is [reticulate](https://rstudio.github.io/reticulate/). `reticulate` is an R package designed to allow seamless interoperability between R and Python. When an Earth Engine **request** is created in R, `reticulate` will translate this request into Python and pass it to the `Earth Engine Python API`, which converts the request to a `JSON` format. Finally, the request is received by the GEE Platform through a Web REST API. The **response** will follow the same path in reverse.
## Code of Conduct
Please note that the `rgee` project is released with a [Contributor Code of Conduct](CODE_OF_CONDUCT.md). By contributing to this project, you agree to abide by its terms.
## Contributing Guide
Thanks for taking the time to contribute! Please review our [Contributing Guide](CONTRIBUTING.md).
## Share the love
Think **rgee** is useful? Let others discover it, by telling them in person via Twitter or a blog post.
Using **rgee** for a paper you are writing? Consider citing it
``` r
citation("rgee")
To cite rgee in publications use:
C Aybar, Q Wu, L Bautista, R Yali and A Barja (2020) rgee: An R
package for interacting with Google Earth Engine Journal of Open
Source Software URL https://github.com/r-spatial/rgee/.
A BibTeX entry for LaTeX users is
@Article{,
title = {rgee: An R package for interacting with Google Earth Engine},
author = {Cesar Aybar and Quisheng Wu and Lesly Bautista and Roy Yali and Antony Barja},
journal = {Journal of Open Source Software},
year = {2020},
}
```
## Credits
We want to offer a **special thanks** :raised_hands: :clap: to [**Justin Braaten**](https://github.com/jdbcode) for his wise and helpful comments in the whole development of **rgee**. As well, we would like to mention the following third-party R/Python packages for contributing indirectly to the improvement of rgee:
- [**gee_asset_manager - Lukasz Tracewski**](https://github.com/tracek/gee_asset_manager/)
- [**geeup - Samapriya Roy**](https://github.com/samapriya/geeup/)
- [**geeadd - Samapriya Roy**](https://github.com/samapriya/gee_asset_manager_addon/)
- [**cartoee - Kel Markert**](https://github.com/KMarkert/cartoee/)
- [**geetools - Rodrigo E. Principe**](https://github.com/gee-community/gee_tools/)
- [**landsat-extract-gee - Loc Dutrieux**](https://github.com/loicdtx/landsat-extract-gee/)
- [**earthEngineGrabR - JesJehle**](https://github.com/JesJehle/earthEngineGrabR/)
- [**sf - Edzer Pebesma**](https://github.com/r-spatial/sf/)
- [**stars - Edzer Pebesma**](https://github.com/r-spatial/stars/)
- [**gdalcubes - Marius Appel**](https://github.com/appelmar/gdalcubes/)