lick
Package that uses a Line Integral Convolution library to clothe a 2D field (ex: density field) with a LIC texture, given two vector fields (ex: velocity (vx, vy))
Science Score: 36.0%
This score indicates how likely this project is to be science-related based on various indicators:
-
○CITATION.cff file
-
✓codemeta.json file
Found codemeta.json file -
✓.zenodo.json file
Found .zenodo.json file -
○DOI references
-
○Academic publication links
-
✓Committers with academic emails
1 of 4 committers (25.0%) from academic institutions -
○Institutional organization owner
-
○JOSS paper metadata
-
○Scientific vocabulary similarity
Low similarity (10.1%) to scientific vocabulary
Keywords from Contributors
Repository
Package that uses a Line Integral Convolution library to clothe a 2D field (ex: density field) with a LIC texture, given two vector fields (ex: velocity (vx, vy))
Basic Info
- Host: GitHub
- Owner: la-niche
- License: gpl-3.0
- Language: Python
- Default Branch: main
- Size: 9.69 MB
Statistics
- Stars: 4
- Watchers: 2
- Forks: 2
- Open Issues: 1
- Releases: 13
Metadata Files
README.md
lick


Line Integral Convolution Knit : clothe a 2D field (ex: density field) with a LIC texture, given two vector fields (ex: velocity (vx, vy)).
This package builds on top of rLIC, adding post-processing and visualization functionalities.
Authors: Gaylor Wafflard-Fernandez, Clment Robert
Author-email: gaylor.wafflard@univ-grenoble-alpes.fr
Installation
Install with pip
pip install lick
To import lick:
python
import lick as lk
The important functions are lick_box and lick_box_plot. While lick_box interpolates the data and perform a line integral convolution, lick_box_plot directly plots the final image. Use lick_box if you want to have more control of the plots you want to do with the lic. Use lick_box_plot if you want to take advantage of the fine-tuning of the pcolormesh parameters.
Example
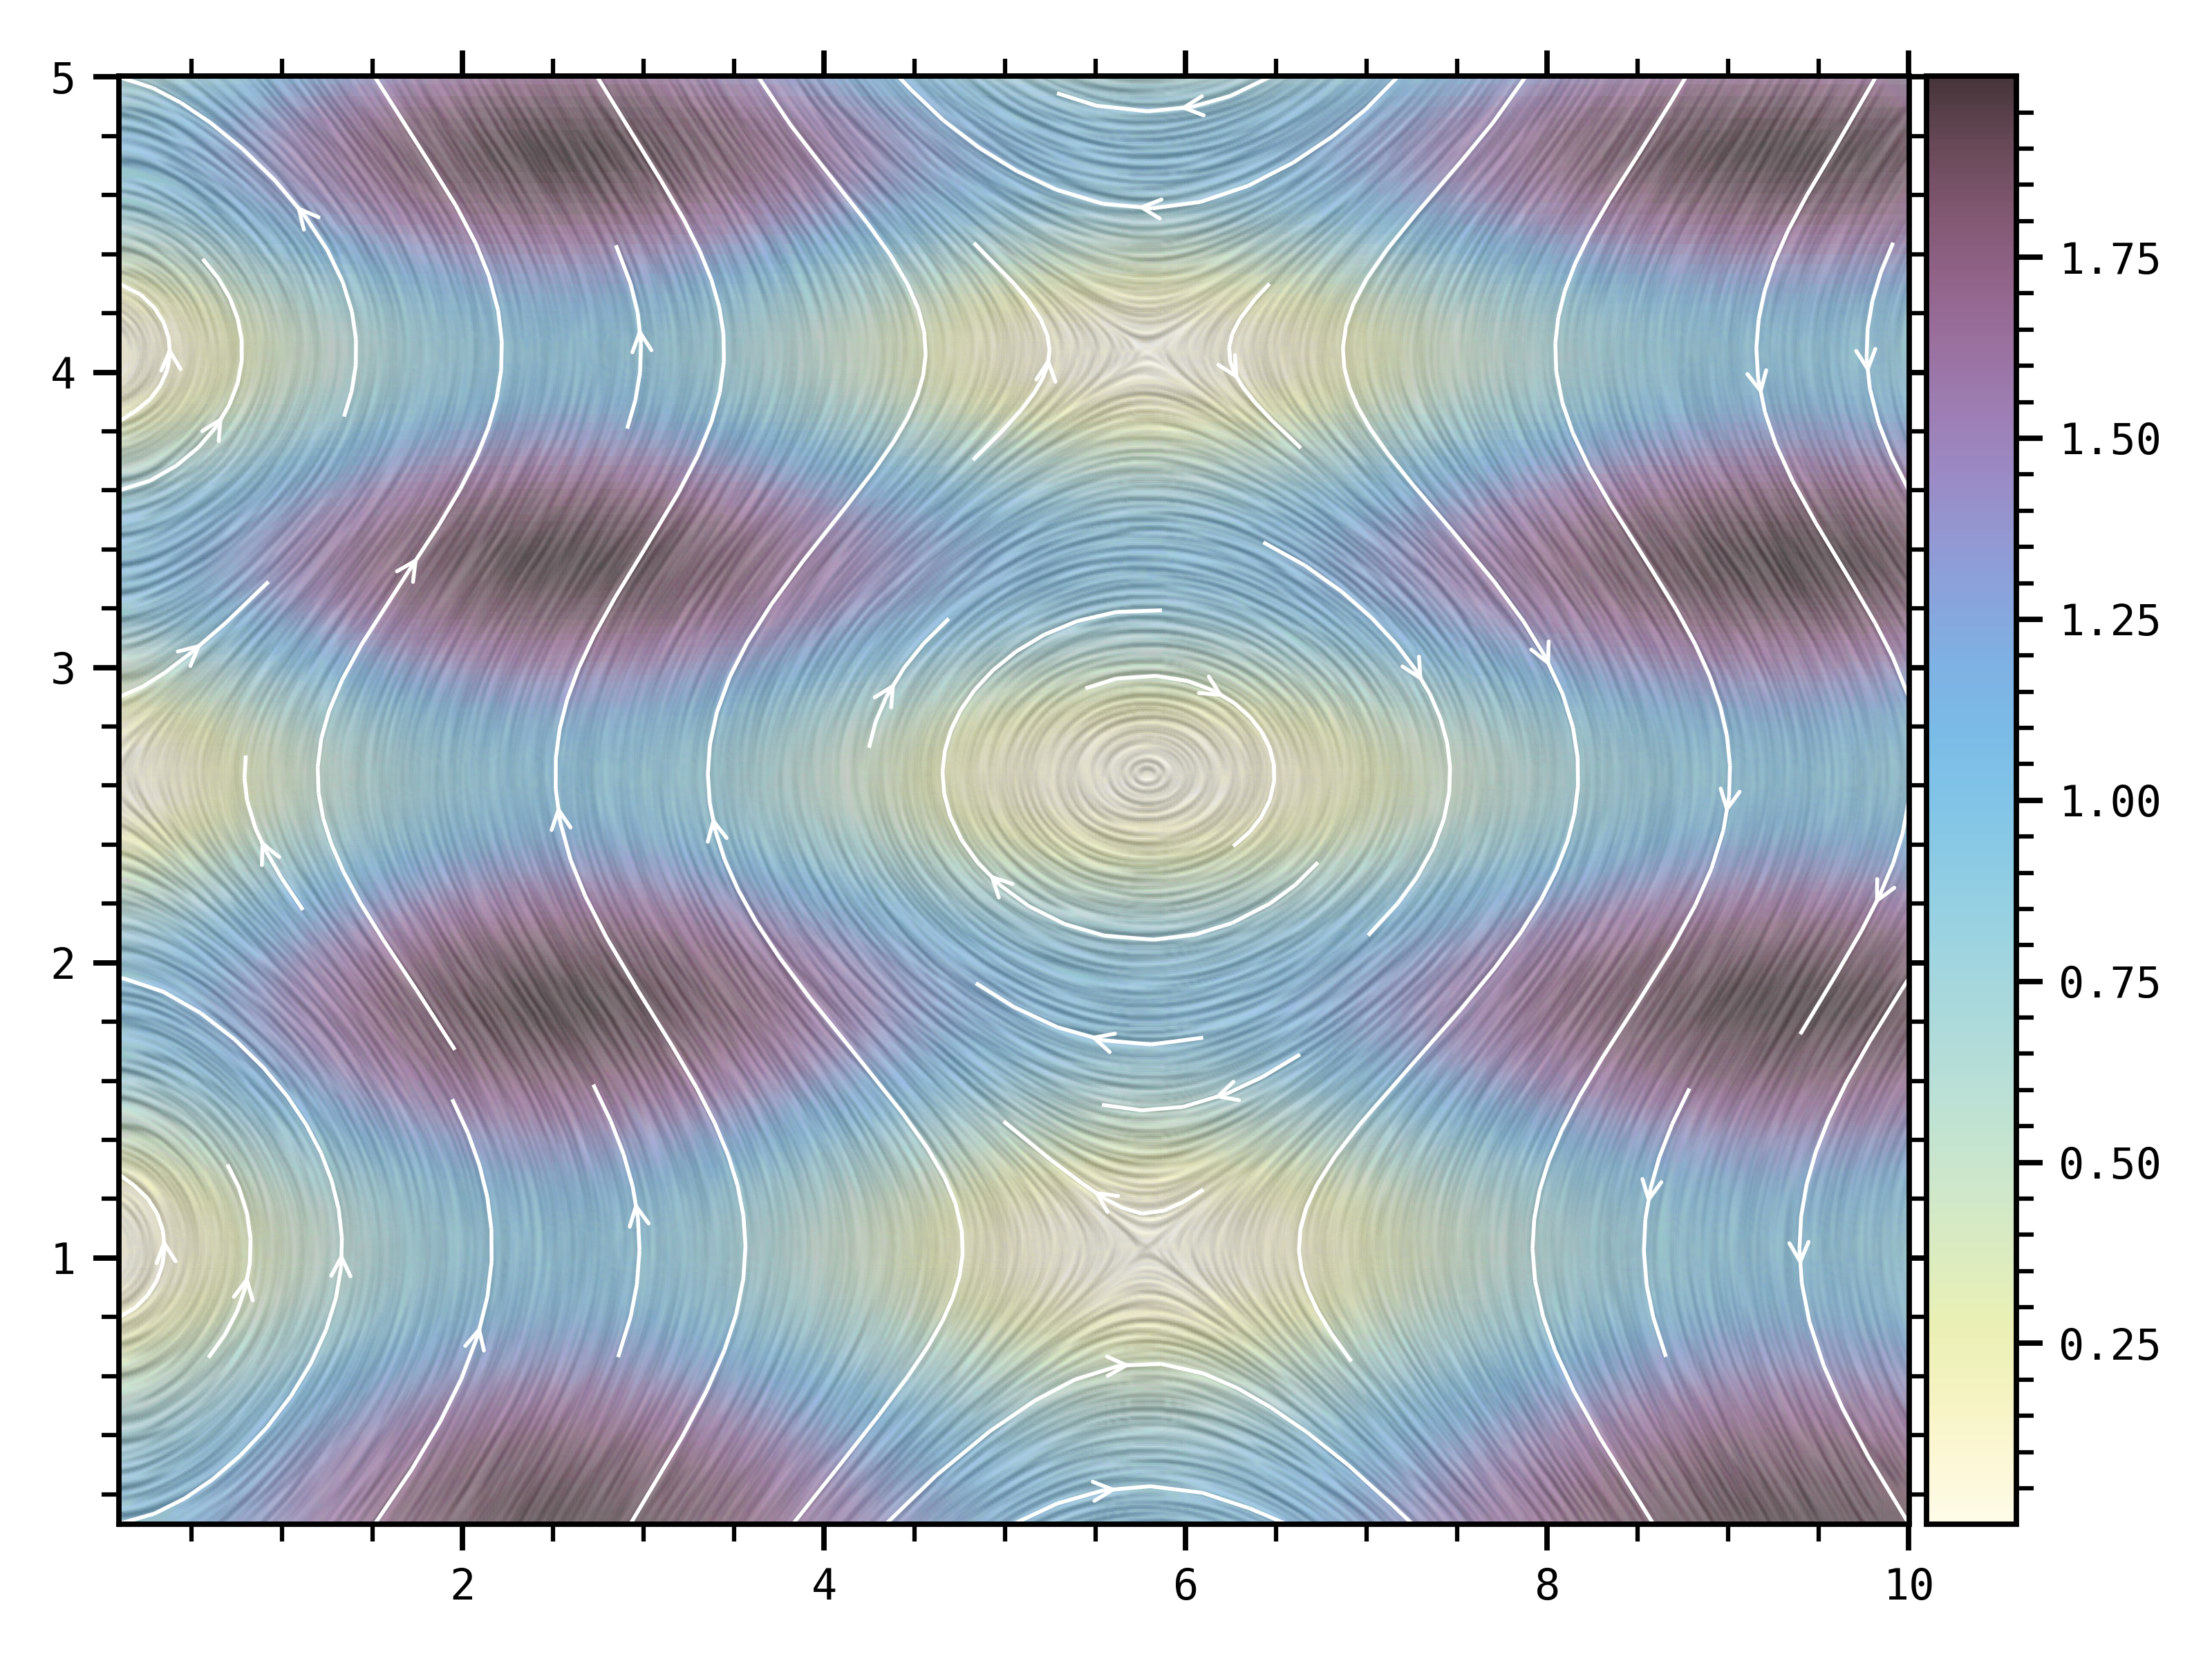
```python import numpy as np import matplotlib.pyplot as plt from lick import lickboxplot
fig, ax = plt.subplots() x = np.geomspace(0.1, 10, 128) y = np.geomspace(0.1, 5, 128) a, b = np.meshgrid(x, y) v1 = np.cos(a) v2 = np.sin(b) field = v1 ** 2 + v2 ** 2 lickboxplot( fig, ax, x, y, v1, v2, field, sizeinterpolated=256, xmin=1, xmax=9, ymin=1, ymax=4, niterlic=5, kernellength=64, cmap="inferno", streamdensity=0.5 ) plt.show() ```
Owner
- Name: la niche
- Login: la-niche
- Kind: organization
- Repositories: 1
- Profile: https://github.com/la-niche
GitHub Events
Total
- Issues event: 1
- Watch event: 1
- Delete event: 4
- Issue comment event: 1
- Push event: 9
- Pull request event: 20
- Fork event: 1
- Create event: 4
Last Year
- Issues event: 1
- Watch event: 1
- Delete event: 4
- Issue comment event: 1
- Push event: 9
- Pull request event: 20
- Fork event: 1
- Create event: 4
Committers
Last synced: about 1 year ago
Top Committers
| Name | Commits | |
|---|---|---|
| Clément Robert | c****2@p****m | 114 |
| dependabot[bot] | 4****] | 52 |
| Volodia99 | g****d@u****r | 27 |
| pre-commit-ci[bot] | 6****] | 8 |
Committer Domains (Top 20 + Academic)
Dependencies
- actions/checkout v3 composite
- actions/download-artifact v3 composite
- actions/upload-artifact v3 composite
- pypa/cibuildwheel v2.11.2 composite
- pypa/gh-action-pypi-publish v1.5.1 composite
- actions/checkout v3 composite
- actions/setup-python v4 composite
- actions/upload-artifact v2 composite
- actions/checkout v4 composite
- actions/setup-python v4 composite
- matplotlib >=3.4.0
- numpy >=1.19.3,<2.0
- packaging >=20.9
- scikit-image >=0.18.1
- scipy >=1.5.4
- pytest >=6.1 test
- pytest-mpl >=0.16.1 test
- mypy ==1.5.1