Recent Releases of markdownreports
markdownreports - MarkdownReports 4.8.0 - periodic update
Bug Fixes, Consistency, Documentation
Full Changelog: https://github.com/vertesy/MarkdownReports/compare/v4.5.9...v4.8.0
- HTML
Published by vertesy over 1 year ago

markdownreports - v4.5.9
Maintenance update: some new features, few bug fixes.
Full Changelog: https://github.com/vertesy/MarkdownReports/compare/v4.5.3...v4.5.9
- HTML
Published by vertesy over 2 years ago
markdownreports - MarkdownReports v4.5.3
Various bug fixes and compatibility with other @vertesy packages.
- HTML
Published by vertesy over 4 years ago
markdownreports - MarkdownReports 4.3.2
- The Development repo "MarkdownReportsDev" is now discontinued.
Further development will be implemented here, in MarkdownReports. MarkdownReportsDev was made when big changes were happening. The development reached its main goals.
- Changes
The last release was more than a year ago.
- Many bugifxes and
- Many new Auxiliary Functions (some will be later part of StringParser).
Individual code changes can be tracked in MarkdownReportsDev.
Full Changelog: https://github.com/vertesy/MarkdownReports/compare/v4.1.0...v4.3.2
- HTML
Published by vertesy over 4 years ago
markdownreports - MarkdownReports v4.1.0 with consistent function, option, and variable names
Version 4.1.0 is a major consistency update
- See legacy/old version at: https://github.com/vertesy/MarkdownReports.v2.9.5
- See development version at: https://github.com/vertesy/MarkdownReportsDev
New features:
- Formatted session info Sessioninfo
- Updated dependencies
- Many functions are more stable and versatile
In case you find a bug, please report. Try the development version or a legacy version. Old versions are under MarkdownReports.LEGACY.VERSION.X.X.X.
What is MarkdownReports?
MarkdownReports is a set of R functions that allows you to generate precise figures easily, and create clean reports in markdown language about what you just discovered with your analysis script. It helps you to:
- Create scientifically accurate figures and save them automatically as vector graphic (.pdf), that you can use from presentation to posters anywhere.
- Note down your findings easily in a clear and nicely formatted way, parsed from your variables into english sentences.
- Link & display your figures automatically inside your report, right there where they are needed.
- Version your findings, annotating which parameters were used to reach certain results.
- Share your report with others via email, Github or a personal website.
- HTML
Published by vertesy about 6 years ago
markdownreports - An R function library to create scientific figures and markdown reports easily. Update v2.9.5
Major update of MarkdownReports
Major (mostly) backward compatible changes, fixes and updates
- See All updated function definitions in the wiki:
- F.A.Q.-&-Trouble-shooting:
- Browse the wiki for other resources.
Among others, new / updated functions:
- Default report sharing is now .pdf, that can be exported from markdown, thus .png link insertion is FALSE by default.
- Can directly compress tabular (.tsv) files as written out.
- Image links to the markdown file are handled globally, and in many functions automatically, given the context (i.e. always = F when plotting multiple plots into a .pdf by
pdfA4plot_on). - Quickly add legends by the
wlegendfunction using color schemes generated by the newwcolorizefunction. - Terminology:
- the
any_printfunction is renamed toiprintfor better auto-completion. - internal functions are consistently named as:
md.functionality - background variables are consistently named as:
b.variable_name
- the
- Table of contents mark can be added for using with Typora.
- HTML
Published by vertesy over 8 years ago
markdownreports - Refined Raccoon
Major update of MarkdownReports
Major (mostly) backward compatible changes, fixes and updates
- See All updated function definitions in the wiki:
- F.A.Q.-&-Trouble-shooting:
- Browse the wiki for other resources.
Among others, new / updated functions:
- substrRight
- setup_MarkdownReports
- md.LogSettingsFromList
- logsettingsMarkDown
- llwrite_list
- wlegend
- wLinRegression
- wscatter.fill
- HTML
Published by vertesy over 8 years ago
markdownreports - An R function library to create scientific figures and reports easily. Update v2.5.0
What is _MarkdownReports_?
MarkdownReports is a set of R functions that allows you to generate precise figures easily, and create clean reports about what you just discovered with your analysis script. It helps you to: 1. Create scientifically accurate figures and save them automatically as vector graphic (.pdf), that you can use from presentation to posters anywhere. 2. Note down your findings easily in a clear and nicely formatted way, parsed from your variables into english sentences. 3. Link & display your figures automatically inside your report, right there where they are needed. 4. Version your findings, annotating which parameters were used to reach certain results. 5. Share your report with others via email, Github or a personal website.
Why did I make it & why you might like it too?
I do exploratory data analysis as a daily routine, and I have constant interaction with all sorts of people: supervisors, collaborators, colleagues, etc.
I often have to... 1. ...write emails summarizing the results (text & figures) of the last few days. 2. ...find results from a couple of month back, with all tiny details (parameters used, etc). 3. ...assemble each step I did that day into a logical story line, that others can understand at first glimpse, e.g.: I observed X; I controlled for Y; Hypothesized explanation A; Falsified it; Came up with explanation B; Tested & proven it...
For all of the above, my solution is MarkdownReports. I think its better than other solutions I found. Many of those like to combine source code with results, and many are too complex to use. Most of people I interact with are not interested in the source code, but are very keen on seeing my results from all possible angles and are asking detailed questions about the analysis.
Where does _MarkdownReports_ stand out?
- Pure markdown output, simple and elegant layout.
- Handy integration of text with figures (linked to an external file & displayed: makes manual tailoring easy)
- Easy generation of precise figures (axis labels, etc) that are saved as a vector graphic (pdf), making it scalable for presentations, posters, etc
- The report file is automatically named after the R-script, so that it is linked to the source code that generated it.
- A timestamped subdirectory is created that you can backup once satisfied with your results.
- The generated report is easy to share on a GitHub wiki.
- It natively exports tables from R to Markdown
- It is all achieved in ~ 400 lines of well commented code.
Installation
Install directly from GitHub via devtools with one R command:
devtools::install_github(repo = "vertesy/MarkdownReports/MarkdownReports")
...then simply load the package:
require("MarkdownReports")
Alternatively, you simply source it from the web. This way function help will not work, and you will have no local copy of the code on your hard drive.
source("https://raw.githubusercontent.com/vertesy/MarkdownReports/master/MarkdownReports/R/MarkdownReports.R")
Discover 4 Yourself!
- See it working: Check out a dummy R script and the MarkDown report it generates inside this GitHub Repo.
- Check out the wiki
- Browse the code of the functions.
Learn about the markdown format
- See the power and simplicity of markdown format explained on Github
- Checkout some cool markdown editors, like MOU, or markdownpad.
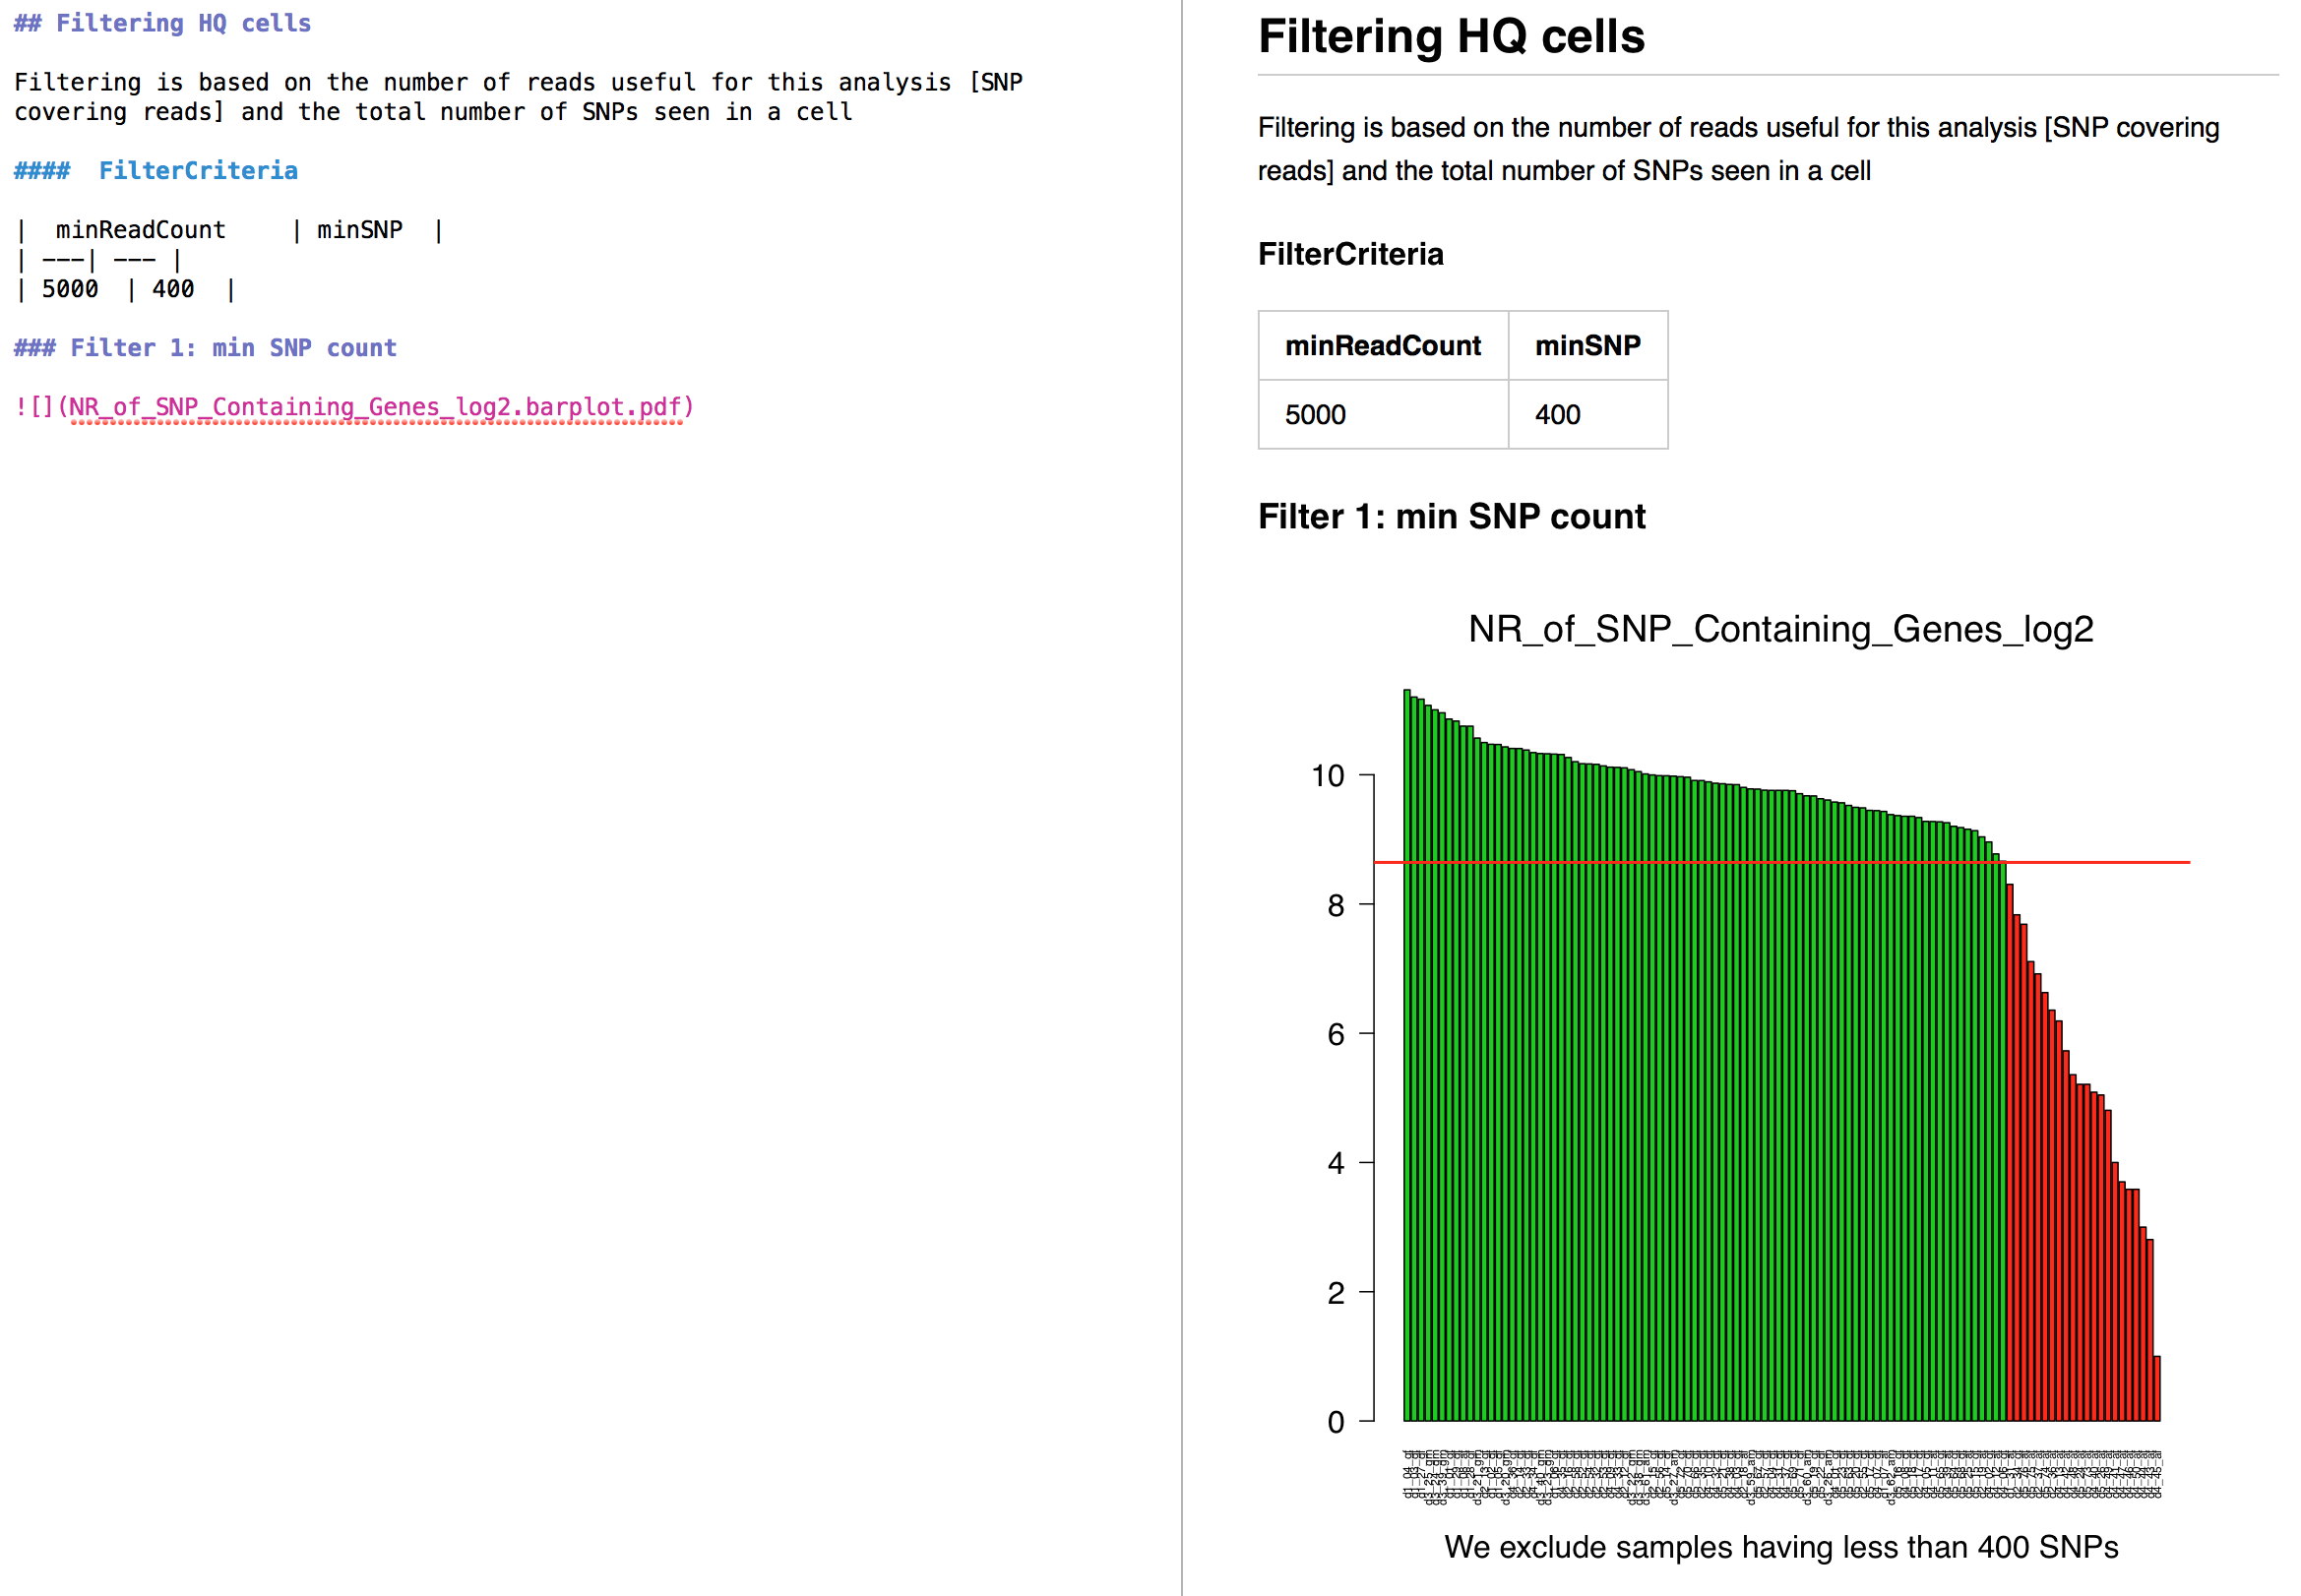
- See how these markdown reports are rendered:
Cite it via its Digital Object Identifier (DOI):

MarkdownReports is a project of @vertesy.
- HTML
Published by vertesy about 10 years ago
markdownreports - MarkdownReports cleaned, fixed, annotated & packaged!
What is _MarkdownReports_?
MarkdownReports is a set of R functions that allows you to generate precise figures easily, and create clean reports about what you just discovered with your analysis script. It helps you to: 1. Create scientifically accurate figures and save them automatically as vector graphic (.pdf), that you can use from presentation to posters anywhere. 2. Note down your findings easily in a clear and nicely formatted way, parsed from your variables into english sentences. 3. Link & display your figures automatically inside your report, right there where they are needed. 4. Version your findings, annotating which parameters were used to reach certain results. 5. Share your report with others via email, Github or a personal website.
Why did I make it & why might you like it?
I do exploratory data analysis as a daily routine, and I have constant interaction with all sorts of people: supervisors, collaborators, colleagues, etc.
I often have to... 1. ...write emails summarizing the results (text & figures) of the last few days. 2. ...find back results a couple of month back, with all tiny details (parameters used, etc). 3. ...assemble each step I did that day into a logical story line, that others can understand at first glimpse, e.g.: I observed X; I controlled for Y; Hypothesized explanation A; Falsified it; Came up with explanation B; Tested & proven it...
For all of the above, my solution is MarkdownReports. I think its better than other solutions I found. Many of those like to combine source code with results, and many are too complex to use. Most of people I interact with are not interested in the source code, but are very keen on seeing my results from all possible angles and are asking detailed questions about the analysis.
Where does _MarkdownReports_ stand out?
- Pure markdown output, simple and elegant layout.
- Handy integration of text with figures (linked to an external file & displayed: makes manual tailoring easy)
- Easy generation of precise figures (axis labels, etc) that are saved as a vector graphic (pdf), making it scalable for presentations, posters, etc
- The report file is automatically named after the R-script, so that it is linked to the source code that generated it.
- A timestamped subdirectory is created that you can backup once satisfied with your results.
- The generated report is easy to share on a GitHub wiki.
- It natively exports tables from R to Markdown
- It is all achieved in ~ 400 lines of well commented code.
Installation
Install directly from GitHub via devtools with one R command:
devtools::install_github(repo = "vertesy/MarkdownReports/MarkdownReports")
...then simply load the package:
require("MarkdownReports")
Alternatively, you simply source it from the web. This way function help will not work, and you will have no local copy of the code on your hard drive.
source("https://raw.githubusercontent.com/vertesy/MarkdownReports/master/MarkdownReports/R/MarkdownReports.R")
Discover 4 Yourself!
- See it working: Check out a dummy R script and the MarkDown report it generates inside this GitHub Repo.
- Check out the wiki and the list of functions in the package.
- Browse the code of the functions.
Learn about the markdown format
- See the power and simplicity of markdown format explained on Github
- Checkout some cool markdown editors, like MOU, or markdownpad.
MarkdownReports is a project of @vertesy.
- HTML
Published by vertesy over 10 years ago
markdownreports - MarkdownReports cleaned, packaged, fixed & annotated!
What is _MarkdownReports_?
MarkdownReports is a set of R functions that allows you to generate precise figures easily, and create clean reports about what you just discovered with your analysis script. It helps you to: 1. Create scientifically accurate figures and save them automatically as vector graphic (.pdf), that you can use from presentation to posters anywhere. 2. Note down your findings easily in a clear and nicely formatted way, parsed from your variables into english sentences. 3. Link & display your figures automatically inside your report, right there where they are needed. 4. Version your findings, annotating which parameters were used to reach certain results. 5. Share your report with others via email, Github or a personal website.
Why did I make it & why might you like it?
I do exploratory data analysis as a daily routine, and I have constant interaction with all sorts of people: supervisors, collaborators, colleagues, etc.
I often have to... 1. ...write emails summarizing the results (text & figures) of the last few days. 2. ...find back results a couple of month back, with all tiny details (parameters used, etc). 3. ...assemble each step I did that day into a logical story line, that others can understand at first glimpse, e.g.: I observed X; I controlled for Y; Hypothesized explanation A; Falsified it; Came up with explanation B; Tested & proven it...
For all of the above, my solution is MarkdownReports. I think its better than other solutions I found. Many of those like to combine source code with results, and many are too complex to use. Most of people I interact with are not interested in the source code, but are very keen on seeing my results from all possible angles and are asking detailed questions about the analysis.
Where does _MarkdownReports_ stand out?
- Pure markdown output, simple and elegant layout.
- Handy integration of text with figures (linked to an external file & displayed: makes manual tailoring easy)
- Easy generation of precise figures (axis labels, etc) that are saved as a vector graphic (pdf), making it scalable for presentations, posters, etc
- The report file is automatically named after the R-script, so that it is linked to the source code that generated it.
- A timestamped subdirectory is created that you can backup once satisfied with your results.
- The generated report is easy to share on a GitHub wiki.
- It natively exports tables from R to Markdown
- It is all achieved in ~ 400 lines of well commented code.
Installation
Install directly from GitHub via devtools with one R command:
devtools::install_github(repo = "vertesy/MarkdownReports/MarkdownReports")
...then simply load the package:
require("MarkdownReports")
Alternatively, you simply source it from the web. This way function help will not work, and you will have no local copy of the code on your hard drive.
source("https://raw.githubusercontent.com/vertesy/MarkdownReports/master/MarkdownReports/R/MarkdownReports.R")
Discover 4 Yourself!
- See it working: Check out a dummy R script and the MarkDown report it generates inside this GitHub Repo.
- Check out the wiki and the list of functions in the package.
- Browse the code of the functions.
Learn about the markdown format
- See the power and simplicity of markdown format explained on Github
- Checkout some cool markdown editors, like MOU, or markdownpad.
MarkdownReports is a project of @vertesy.
- HTML
Published by vertesy over 10 years ago
markdownreports - An R function library to generate (scientific) reports easily
What is _MarkDownLogs_?
MarkDownLogs is a set of R functions that allows you to generate neat reports / summaries what you discovered with your script. It helps you to: 1. Write down your findings easily in a clear and nicely formatted way. 2. Support your findings with quick & pretty figures saved along your report 3. Link and show these in your markdown or html document, at the right spot. 4. Share your findings with others via email, github or a personal website.
Why did I make it & why might you like it?
I do exploratory data analysis as a daily routine and I have constant interaction with all sorts of people: supervisors, collaborators, colleagues, etc.
I often have to... 1. ... write emails summarizing the results (text accompanied by figures) of the last few days. 2. ...find back results a couple of month back, with all tiny details (parameters used, etc) 3. ...assemble each step I did that day into a logical story line, that others can follow right as they see it, e.g.: I observed X; I controlled for Y; Hypothesized explanation A; Falsified it; Came up with explanation B; Tested & proven it...
For all of the above, my solution is MarkDownLogs. I think its better than other solutions I found. Many of those like to combine source code with results, and many are too complex to use. Most of people I interact with are not interested in code, but are very keen on seeing my results from all possible angles and are asking detailed questions about the analysis.
Where does _MarkDownLogs_ stand out?
- Pure markdown output, simple and elegant layout.
- Handy integration of text with figures (linked to an external file & displayed: makes manual tailoring easy)
- Easy generation of precise figures (axis labels, etc) that are saved as a vector graphic (pdf), making it scalable for presentations, posters, etc
- The report file can easily be named after the source file with date & time: it is linked to the source code, but avoids overwriting.
- It does not spam your report with code, but it shares the name, so you can look it up fast if needed.
- It is usable on GitHub Wiki's (you need to create .png versions of .pdf - a current limitation of GitHub)
- It natively exports tables from R to Markdown
- It is all achieved in ~ 200 lines of well commented code.
Discover 4 Yourself!
- See it working: Check out a dummy R script and the MarkDown report it generates inside this GitHub Repo.
- Check the function documentation in the wiki
- Visit the project's webpage
Learn about the markdown format
- See the power and simplicity of markdown format explained on Github
- Checkout some cool markdown editors, like MOU, or markdownpad.
- HTML
Published by vertesy over 10 years ago