missforest
Arguably the best missing values imputation method.
Science Score: 67.0%
This score indicates how likely this project is to be science-related based on various indicators:
-
✓CITATION.cff file
Found CITATION.cff file -
✓codemeta.json file
Found codemeta.json file -
✓.zenodo.json file
Found .zenodo.json file -
✓DOI references
Found 3 DOI reference(s) in README -
✓Academic publication links
Links to: zenodo.org -
○Committers with academic emails
-
○Institutional organization owner
-
○JOSS paper metadata
-
○Scientific vocabulary similarity
Low similarity (11.6%) to scientific vocabulary
Repository
Arguably the best missing values imputation method.
Basic Info
- Host: GitHub
- Owner: yuenshingyan
- License: mit
- Language: Python
- Default Branch: main
- Size: 787 KB
Statistics
- Stars: 69
- Watchers: 2
- Forks: 9
- Open Issues: 0
- Releases: 1
Metadata Files
README.md
MissForest
![]()


![]()

This project is a Python implementation of the MissForest algorithm, a powerful tool designed to handle missing values in tabular datasets. The primary goal of this project is to provide users with a more accurate method of imputing missing data.
While MissForest may take more time to process datasets compared to simpler imputation methods, it typically yields more accurate results.
Please note that the efficiency of MissForest is a trade-off for its accuracy. It is designed for those who prioritize data accuracy over processing speed. This makes it an excellent choice for projects where the quality of data is paramount.
How MissForest Handles Categorical Variables ?
Categorical variables in argument categoricals will be label encoded for
estimators to work properly.
Example
To install MissForest using pip.
console
pip install MissForest
Imputing a dataset:
```python import pandas as pd import numpy as np from sklearn.modelselection import traintest_split from missforest import MissForest
Load toy dataset.
df = pd.read_csv("insurance.csv")
Label encoding.
df["sex"] = df["sex"].map({"male": 0, "female": 1}) df["region"] = df["region"].map({ "southwest": 0, "southeast": 1, "northwest": 2, "northeast": 3}) df["smoker"] = df["smoker"].map({"yes": 0, "no": 1})
Create missing values.
for c in df.columns: n = int(len(df) * 0.1) randidx = np.random.choice(df.index, n) df.loc[randidx, c] = np.nan
Split dataset into train and test sets.
train, test = traintestsplit(df, testsize=.3, shuffle=True, randomstate=42)
categorical=["sex", "smoker", "region", "children"]
Default estimators are lgbm classifier and regressor
mf = MissForest(categorical=categorical) mf.fit(x=train) trainimputed = mf.transform(x=train) testimputed = mf.transform(x=test) ```
Or using the fit_transform method
python
mf = MissForest(categorical=categorical)
train_imputed = mf.fit_transform(X=train)
test_imputed = mf.transform(X=test)
print(test_imputed)
Imputing with other estimators
```python from missforest import MissForest import pandas as pd import numpy as np from sklearn.ensemble import RandomForestRegressor, RandomForestClassifier
df = pd.read_csv("insurance.csv")
for c in df.columns: randomindex = np.random.choice(df.index, size=100) df.loc[randomindex, c] = np.nan
mf = MissForest( clf=RandomForestClassifier(njobs=-1), rgr=RandomForestRegressor(njobs=-1), categorical=categorical, ) dfimputed = mf.fittransform(df) ```
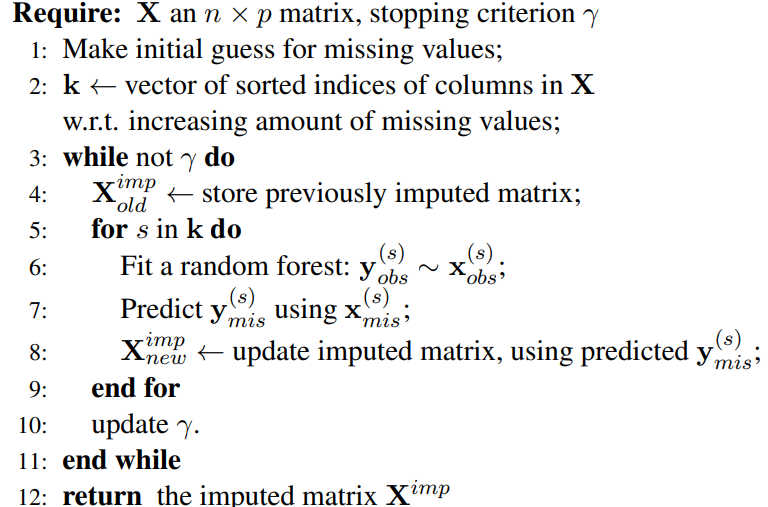
Pseudo Code
Figures
Here are some figures and tables from Stekhoven and Buhlmann (2012)
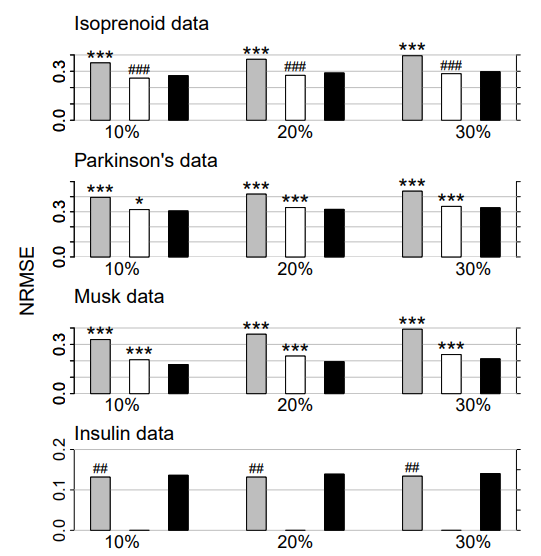
Figure 1: Continuous data. Average NRMSE for KNNimpute (grey), MissPALasso (white) and missForest (black) on four different data sets and three different amounts of missing values, i.e., 10%, 20% and 30%. Standard errors are in the order of magnitude of 10−4 . Significance levels for the paired Wilcoxon tests in favour of missForest are encoded as “*” <0.05, “**” <0.01 and “***” <0.001. If the average error of the compared method is smaller than that of missForest the significance level is encoded by a hash (#) instead of an asterisk. In the lowermost data set results for MissPALasso are missing due to the methods limited capability with regard to high dimensions.
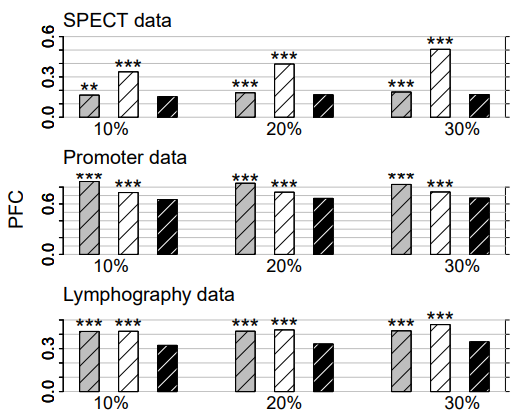
Figure 2: Categorical data. Average PFC for cross-validated KNNimpute (grey), MICE (white) and missForest (black) on three different data sets and three different amounts of missing values, i.e., 10%, 20% and 30%. Standard errors are in the order of magnitude of 10−4 . Significance levels for the paired Wilcoxon tests in favour of missForest are encoded as “*” <0.05, “**” <0.01 and “****” <0.001.
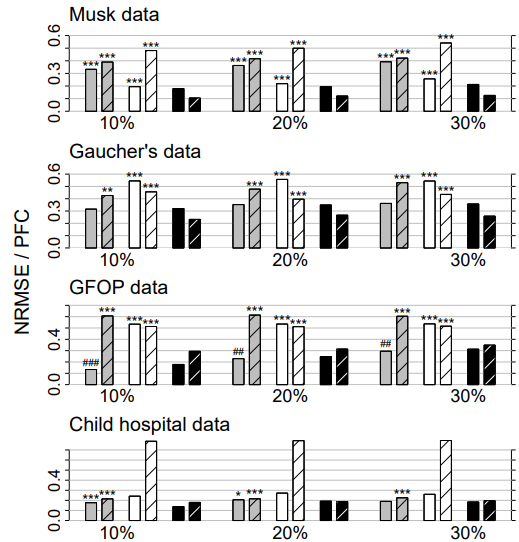
Figure 3: Mixed-type data. Average NRMSE (left bar) and PFC (right bar, shaded) for KNNimput1 (grey), MICE (white) and missForest (black) on four different data sets and three different amounts of missing values, i.e., 10%, 20% and 30%. Standard errors are in the order of magnitude of 10−3 . Significance levels for the paired Wilcoxon tests in favour of missForest are encoded as “*” <0.05, “**” <0.01 and “***” <0.001. If the average error of the compared method is smaller than that of missForest the significance level is encoded by a hash (#) instead of an asterisk. Note that, due to ill-distribution and near dependence in the Child hospital data, the results for MICE have to be treated with caution (see Section 4.3).
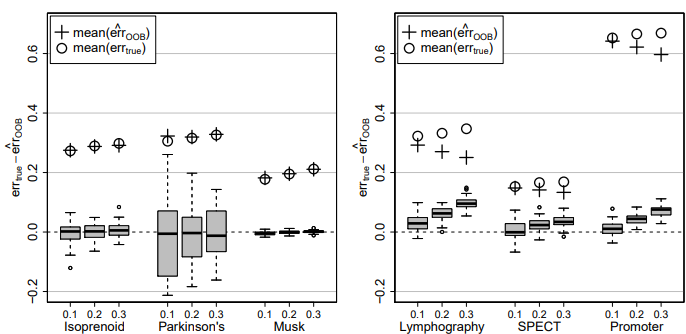
Figure 4: Difference of true imputation error errtrue and OOB imputation error estimate err cOOB for the continuous data sets (left) and the categorical data sets (right) and three different amounts of missing values, i.e., 0.1, 0.2 and 0.3. In each case the average errtrue (circle) and the average err cOOB (plus) over all simulations is given.
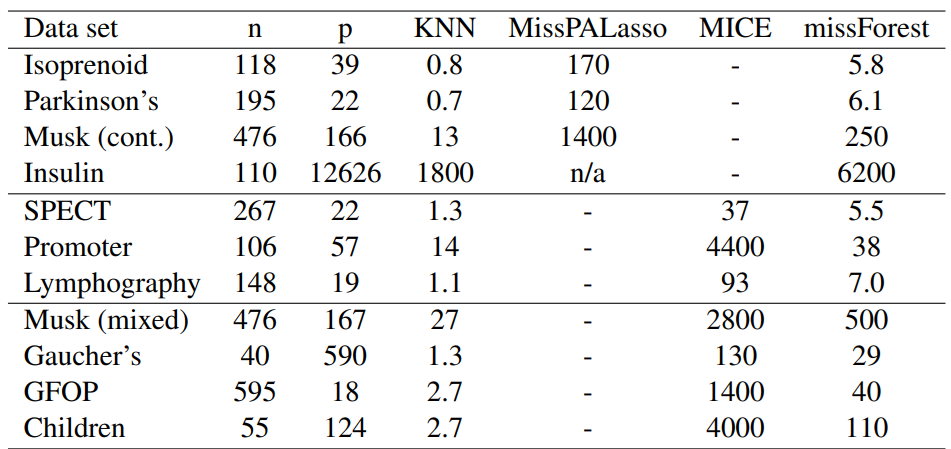
Table 1: Average runtimes [s] for imputing the analyzed data sets. Runtimes are averaged over the amount of missing values since this has a negligible effect on computing time.
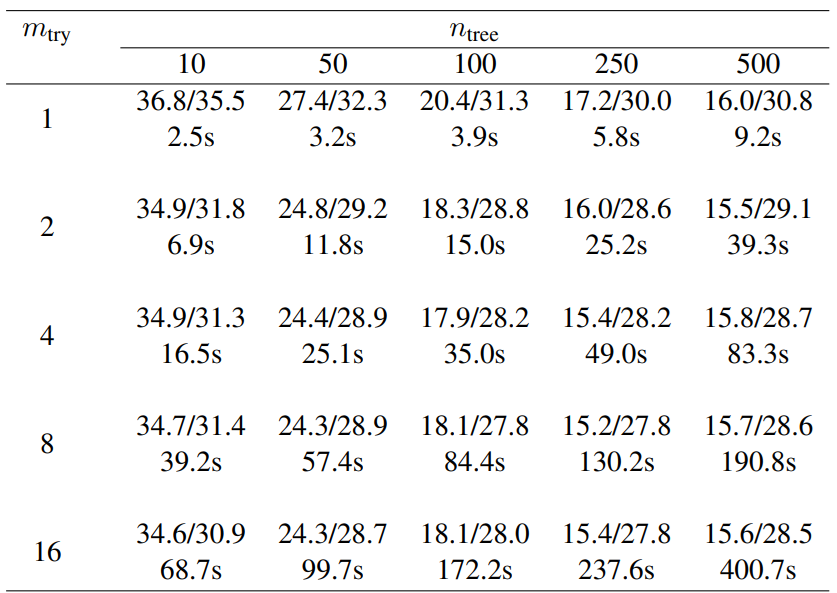
Table 2: Average imputation error (NRMSE/PFC in percent) and runtime (in seconds) with different numbers of trees (ntree) grown in each forest and variables tried (mtry) at each node of the trees. Here, we consider the GFOP data set with artificially introduced 10% of missing values. For each comparison 50 simulation runs were performed using always the same missing value matrix for all numbers of trees/randomly selected variables for a single simulation.
Owner
- Name: Hindy
- Login: yuenshingyan
- Kind: user
- Location: Hong Kong
- Company: CT Risk Analytics
- Repositories: 1
- Profile: https://github.com/yuenshingyan
Quant | Machine Learning Engineer | Data Scientist| Master Degree in Physics
Citation (CITATION.cff)
cff-version: 1.0.0
message: "If you use this software, please cite it as below."
authors:
  - family-names: Yuen
    given-names: Shing Yan Hindy
title: "yuenshingyan/MissForest: MissForest in Python - Arguably the best missing values imputation method"
version: "v1.0.0"
identifiers:
  - type: doi
    value: 10.5281/zenodo.13368883
date-released: 2024-08-24
GitHub Events
Total
- Issues event: 6
- Watch event: 20
- Delete event: 16
- Issue comment event: 6
- Push event: 81
- Pull request event: 48
- Fork event: 5
- Create event: 4
Last Year
- Issues event: 6
- Watch event: 20
- Delete event: 16
- Issue comment event: 6
- Push event: 81
- Pull request event: 48
- Fork event: 5
- Create event: 4
Packages
- Total packages: 1
-
Total downloads:
- pypi 3,218 last-month
- Total dependent packages: 0
- Total dependent repositories: 2
- Total versions: 25
- Total maintainers: 1
pypi.org: missforest
Best imputation method.
- Homepage: https://github.com/yuenshingyan/MissForest
- Documentation: https://missforest.readthedocs.io/
- License: MIT License
-
Latest release: 4.2.3
published over 1 year ago