molplotly
add-on to plotly which show molecule images on mouseover!
Science Score: 54.0%
This score indicates how likely this project is to be science-related based on various indicators:
-
✓CITATION.cff file
Found CITATION.cff file -
✓codemeta.json file
Found codemeta.json file -
✓.zenodo.json file
Found .zenodo.json file -
○DOI references
-
○Academic publication links
-
✓Committers with academic emails
2 of 4 committers (50.0%) from academic institutions -
○Institutional organization owner
-
○JOSS paper metadata
-
○Scientific vocabulary similarity
Low similarity (8.9%) to scientific vocabulary
Keywords
Repository
add-on to plotly which show molecule images on mouseover!
Basic Info
Statistics
- Stars: 255
- Watchers: 2
- Forks: 28
- Open Issues: 11
- Releases: 11
Topics
Metadata Files
README.md
molplotly


![]()
molplotly is an add-on to plotly built on RDKit which allows 2D images of molecules to be shown in plotly figures when hovering over the data points.
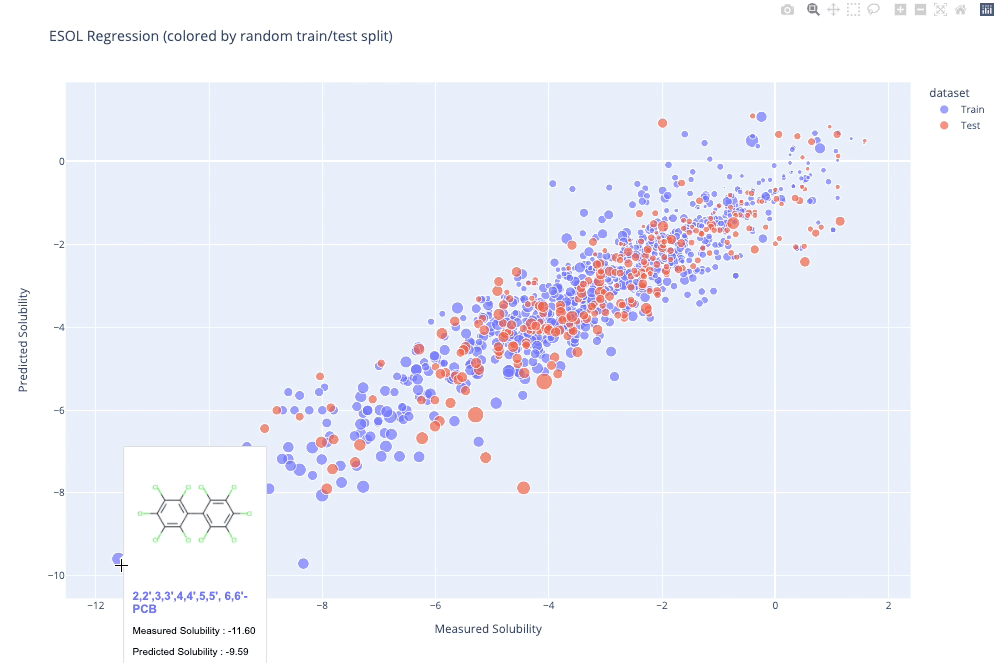
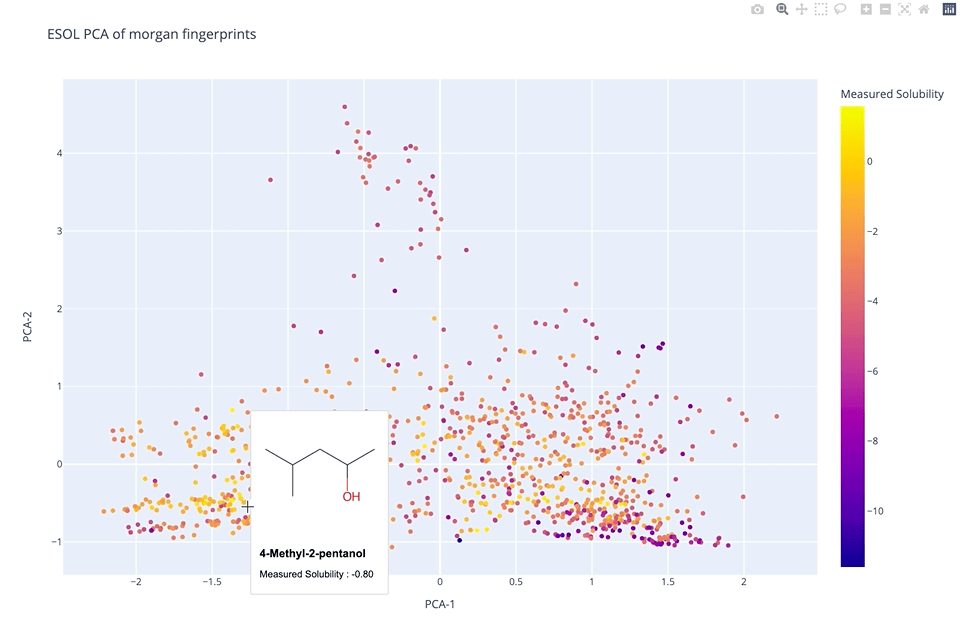
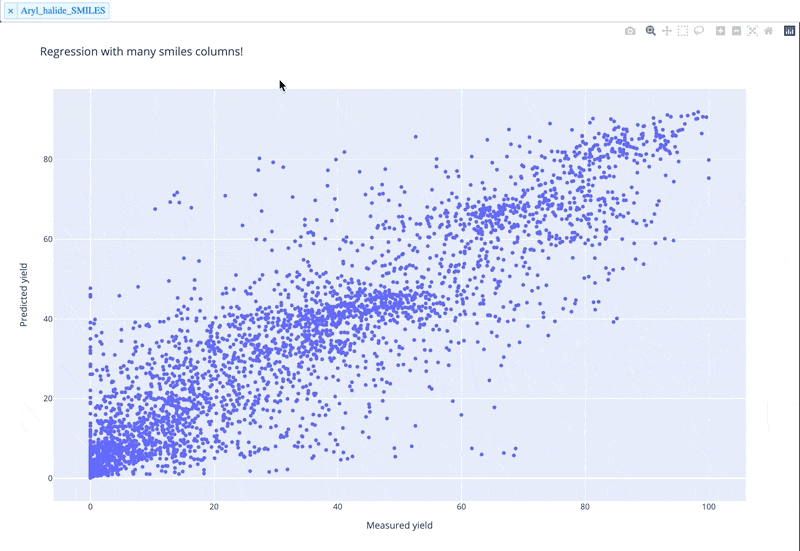
A readable walkthrough of how to use the package together with some useful examples can be found in this blog post while a runnable notebook can be found in examples/simple_usage_and_formatting.ipynb :)
Installation
sh
pip install molplotly
Usage
```python import pandas as pd import plotly.express as px
import molplotly
load a DataFrame with smiles
dfesol = pd.readcsv( 'https://raw.githubusercontent.com/deepchem/deepchem/master/datasets/delaney-processed.csv') dfesol['ypred'] = dfesol['ESOL predicted log solubility in mols per litre'] dfesol['ytrue'] = dfesol['measured log solubility in mols per litre']
generate a scatter plot
fig = px.scatter(dfesol, x="ytrue", y="y_pred")
add molecules to the plotly graph - returns a Dash app
app = molplotly.addmolecules(fig=fig, df=dfesol, smilescol='smiles', titlecol='Compound ID', )
run Dash app inline in notebook (or in an external server)
app.run_server(mode='inline', port=8700, height=1000) ```
Input parameters
| name | type | default | description |
| :------------------ | :---------- | :--------- | :-------------------------------------------------------------------------------------------------------------------------------------------------------------------- |
| fig | figure | required | a plotly figure object containing datapoints plotted from df. |
| df | DataFrame | required | a pandas dataframe that contains the data plotted in fig. |
| smiles_col | str | 'SMILES' | name of the column in df containing the smiles plotted in fig |
| show_img | bool | True | whether or not to generate the molecule image in the dash app |
| svg_size | float | 200 | the size in pixels of the molecule drawing |
| alpha | float | 0.7 | the transparency of the hoverbox, 0 for full transparency 1 for full opaqueness |
| mol_alpha | float | 0.7 | the transparency of the SVG molecule image, 0 for full transparency 1 for full opaqueness |
| title_col | str | None | name of the column in df to be used as the title entry in the hover box |
| show_coords | bool | True | whether or not to show the coordinates of the data point in the hover box |
| caption_cols | list | None | list of column names in df to be included in the hover box |
| caption_transform | dict | {} | Functions applied to captions for formatting. The dict must follow a key: function structure where the key must correspond to one of the columns in subset or tooltip |
| color_col | str | None | name of the column in df that is used to color the datapoints in df - necessary when there is discrete conditional coloring |
| symbol_col | str | None | name of the column in df that is used to determine the marker shape of the datapoints in df |
| wrap | bool | True | whether or not to wrap the title text to multiple lines if the length of the text is too long |
| wraplen | int | 20 | the threshold length of the title text before wrapping begins - adjust when changing the width of the hover box |
| width | int | 150 | the width in pixels of the hover box |
| fontfamily | str | 'Arial' | the font family used in the hover box |
| fontsize | int | 12 | the font size used in the hover box - the font of the title line is fontsize+2 |
Output parameters
by default a JupyterDash app is returned which can be run inline in a jupyter notebook or deployed on a server via app.run_server()
- The recommended
heightof the app is50+(height of the plotly figure). - For the
portof the app, make sure you don't pick the sameportas anothermolplotlyplot otherwise the tooltips will clash with each other. Also, apparently on windows port numbers below8700are used by other processes so for safety processes keep to numbers above that.
Can I run this in colab?
JupyterDash is supposed to have support for Google Colab but at some point that seems to have broken.. Keep an eye on the raised issue here! Update (1st March 2022): The plots seem to be running again but the hoverboxes are not showing so I don't think it has been fully fixed - I will keep an eye on it in the meantime.
Can I save these plots?
An issue/feature request for this has already been raised here.
moltplotly works using a Dash app which is non-trivial to export because server side javascript is needed in addition to HTML/CSS styling (as detailed here)
Until I find a way to get around that, the best alternative is to either host the plot on an app/server, exporting the plotly figure without molecules showing :( as detailed in this page. If you want to use it in a presentation I'd suggest keeping the figure open in a browser and changing windows to it during your talk!
Warning about memory size
Just adding a warning here that memory usage in a notebook can increase significanly when using plotly (not molplotly's fault!). If you notice your jupyter notebook slowing down, plotly itself is a likely culprit... In that case I'd consider either using plotly with static image rendering, or ... use seaborn :P
Acknowledgements
Owner
- Login: wjm41
- Kind: user
- Twitter: WillMcCorki1
- Repositories: 3
- Profile: https://github.com/wjm41
Citation (CITATION.cff)
cff-version: 1.2.0
message: "If you use this software, please cite it as below."
authors:
- family-names: "McCorkindale"
  given-names: "William"
  orcid: "https://orcid.org/0000-0001-6052-8833"
- family-names: "Elijošius"
  given-names: "Rokas"
  orcid: "https://orcid.org/0000-0001-6397-0002"
title: "molplotly"
version: 1.1.1
date-released: 2022-03-01
url: "https://github.com/wjm41/molplotly"
GitHub Events
Total
- Watch event: 15
- Fork event: 4
Last Year
- Watch event: 15
- Fork event: 4
Committers
Last synced: over 3 years ago
All Time
- Total Commits: 97
- Total Committers: 4
- Avg Commits per committer: 24.25
- Development Distribution Score (DDS): 0.113
Top Committers
| Name | Commits | |
|---|---|---|
| wjm41 | w****1@c****k | 86 |
| Janosh Riebesell | j****l@g****m | 7 |
| RokasEl | r****4@c****k | 3 |
| Jannis Born | j****b@z****m | 1 |
Committer Domains (Top 20 + Academic)
Issues and Pull Requests
Last synced: 11 months ago
All Time
- Total issues: 19
- Total pull requests: 16
- Average time to close issues: 14 days
- Average time to close pull requests: 10 days
- Total issue authors: 17
- Total pull request authors: 8
- Average comments per issue: 2.16
- Average comments per pull request: 0.94
- Merged pull requests: 14
- Bot issues: 0
- Bot pull requests: 0
Past Year
- Issues: 0
- Pull requests: 0
- Average time to close issues: N/A
- Average time to close pull requests: N/A
- Issue authors: 0
- Pull request authors: 0
- Average comments per issue: 0
- Average comments per pull request: 0
- Merged pull requests: 0
- Bot issues: 0
- Bot pull requests: 0
Top Authors
Issue Authors
- ArnaudGaudry (2)
- jannisborn (2)
- kjelljorner (1)
- rpoteau (1)
- kamurani (1)
- remseven (1)
- rometki (1)
- ekwan (1)
- Tonylac77 (1)
- chertianser (1)
- JudKil (1)
- mwannier30 (1)
- matthewtoholland (1)
- ipendlet (1)
- 1henno1 (1)
Pull Request Authors
- wjm41 (6)
- janosh (4)
- HellevdM (1)
- RokasEl (1)
- jannisborn (1)
- ipendlet (1)
- asiomchen (1)
- 1henno1 (1)
Top Labels
Issue Labels
Pull Request Labels
Packages
- Total packages: 1
-
Total downloads:
- pypi 634 last-month
- Total dependent packages: 2
- Total dependent repositories: 2
- Total versions: 14
- Total maintainers: 1
pypi.org: molplotly
molplotly is an add-on to plotly built on RDKit which allows 2D images of molecules to be shown in scatterplots when hovering over the datapoints.
- Homepage: https://github.com/wjm41/molplotly
- Documentation: https://molplotly.readthedocs.io/
- License: Apache License, Version 2.0
-
Latest release: 1.1.8
published about 3 years ago
Rankings
Maintainers (1)
Dependencies
- dash >=2.0.0
- ipykernel *
- jupyter-dash >=0.4.2
- nbformat *
- pandas *
- plotly >=5.0.0
- werkzeug >=2.0.0
- actions/checkout v3 composite
- actions/setup-python v2 composite
- conda-incubator/setup-miniconda v2 composite