Science Score: 64.0%
This score indicates how likely this project is to be science-related based on various indicators:
-
✓CITATION.cff file
Found CITATION.cff file -
✓codemeta.json file
Found codemeta.json file -
✓.zenodo.json file
Found .zenodo.json file -
○DOI references
-
✓Academic publication links
Links to: zenodo.org -
✓Committers with academic emails
2 of 17 committers (11.8%) from academic institutions -
○Institutional organization owner
-
○JOSS paper metadata
-
○Scientific vocabulary similarity
Low similarity (14.3%) to scientific vocabulary
Repository
Python package for Polar (Performance) Diagrams
Basic Info
Statistics
- Stars: 12
- Watchers: 2
- Forks: 2
- Open Issues: 6
- Releases: 11
Metadata Files
README.md
![]()
![]()
![]()
![]()
![]()
hrosailing
![Still in development. In particular we do not guarantee backwards compatibility to the versions 0.x.x.]!
The hrosailing package provides various tools and interfaces to
visualize, create and work with polar (performance) diagrams.
The main interface being the PolarDiagram interface for
the creation of custom polar diagrams, which is compatible with
the functionalities of this package. hrosailing also provides some
pre-implemented classes inheriting from PolarDiagram which can be used as well.
The package contains a data processing framework, centered around the
PolarPipeline class, to generate polar diagrams from raw data.
pipelinecomponents provides many out of the box parts for
the aforementioned framework as well as the possibility to easily
create own ones.
The package also provides many navigational usages of polar
(performance) diagrams with cruising.
You can find the documentation here. See also the examples below for some showcases.
Installation
![]()
![]()
![]()
![]()
The recommended way to install hrosailing is with
pip:
pip install hrosailing
It has the following dependencies:
numpyversion 1.22.0scipyversion 1.9.1matplotlibversion 3.4.3
For some features it might be necessary to also use:
pynmea2version 1.18.0pandasversion 1.3.3netCDF4version 1.6.1meteostatversion 1.6.5
The hrosailing package might also be compatible (in large) with
other versions of Python, together with others versions of some
of the used packages. However, this has not been tested properly.
Examples
In the following we showcase some of the capabilities of hrosailing.
All definitions of an example code might be used in the succeeding examples.
Serialization of PolarDiagram objects
For a first example, lets say we obtained some table with polar performance diagram data, like the one available here, and call the file testdata.csv.
```python import hrosailing.polardiagram as pol
the format of testdata.csv is a tab separated one
supported by the keyword array
pd = pol.from_csv("testdata.csv", fmt="array")
for symmetric results
pd = pd.symmetrize()
serializes the polar diagram to a .csv file
in the style of an intern format
pd.tocsv("polardiagram.csv")
the default format is the intern format hro
pd2 = pol.fromcsv("polardiagram.csv") ```
Currently serialization is only supported for some csv-formats, see also csv-format-examples for example files for the currently supported formats. See also Issue #1 for a plan to add more serialization options.
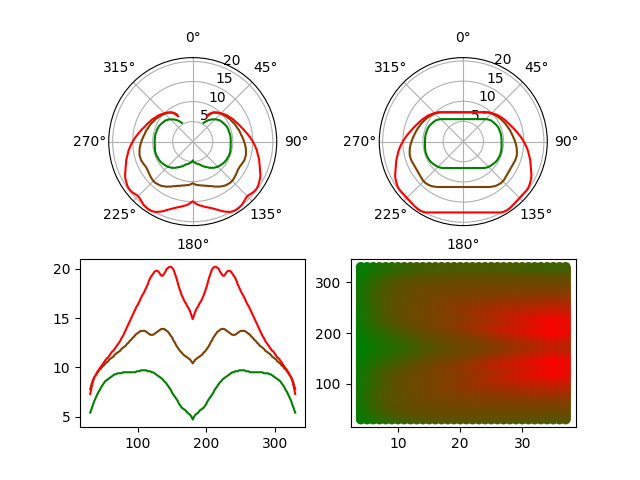
Visualizing polar diagrams
```python import matplotlib.pyplot as plt import hrosailing.plotting as plot
ws = [10, 20, 30]
plt.subplot(2, 2, 1, projection="hro polar").plot(pd, ws=ws) plt.subplot(2, 2, 2, projection="hro polar").plot(pd, ws=ws, useconvexhull=True) plt.subplot(2, 2, 3, projection="hro flat").plot(pd, ws=ws) plt.subplot(2, 2, 4, projection="hro color gradient").plot(pd)
plt.show()
```
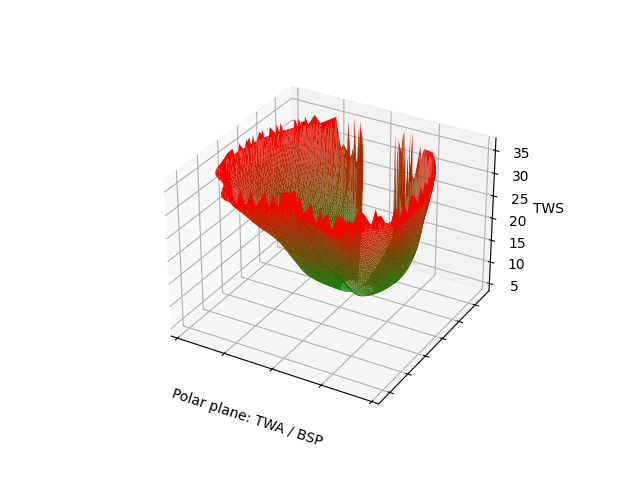
3d visualization is also supported.
python
plot.plot_3d(pd)
plt.show()
Iterate over polar diagram data
We can also directly iterate and/or evaluate the wind angles, wind speeds and boat speeds of the polar diagram.
```python import numpy as np
def randomshiftedpt(pt, mul): pt = np.array(pt) rand = np.random.random(pt.shape) - 0.5 rand *= np.array(mul) randompt = pt + rand for i in range(3): randompt[i] = max(randompt[i], 0) return randompt
data = np.array([ randomshiftedpt([ws, wa, pd(ws, wa)], [10, 5, 2]) for wa in pd.windangles for ws in pd.windspeeds for _ in range(6) ]) data = data[np.random.choice(len(data), size=500)] ```
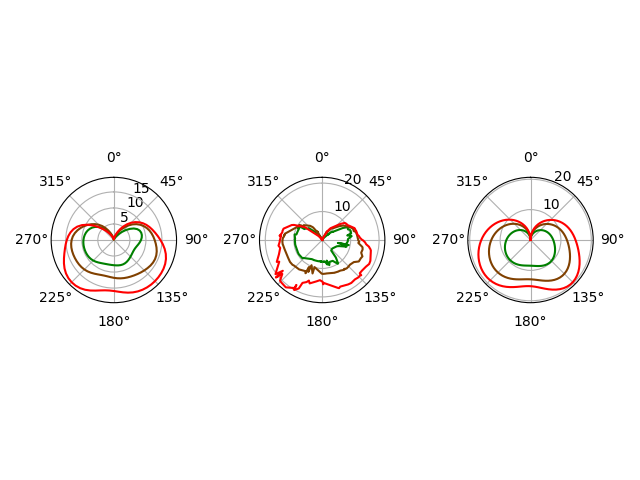
Creating polar diagrams from raw data
```python import hrosailing.pipeline as pipe import hrosailing.processing as proc
polpips = [ pipe.PolarPipeline( datahandler=proc.ArrayHandler(), imputator=proc.RemoveOnlyImputator(), extension=pipe.TableExtension() ), pipe.PolarPipeline( datahandler=proc.ArrayHandler(), imputator=proc.RemoveOnlyImputator(), extension=pipe.PointcloudExtension() ), pipe.PolarPipeline( datahandler=proc.ArrayHandler(), imputator=proc.RemoveOnlyImputator(), extension=pipe.CurveExtension() ) ]
here data is treated as some obtained measurements given as
a numpy.ndarray
pds = [ polpip( [(data, ["Wind speed", "Wind angle", "Boat speed"])] ).polardiagram for polpip in pol_pips ]
for i, pd in enumerate(pds): plt.subplot(1, 3, i+1, projection="hro polar").plot(pd, ws=ws)
plt.tight_layout() plt.show() ```
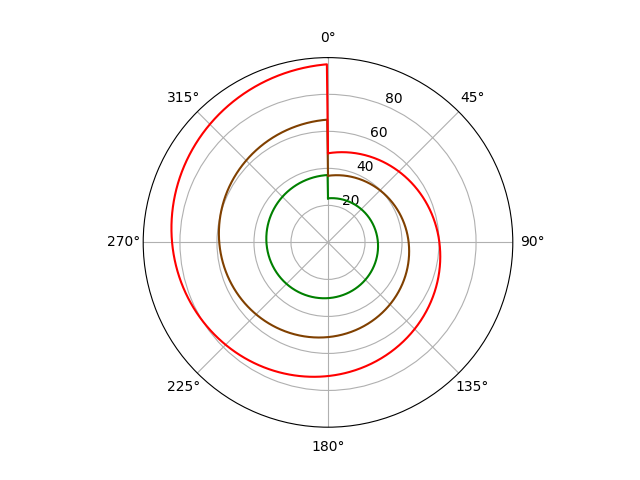
If we are unhappy with the default behaviour of the pipelines, we can customize one or more components of it.
Customizing PolarPipeline
```python import hrosailing.models as models
class MyInfluenceModel(models.InfluenceModel): def remove_influence(self, data): tws = np.array(data["TWS"]) twa = np.array(data["TWA"]) bsp = np.array(data["BSP"]) return np.array([ tws, (twa + 90)%360, bsp**2 ]).transpose()
def add_influence(self, pd, influence_data: dict):
    pass
class MyFilter(proc.Filter): def filter(self, wts): return np.logical_or(wts <= 0.2, wts >= 0.8)
def mymodelfunc(ws, wa, params): return params[0] + params[1]wa + params[2]ws + params[3]ws*wa
myregressor = proc.LeastSquareRegressor( modelfunc=mymodelfunc, init_vals=(1, 2, 3, 4) )
myextension = pipe.CurveExtension( regressor=myregressor )
def my_norm(pt): return np.linalg.norm(pt, axis=1)**4
mypolpip = pipe.PolarPipeline( datahandler=proc.ArrayHandler(), imputator=proc.RemoveOnlyImputator(), influencemodel=MyInfluenceModel(), postweigher=proc.CylindricMeanWeigher(radius=2, norm=mynorm), extension=myextension, postfilter=MyFilter() )
out = mypolpip([(data, ["Wind speed", "Wind angle", "Boat speed"])]) my_pd = out.polardiagram ```
The customizations above are arbitrary and lead to comparably bad results:
python
plot.plot_polar(my_pd, ws=ws)
plt.show()
Including Influences and Weather models
For the next example we initialize a simple influence model and a random weather model.
```python from datetime import timedelta from datetime import datetime as dt
class MyInfluenceModel(models.InfluenceModel):
def remove_influence(self, data):
    pass

def add_influence(self, pd, data, **kwargs):
    ws, wa, wave_height = np.array(
        [data["TWS"], data["TWA"], data["WVHGT"]]
    )
    twa = (wa + 5)%360
    tws = ws + ws/wave_height
    return [pd(ws, wa) for ws, wa in zip(tws, twa)]
im = MyInfluenceModel()
n, m, k, l = 500, 50, 40, 3
data = 20 * (np.random.random((n, m, k, l)))
wm = models.GriddedWeatherModel( data=data, times=[dt.now() + i * timedelta(hours=1) for i in range(n)], lats=np.linspace(40, 50, m), lons=np.linspace(40, 50, k), attrs=["TWS", "TWA", "WVHGT"] ) ```
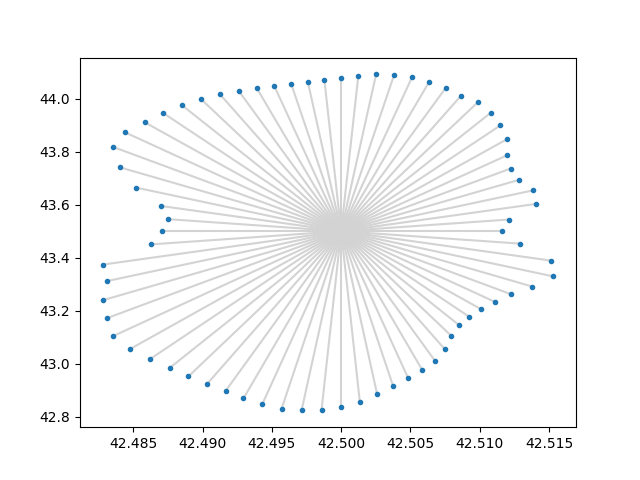
Computing Isochrones
```python import hrosailing.cruising as cruise
start = (42.5, 43.5)
isochrones = [ cruise.isochrone( pd=pd, start=start, starttime=dt.now(), direction=direction, wm=wm, im=im, totaltime=1 / 3 ) for direction in range(0, 360, 5) ]
coordinates, _ = zip(isochrones) lats, longs = zip(coordinates)
for lat, long in coordinates: plt.plot([start[0], lat], [start[1], long], color="lightgray") plt.plot(lats, longs, ls="", marker=".")
plt.show()
```
License
The hrosailing package is published under the
Apache 2.0 License,
see also License
Citing
![]()
Also see Citation.
TODO
Owner
- Name: hrosailing
- Login: hrosailing
- Kind: organization
- Repositories: 2
- Profile: https://github.com/hrosailing
Citation (CITATION.cff)
cff-version: 1.2.0
message: "If you use this software, please cite it as below."
authors:
- family-names: "Dannenberg"
  given-names: "Valentin"
- family-names: "Schüler"
  given-names: "Robert"
title: "hrosailing"
version: 0.12.0
doi: 10.5281/zenodo.6322872
date-released: 2025-03-22
url: "https://github.com/hrosailing/hrosailing"
GitHub Events
Total
- Create event: 4
- Release event: 2
- Issues event: 5
- Watch event: 3
- Issue comment event: 13
- Push event: 17
- Pull request review event: 7
- Pull request review comment event: 10
- Pull request event: 5
- Fork event: 1
Last Year
- Create event: 4
- Release event: 2
- Issues event: 5
- Watch event: 3
- Issue comment event: 13
- Push event: 17
- Pull request review event: 7
- Pull request review comment event: 10
- Pull request event: 5
- Fork event: 1
Committers
Last synced: over 3 years ago
All Time
- Total Commits: 2,085
- Total Committers: 17
- Avg Commits per committer: 122.647
- Development Distribution Score (DDS): 0.729
Top Committers
| Name | Commits | |
|---|---|---|
| Robert Schueler | r****9@g****m | 565 |
| Ente | e****e@e****e | 425 |
| VFDannenberg | v****n@g****m | 275 |
| VFDannenberg | 7****g@u****m | 262 |
| autoblack | a****k@u****m | 133 |
| autoisort | a****t@u****m | 101 |
| Valentin Dannenberg | 7****k@u****m | 88 |
| Loitador41 | j****e@u****e | 66 |
| Teodor Rata | v****2@u****e | 54 |
| RobertSchueler | 7****r@u****m | 35 |
| Jasko | j****s@g****m | 22 |
| format | f****t@u****m | 21 |
| RobertSchueler | R****r@u****m | 19 |
| Julia | 9****1@u****m | 8 |
| rubbinduck | r****k@u****m | 4 |
| rubbinduck | r****k@g****m | 4 |
| Robert Schueler | r****r@w****e | 3 |
Committer Domains (Top 20 + Academic)
Issues and Pull Requests
Last synced: 10 months ago
All Time
- Total issues: 96
- Total pull requests: 16
- Average time to close issues: about 1 month
- Average time to close pull requests: 8 days
- Total issue authors: 5
- Total pull request authors: 3
- Average comments per issue: 0.9
- Average comments per pull request: 0.81
- Merged pull requests: 15
- Bot issues: 0
- Bot pull requests: 0
Past Year
- Issues: 3
- Pull requests: 6
- Average time to close issues: 6 days
- Average time to close pull requests: 24 days
- Issue authors: 2
- Pull request authors: 2
- Average comments per issue: 2.33
- Average comments per pull request: 1.67
- Merged pull requests: 5
- Bot issues: 0
- Bot pull requests: 0
Top Authors
Issue Authors
- Loitador41 (86)
- RobertSchueler (6)
- ptr-rennstoff (2)
- jbfdomage (1)
- m-h-w (1)
Pull Request Authors
- RobertSchueler (10)
- ptr-rennstoff (3)
- Loitador41 (2)
Top Labels
Issue Labels
Pull Request Labels
Packages
- Total packages: 1
-
Total downloads:
- pypi 69 last-month
- Total dependent packages: 0
- Total dependent repositories: 1
- Total versions: 11
- Total maintainers: 1
pypi.org: hrosailing
Python library for Polar (Performance) Diagrams
- Homepage: https://github.com/hrosailing/hrosailing
- Documentation: https://hrosailing.readthedocs.io/
- License: Apache Software License
-
Latest release: 0.12.0
published about 1 year ago
Rankings
Maintainers (1)
Dependencies
- matplotlib *
- numpy *
- pandas *
- pynmea2 *
- scipy *
- setuptools *
- actions/checkout v3 composite
- actions/setup-python v3 composite
- actions/checkout v2 composite
- actions/setup-python v1 composite
- actions/checkout v2 composite
- actions/setup-python v2 composite
- actions/checkout v3 composite
- actions/setup-python v3 composite
- pypa/gh-action-pypi-publish release/v1 composite
- actions/checkout v3 composite
- actions/deploy-pages v1 composite
- actions/setup-python v3 composite
- actions/upload-artifact v3 composite