https://github.com/cmudig/emblaze
Interactive Jupyter notebook widget for visually comparing embedding spaces.
Science Score: 13.0%
This score indicates how likely this project is to be science-related based on various indicators:
-
○CITATION.cff file
-
✓codemeta.json file
Found codemeta.json file -
○.zenodo.json file
-
○DOI references
-
○Academic publication links
-
○Committers with academic emails
-
○Institutional organization owner
-
○JOSS paper metadata
-
○Scientific vocabulary similarity
Low similarity (14.3%) to scientific vocabulary
Repository
Interactive Jupyter notebook widget for visually comparing embedding spaces.
Basic Info
- Host: GitHub
- Owner: cmudig
- License: bsd-3-clause
- Language: JavaScript
- Default Branch: main
- Size: 14.7 MB
Statistics
- Stars: 112
- Watchers: 3
- Forks: 5
- Open Issues: 1
- Releases: 0
Metadata Files
README.md
Emblaze - Interactive Embedding Comparison
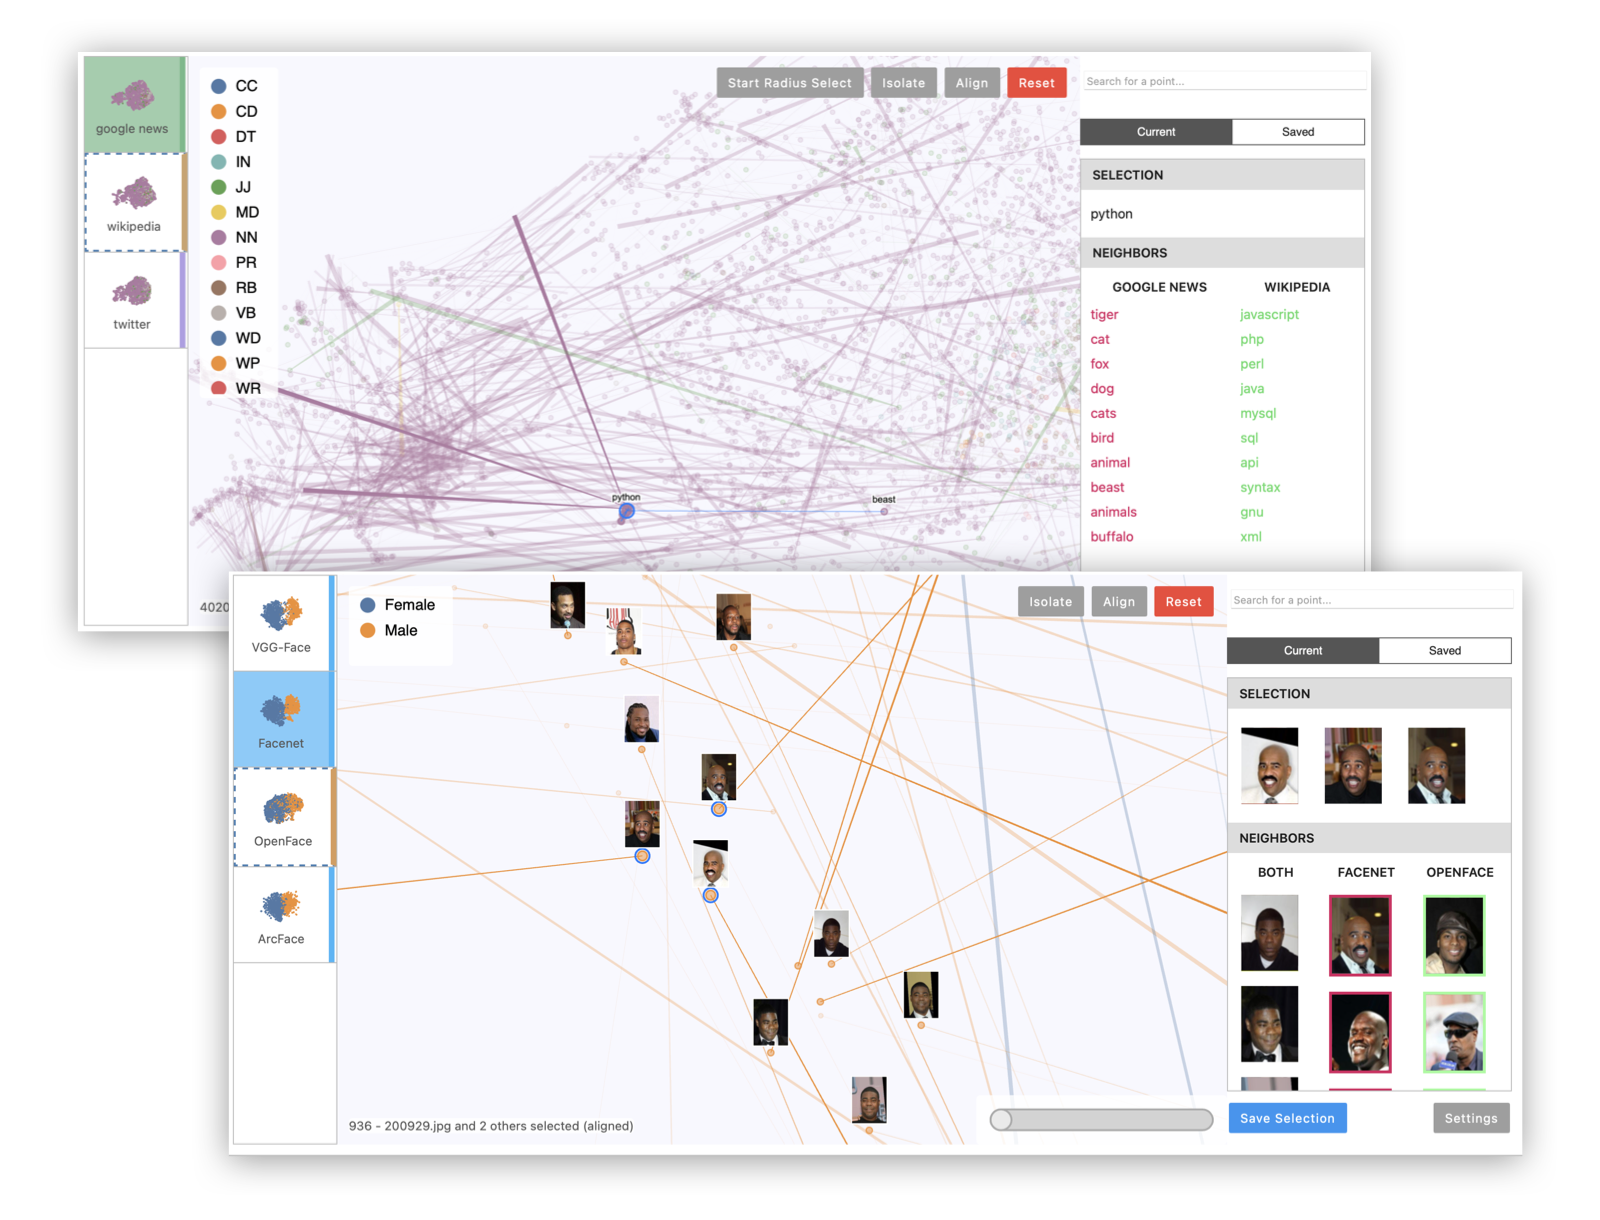
Emblaze is a Jupyter notebook widget for visually comparing embeddings using animated scatter plots. It bundles an easy-to-use Python API for performing dimensionality reduction on multiple sets of embedding data (including aligning the results for easier comparison), and a full-featured interactive platform for probing and comparing embeddings that runs within a Jupyter notebook cell. Read the documentation >
Installation
Compatibility Note: Emblaze has been tested using Python >= 3.7. If you are using JupyterLab, please make sure you are running version 3.0 or higher. NEW: The widget should work in VS Code and Colab environments thanks to using anywidget for platform-agnostic packaging. Please file a GitHub issue if you notice any compatibility problems.
Install Emblaze using pip:
bash
pip install emblaze
The widget should work out of the box when you run jupyter lab (or open a notebook in VS Code or Colab) and follow the example code below.
Examples
Please see examples/example.ipynb to try using the Emblaze widget on the Boston housing prices or MNIST (TensorFlow import required) datasets.
Example 1: Multiple projections of the same embedding dataset. This can reveal areas of variation in the dimensionality reduction process, since tSNE and UMAP are randomized algorithms.
```python import emblaze from emblaze.utils import Field, ProjectionTechnique
X is an n x k array, Y is a length-n array
X, Y = ...
Represent the high-dimensional embedding
emb = emblaze.Embedding({Field.POSITION: X, Field.COLOR: Y})
Compute nearest neighbors in the high-D space (for display)
emb.compute_neighbors(metric='cosine')
Generate UMAP 2D representations - you can pass UMAP parameters to project()
variants = emblaze.EmbeddingSet([ emb.project(method=ProjectionTechnique.UMAP) for _ in range(10) ])
Compute neighbors again (to indicate that we want to compare projections)
variants.compute_neighbors(metric='euclidean')
w = emblaze.Viewer(embeddings=variants) w ```
Example 2: Multiple embeddings of the same data from different models. This is useful to see how different models embed data differently.
```python
Xs is a list of n x k arrays corresponding to different embedding spaces
Xs = ...
Y is a length-n array of labels for color-coding
Y = ...
List of strings representing the name of each embedding space (e.g.
"Google News", "Wikipedia", "Twitter"). Omit to use generic names
embedding_names = [...]
Make high-dimensional embedding objects
embeddings = emblaze.EmbeddingSet([ emblaze.Embedding({Field.POSITION: X, Field.COLOR: Y}, label=embname) for X, embname in zip(Xs, embeddingnames) ]) embeddings.computeneighbors(metric='cosine')
Make aligned UMAP
reduced = embeddings.project(method=ProjectionTechnique.ALIGNED_UMAP)
w = emblaze.Viewer(embeddings=reduced) w ```
Example 3: Visualizing image data with image thumbnails. The viewer will display image previews for each point as well as its nearest neighbors. (For text data, you can use TextThumbnails to show small pieces of text next to the points.)
```python
images is an n x 100 x 100 x 3 numpy array of 100x100 RGB images (values from 0-255)
images = ... thumbnails = emblaze.ImageThumbnails(images) w = emblaze.Viewer(embeddings=embeddings, thumbnails=thumbnails) w ```
You can also visualize embeddings with multimodal labels (i.e. where some points have text labels and others have image labels) by initializing an emblaze.CombinedThumbnails instance with a list of other Thumbnails objects to combine.
See the documentation for more details on defining and configuring comparisons with Emblaze.
Development Installation
Clone repository, then install dependencies. (Note: you may find it easier to install SciPy using conda first - conda install scipy)
bash
pip install -r requirements.txt
Install the python package.
bash
pip install -e .
In one terminal, cd into the client directory and then run vite. This will start a live reload service for the frontend. In another terminal, start a jupyter lab server and open a notebook to start the Emblaze viewer. When you edit the frontend code, you will need to reload the JupyterLab webpage to see the results. When you edit the backend code, you will need to restart the Jupyter Python kernel.
Building Documentation
Install pdoc3: pip install pdoc3
Build documentation:
bash
pdoc --html --force --output-dir docs --template-dir docs/templates emblaze
Deployment
Bump the widget version in emblaze/_version.py, package.json, and pyproject.toml if applicable. Then build the notebook widgets:
vite build
Run the packaging script to generate the wheel for distribution:
pip install --upgrade build twine
python -m build
Upload to PyPI (replace <VERSION> with the version number):
twine upload dist/emblaze-<VERSION>*
Development Notes
- Svelte transitions don't seem to work well as they force an expensive re-layout operation. Avoid using them during interactions.
Owner
- Name: CMU Data Interaction Group
- Login: cmudig
- Kind: organization
- Location: Pittsburgh, PA
- Website: https://dig.cmu.edu/
- Repositories: 32
- Profile: https://github.com/cmudig
People, Visualization, Analysis, Machine Learning
GitHub Events
Total
- Issues event: 1
- Watch event: 8
- Issue comment event: 1
- Push event: 2
- Pull request event: 3
- Create event: 2
Last Year
- Issues event: 1
- Watch event: 8
- Issue comment event: 1
- Push event: 2
- Pull request event: 3
- Create event: 2
Committers
Last synced: over 1 year ago
Top Committers
| Name | Commits | |
|---|---|---|
| Venkatesh Sivaraman | v****8@g****m | 97 |
| yiwei-w | s****e | 19 |
Issues and Pull Requests
Last synced: about 1 year ago
All Time
- Total issues: 4
- Total pull requests: 17
- Average time to close issues: about 1 month
- Average time to close pull requests: 2 days
- Total issue authors: 4
- Total pull request authors: 1
- Average comments per issue: 0.75
- Average comments per pull request: 0.82
- Merged pull requests: 17
- Bot issues: 0
- Bot pull requests: 0
Past Year
- Issues: 1
- Pull requests: 2
- Average time to close issues: about 2 months
- Average time to close pull requests: 1 minute
- Issue authors: 1
- Pull request authors: 1
- Average comments per issue: 1.0
- Average comments per pull request: 0.0
- Merged pull requests: 2
- Bot issues: 0
- Bot pull requests: 0
Top Authors
Issue Authors
- venkatesh-sivaraman (1)
- osigurdson (1)
- 0phoff (1)
Pull Request Authors
- venkatesh-sivaraman (20)
Top Labels
Issue Labels
Pull Request Labels
Packages
- Total packages: 1
-
Total downloads:
- pypi 452 last-month
- Total dependent packages: 0
- Total dependent repositories: 1
- Total versions: 13
- Total maintainers: 1
pypi.org: emblaze
Interactive widget for embedding comparison
- Homepage: https://github.com/cmudig/emblaze
- Documentation: https://emblaze.readthedocs.io/
- License: MIT License
-
Latest release: 0.11.0
published about 1 year ago
Rankings
Maintainers (1)
Dependencies
- 1641 dependencies
- @babel/core ^7.13.15 development
- @babel/plugin-proposal-class-properties ^7.13.0 development
- @babel/preset-env ^7.13.15 development
- @jupyterlab/builder ^3.1.6 development
- @phosphor/application ^1.6.0 development
- @phosphor/widgets ^1.6.0 development
- @tsconfig/svelte ^1.0.10 development
- @types/node ^10.17.58 development
- @types/webpack-env ^1.13.6 development
- @typescript-eslint/eslint-plugin ^3.6.0 development
- @typescript-eslint/parser ^3.6.0 development
- @webpack-cli/serve ^1.3.1 development
- acorn ^7.2.0 development
- babel-loader ^8.2.2 development
- css-loader ^3.6.0 development
- eslint ^7.24.0 development
- eslint-config-prettier ^6.11.0 development
- eslint-plugin-prettier ^3.4.0 development
- fa-svelte ^3.1.0 development
- fs-extra ^7.0.0 development
- mini-css-extract-plugin ^1.5.0 development
- mkdirp ^0.5.1 development
- npm-run-all ^4.1.3 development
- prettier ^2.0.5 development
- rimraf ^2.6.2 development
- source-map-loader ^0.2.4 development
- style-loader ^1.0.0 development
- svelte ^3.37.0 development
- svelte-loader ^3.1.1 development
- ts-loader ^5.2.1 development
- typescript ~3.8 development
- webpack ^4.20.2 development
- webpack-cli ^4.6.0 development
- webpack-dev-server ^3.11.2 development
- @fortawesome/free-solid-svg-icons ^5.15.3
- @jupyter-widgets/base ^1.1.10 || ^2 || ^3
- @types/d3 ^7.0.0
- d3 ^6.7.0
- d3-svg-legend ^2.25.6
- mathjs ^9.3.2
- pixi.js ^6.1.3
- 1668 dependencies
- affine ==2.3.0
- colormath ==3.0.0
- eventlet ==0.33.0
- flask ==2.0.1
- flask-socketio ==5.1.1
- numba ==0.53.1
- numpy ==1.19.5
- pandas ==1.2.0
- pillow ==8.2.0
- redis ==4.1.0
- redis-server ==6.0.9
- scikit-learn ==0.24.1
- scipy ==1.6.0
- tqdm ==4.61.2
- umap-learn ==0.5.1
- affine >=2.3.0
- colormath >=3.0.0
- eventlet >=0.33.0
- flask >=1.1.2
- flask-socketio >=5.1.1
- ipywidgets >=7.0.0
- numba >=0.53.1
- numpy >=1.19.5
- pandas >=1.2.0
- pillow >=8.2.0
- redis >=4.1.0
- redis-server >=6.0.9
- scikit-learn >=0.24.1
- scipy >=1.6.0
- tqdm >=4.61.2
- umap-learn >=0.5.1