https://github.com/cmudig/data-navigator
A JavaScript library that allows for accessible navigation of data structures.
Science Score: 13.0%
This score indicates how likely this project is to be science-related based on various indicators:
-
○CITATION.cff file
-
✓codemeta.json file
Found codemeta.json file -
○.zenodo.json file
-
○DOI references
-
○Academic publication links
-
○Committers with academic emails
-
○Institutional organization owner
-
○JOSS paper metadata
-
○Scientific vocabulary similarity
Low similarity (10.6%) to scientific vocabulary
Keywords
Keywords from Contributors
Repository
A JavaScript library that allows for accessible navigation of data structures.
Basic Info
- Host: GitHub
- Owner: cmudig
- License: mit
- Language: TypeScript
- Default Branch: main
- Homepage: http://dig.cmu.edu/data-navigator/
- Size: 2.63 MB
Statistics
- Stars: 47
- Watchers: 6
- Forks: 1
- Open Issues: 0
- Releases: 13
Topics
Metadata Files
README.md
Data Navigator
Data Navigator is a JavaScript library that allows for navigation of data structures. Data Navigator makes png, svg, canvas, and even webgl graphics accessible to a wide array of assistive technologies and input modalities.
Check out our online, interactive demo for a video introduction and to try out Data Navigator hands-on.
Check out our docs to learn more about getting started.
Data Navigator's approach
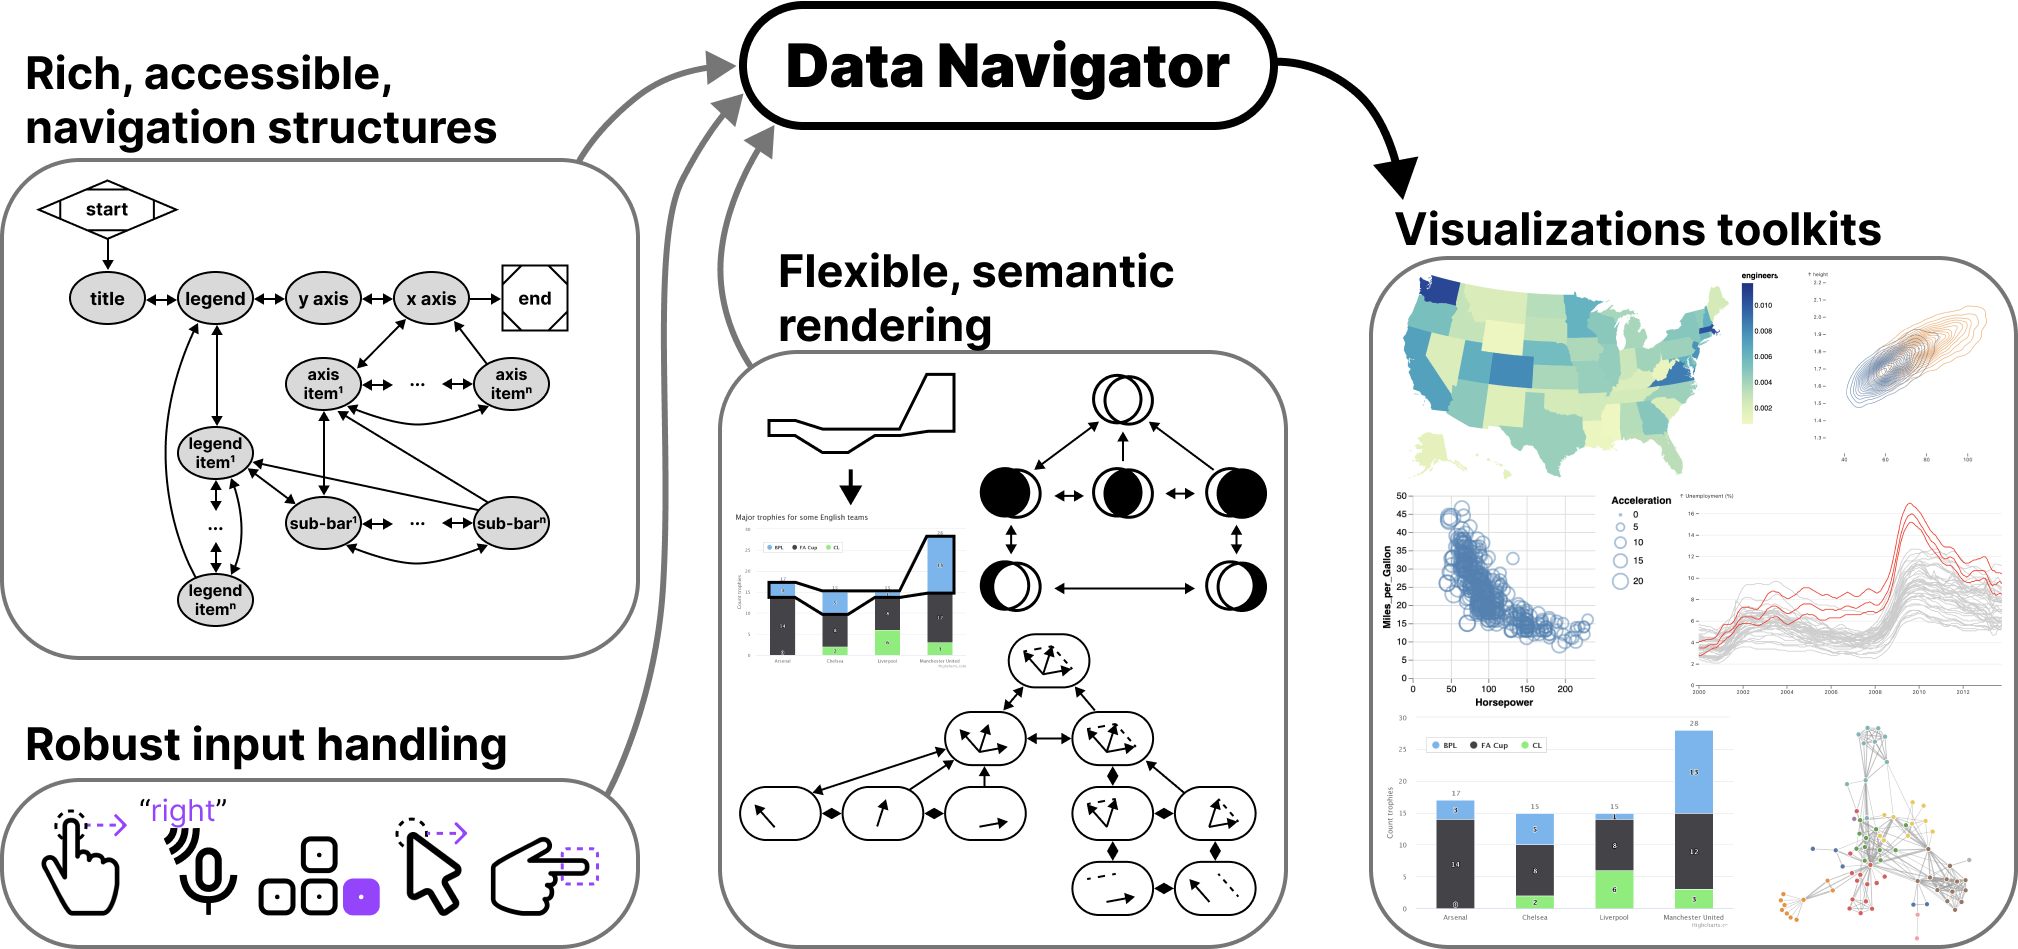
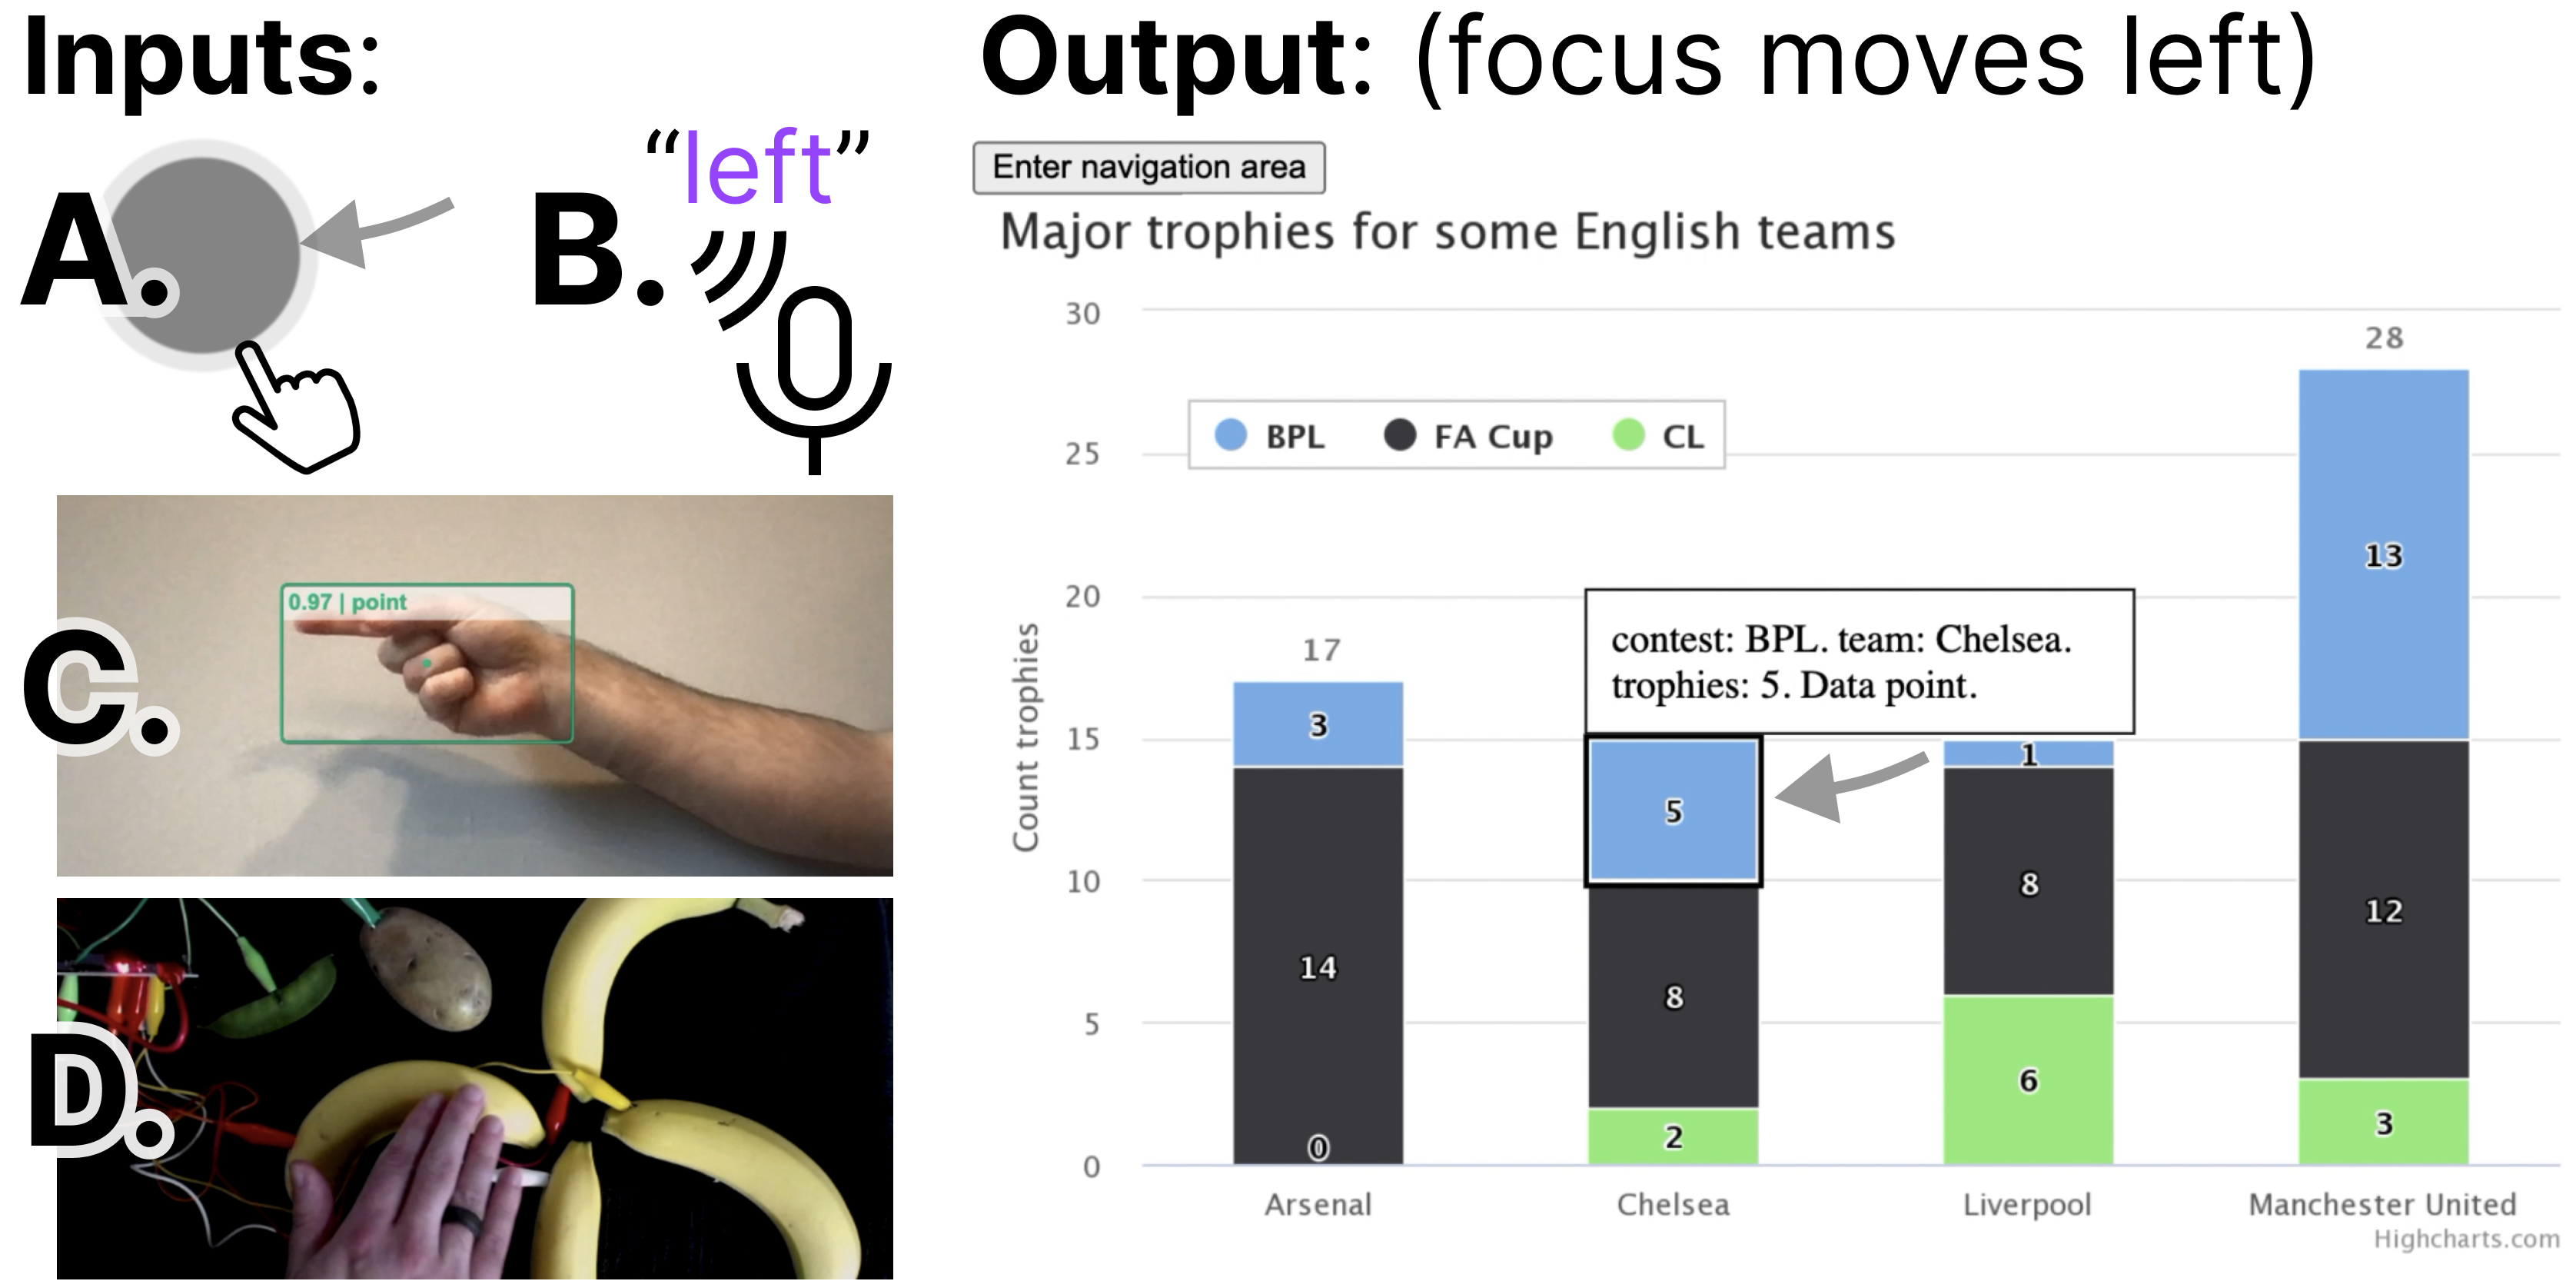
Data Navigator has abstracted navigation into commands, which enables it to easily receive input from screen readers and keyboards to more interesting modalities like touch and mouse swiping, spoken commands, hand gestures, and even fabricated or totally novel interfaces, like bananas.
Data Navigator is expressive for builders and enables entire toolkits or ecosystems to become more accessible. The system provides low-level control over narratives, interaction paths, and journeys a user might want to take through an image or graphic.
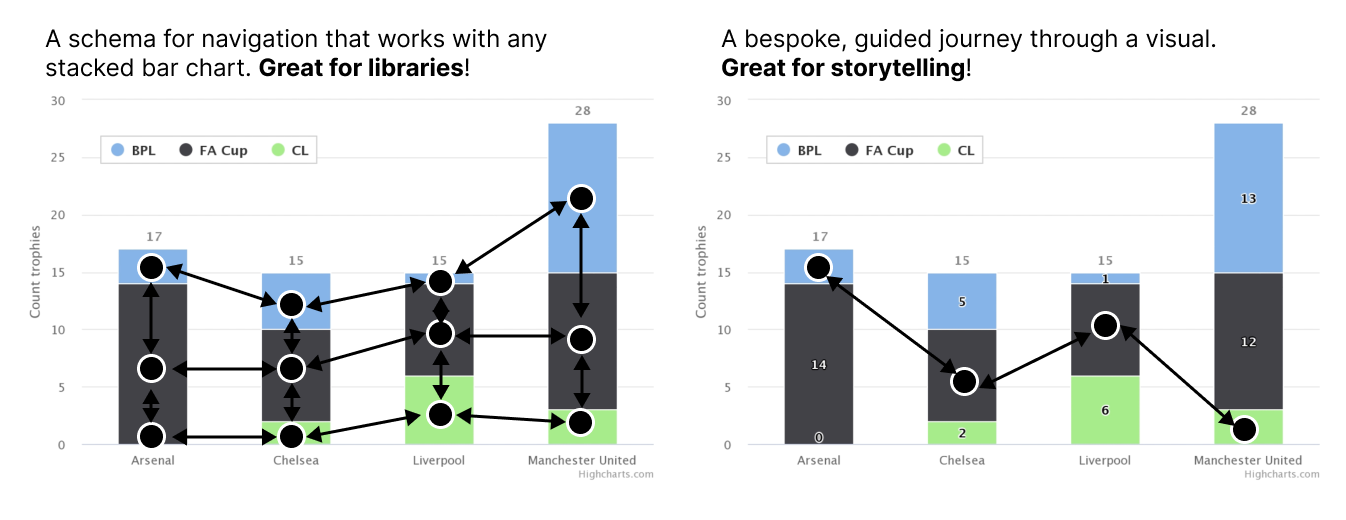
Developers can build schemas that scale to work with any chart in a charting library or a single, bespoke implemetation for use in story-telling contexts like journalism, reports, presentations, and interactive infographics.
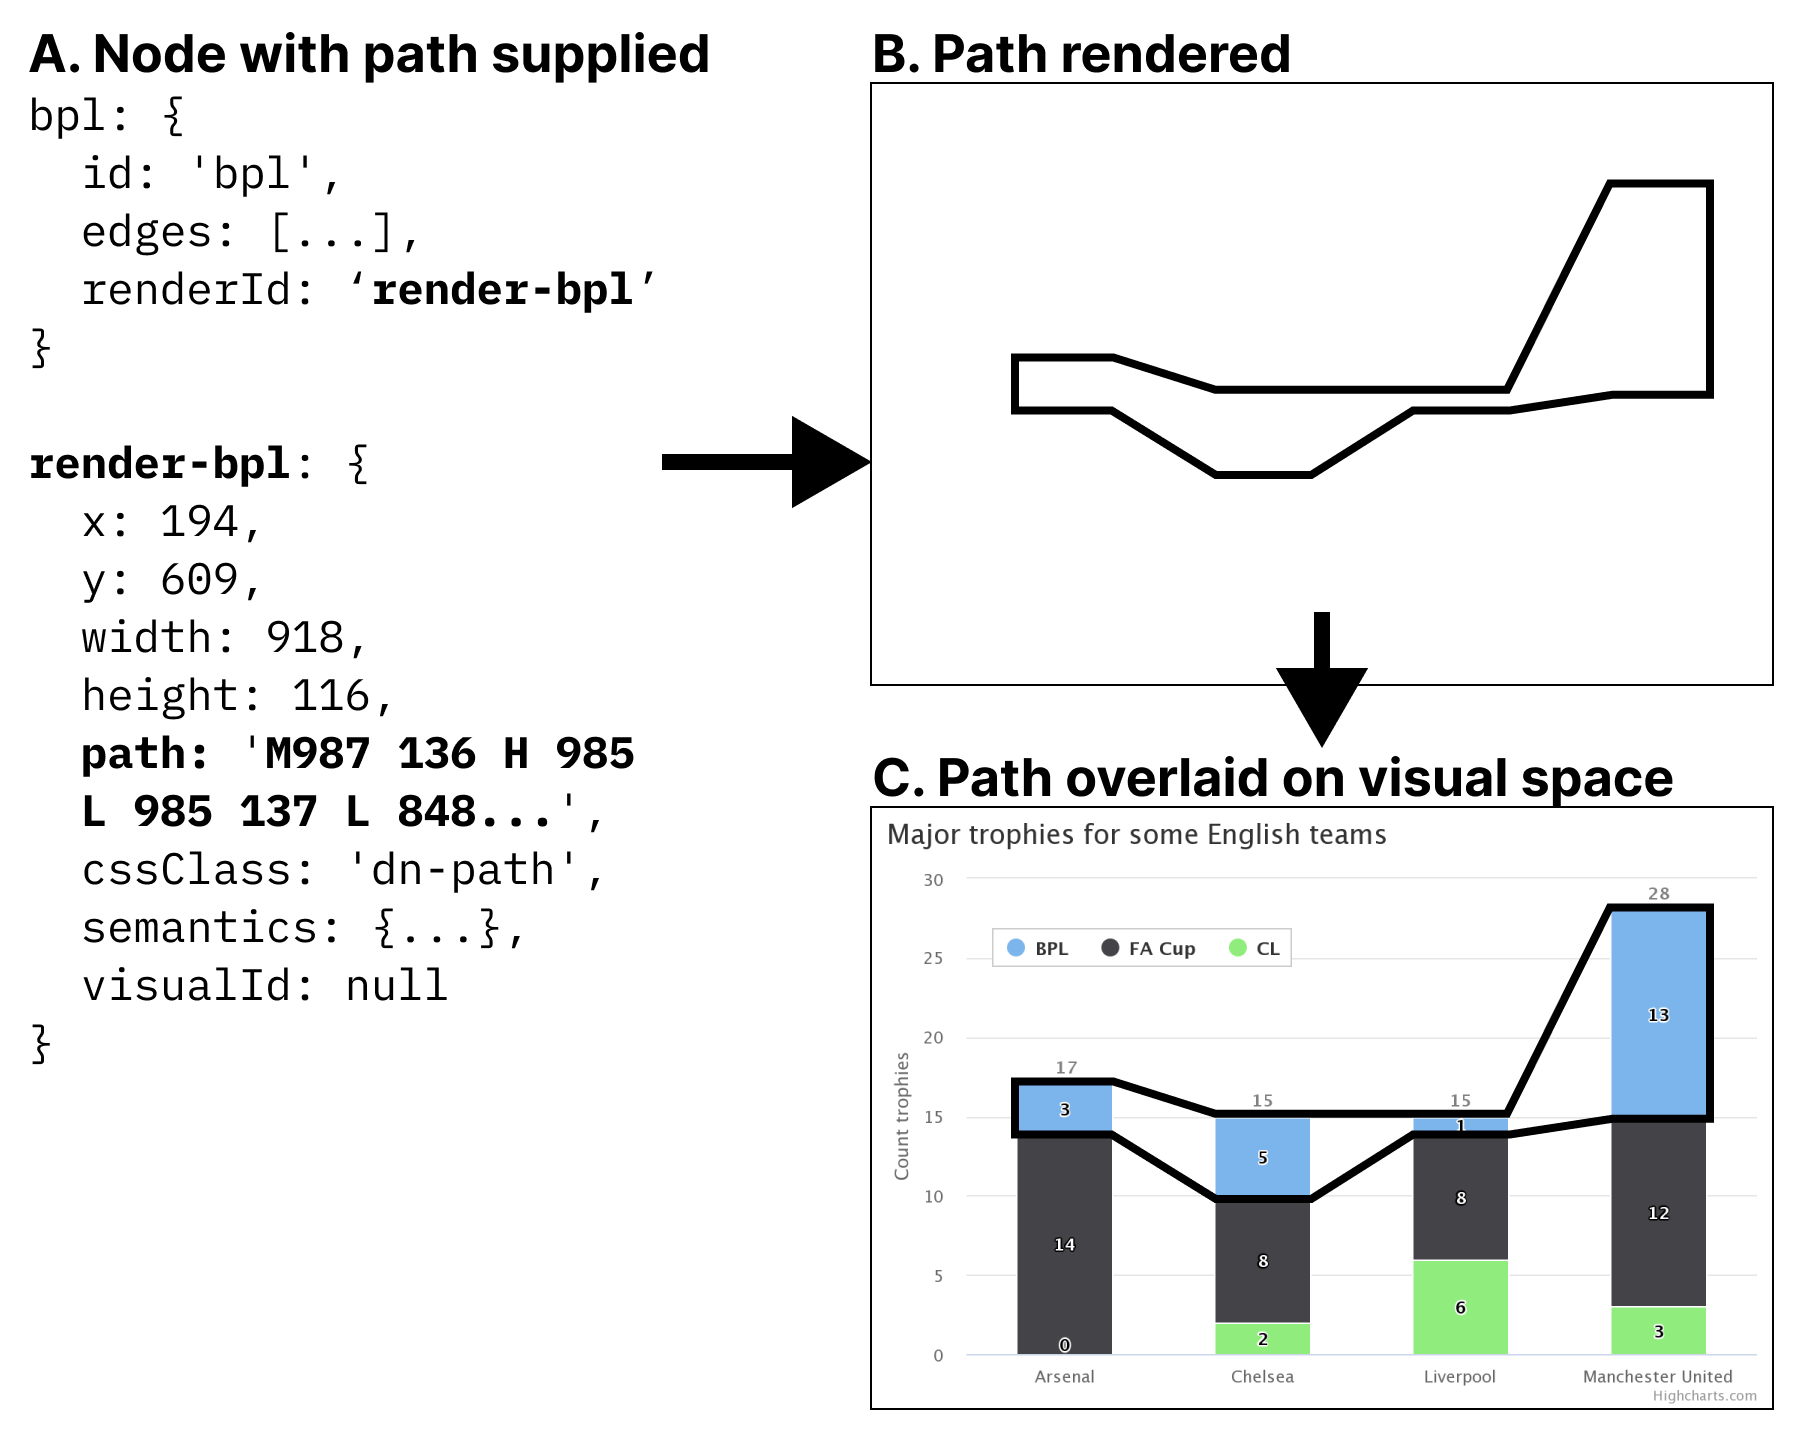
Not only are paths through an image customizeable but so are the visual indications that are rendered alongside those journeys. These visual indications use semantically rich, native HTML elements for maximized accessibility.
Visit our landing page to try our demo, which shows a png image made into navigable experience. A variety of input modalities are enabled, including touch and mouse swiping, keyboard, screen reader, text input, voice control, and hand gesture recognition.
We also have a vega-lite demo online, which (under the hood) shows how someone could write one schema that serves any chart in an ecosystem.
System design
Data Navigator is organized into 3 separately composable modules: the first is a graph-based structure of nodes and edges, the second handles input and navigation logic, and the third renders the structure. These may be leveraged together or independently. Read our paper to learn more!
Types
Our types are consolidated into a single types export file, designed (mostly) as a grammar. Each major module is broken down into subparts, each with their own types, all the way to the primitive-most types used.
Getting started
We have a thorough introduction to building a navigable visualization on our docs site. But for basic installation, see below:
You can install or use both esm and cjs modules in a variety of ways, in addition to importing all of data-navigator or just one part.
```
to install into a project
npm install data-navigator ```
```js // to use it in a .js or .ts file import { default as dataNavigator } from 'data-navigator';
// whole ecosystem console.log('dataNavigator', dataNavigator);
// one module in the ecosystem console.log('dataNavigator.rendering', dataNavigator.rendering); ```
html
<!-- and even as a script tag module loaded from a cdn -->
<script type="module">
    // pay attention to the version! the latest may be higher than this example
    import dataNavigator from 'https://cdn.jsdelivr.net/npm/data-navigator@2.2.0/dist/index.mjs';
    console.log(dataNavigator);
</script>
Credit
Data-Navigator was developed at CMU's Data Interaction Group (CMU DIG), primarily by Frank Elavsky.
Citing Data Navigator
bib
@article{2023-data-navigator,
  year = {2023},
  author = {Frank Elavsky and Lucas Nadolskis and Dominik Moritz},
  title = {{Data Navigator:} An Accessibility-Centered Data Navigation Toolkit},
  journal = {{IEEE} {VIS}}
}
Owner
- Name: CMU Data Interaction Group
- Login: cmudig
- Kind: organization
- Location: Pittsburgh, PA
- Website: https://dig.cmu.edu/
- Repositories: 32
- Profile: https://github.com/cmudig
People, Visualization, Analysis, Machine Learning
GitHub Events
Total
- Release event: 5
- Watch event: 9
- Delete event: 7
- Issue comment event: 1
- Push event: 35
- Pull request event: 12
- Create event: 9
Last Year
- Release event: 5
- Watch event: 9
- Delete event: 7
- Issue comment event: 1
- Push event: 35
- Pull request event: 12
- Create event: 9
Committers
Last synced: 11 months ago
Top Committers
| Name | Commits | |
|---|---|---|
| Frank Elavsky | f****y@g****m | 176 |
| dependabot[bot] | 4****] | 1 |
| Dominik Moritz | d****z@g****m | 1 |
Issues and Pull Requests
Last synced: 11 months ago
All Time
- Total issues: 6
- Total pull requests: 68
- Average time to close issues: 5 days
- Average time to close pull requests: 2 days
- Total issue authors: 2
- Total pull request authors: 3
- Average comments per issue: 1.67
- Average comments per pull request: 0.04
- Merged pull requests: 67
- Bot issues: 0
- Bot pull requests: 2
Past Year
- Issues: 4
- Pull requests: 14
- Average time to close issues: 1 day
- Average time to close pull requests: 12 days
- Issue authors: 1
- Pull request authors: 2
- Average comments per issue: 2.0
- Average comments per pull request: 0.21
- Merged pull requests: 13
- Bot issues: 0
- Bot pull requests: 2
Top Authors
Issue Authors
- majornista (2)
- frankelavsky (1)
Pull Request Authors
- frankelavsky (47)
- dependabot[bot] (2)
- domoritz (1)
Top Labels
Issue Labels
Pull Request Labels
Dependencies
- prettier ^2.6.2
- webpack ^5.72.0
- webpack-cli ^4.9.2
- 121 dependencies