https://github.com/coin-or/gimpy
A graph library containing pure Python implementations of a variety of graph algorithms
Science Score: 10.0%
This score indicates how likely this project is to be science-related based on various indicators:
-
○CITATION.cff file
-
○codemeta.json file
-
○.zenodo.json file
-
○DOI references
-
✓Academic publication links
Links to: zenodo.org -
○Academic email domains
-
○Institutional organization owner
-
○JOSS paper metadata
-
○Scientific vocabulary similarity
Low similarity (12.1%) to scientific vocabulary
Repository
A graph library containing pure Python implementations of a variety of graph algorithms
Basic Info
Statistics
- Stars: 34
- Watchers: 5
- Forks: 12
- Open Issues: 1
- Releases: 0
Metadata Files
README.md
GiMPy 2.1

Graph Methods in Python (GiMPy) is a Python graph library containing pure Python implementations of a variety of graph algorithms. The goal is clarity in implementation rather than eficiency. Most methods have an accompanying visualization and are thus appropriate for use in the classroom.
Documentation for the API is here:
https://coin-or.github.io/GiMPy
Pypi download page is here:
https://pypi.python.org/pypi/coinor.gimpy
Installation Notes
To install, do
pip install coinor.gimpy
In order for GiMPy to visualize the graphs it produces, it's necessary to install
GraphViz (Important: after installing
graphviz, you must add the graphviz bin directory, usually
C:\Program Files (x86)\Graphviz2.38\bin, to your PATH)
and choose one of these additional methods for display:
* Recommended: matplotlib and call
set_display_mode('matplotlib')
  * [Python Imaging Library](http://www.pythonware.com/products/pil/) and
callsetdisplaymode('PIL')
* Callsetdisplaymode('file')` to just write files to disk that have to
then be opened manually.
It is also possible to typeset labels in LaTex and to output the graph in
LaTex format using dot2tex. After installing dot2tex, this can be done
by simply calling the method write(basename='fileName', format='dot'), and
then doing dot2tex --tmath fileName.dot or by calling
set_display_mode('dot2tex') and then display() as usual. At the moment,
the latter only seems to work with version 2.9.0dev available
here. For the former method, just
using easy_install dot2tex should work fine.
Additional Notes for Windows Installation
- To install Graphviz, download the installer here. Important: after installing, you must manually add the graphviz
bindirectory (usuallyC:\Program Files (x86)\Graphviz2.38\bin) to yourPATH - If you want to use
xdot, there are some more requirements:- Unfortunately, you must have a 32-bit version of Python 2.7
- You must install the PyGtk version 2.22.6. Version 2.24 is buggy on Windows.
- To install
gnuplot, download the installer here. Note that the CYGWIN version of gnuplot may not work when called from Python.
Additional Notes for Linux Installation
- Graphviz can be installed as a package on most Linux distros, e.g.,
sudo apt-get install graphviz
Additional Notes for OS X Users
- The situation with Python on OS X is a bit of a mess. It is recommended to install python using homebrew with
brew install python). - With homebbrew, one can also easily install graphviz (
brew install graphviz).
Examples
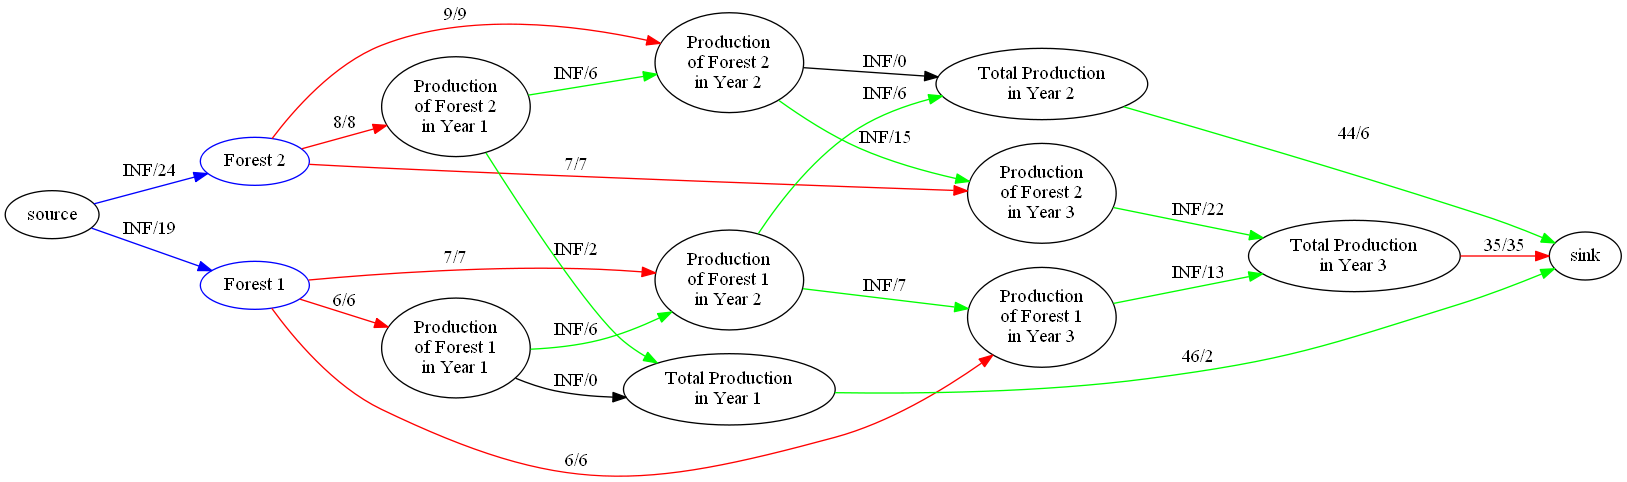
Forestry Model
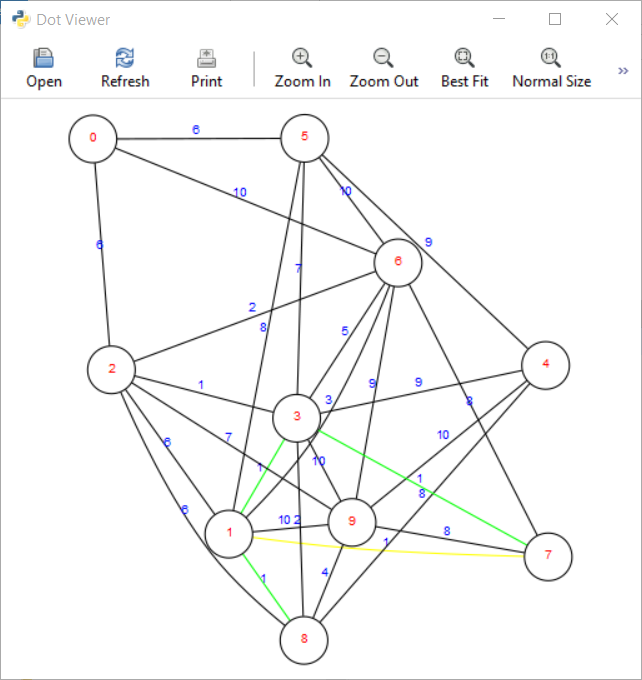
Display Window in XDot
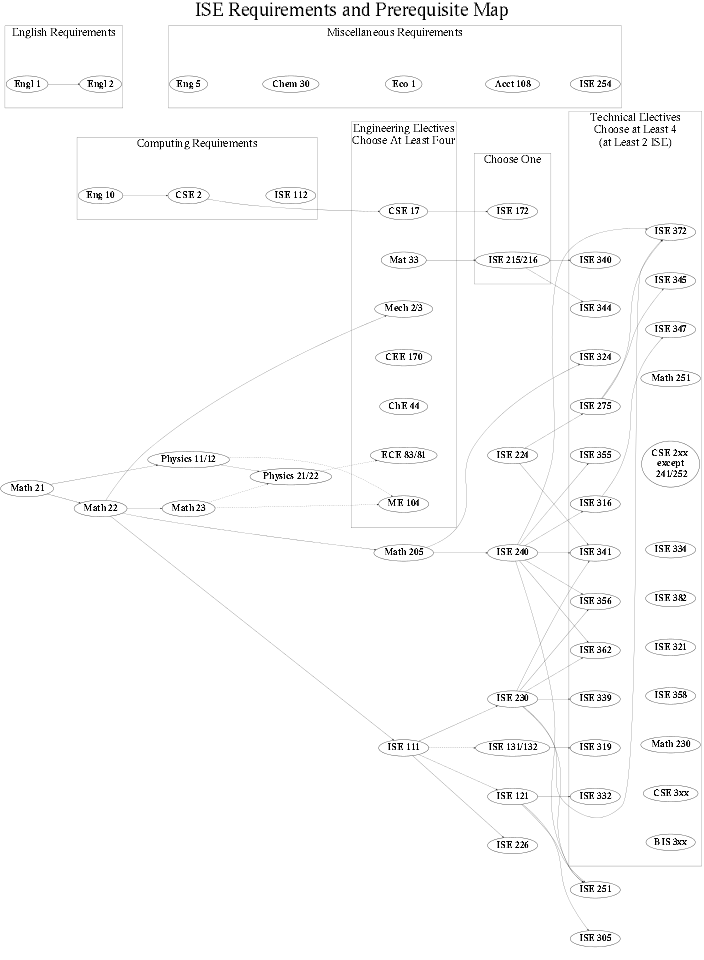
Lehigh ISE Prerequisite Graph
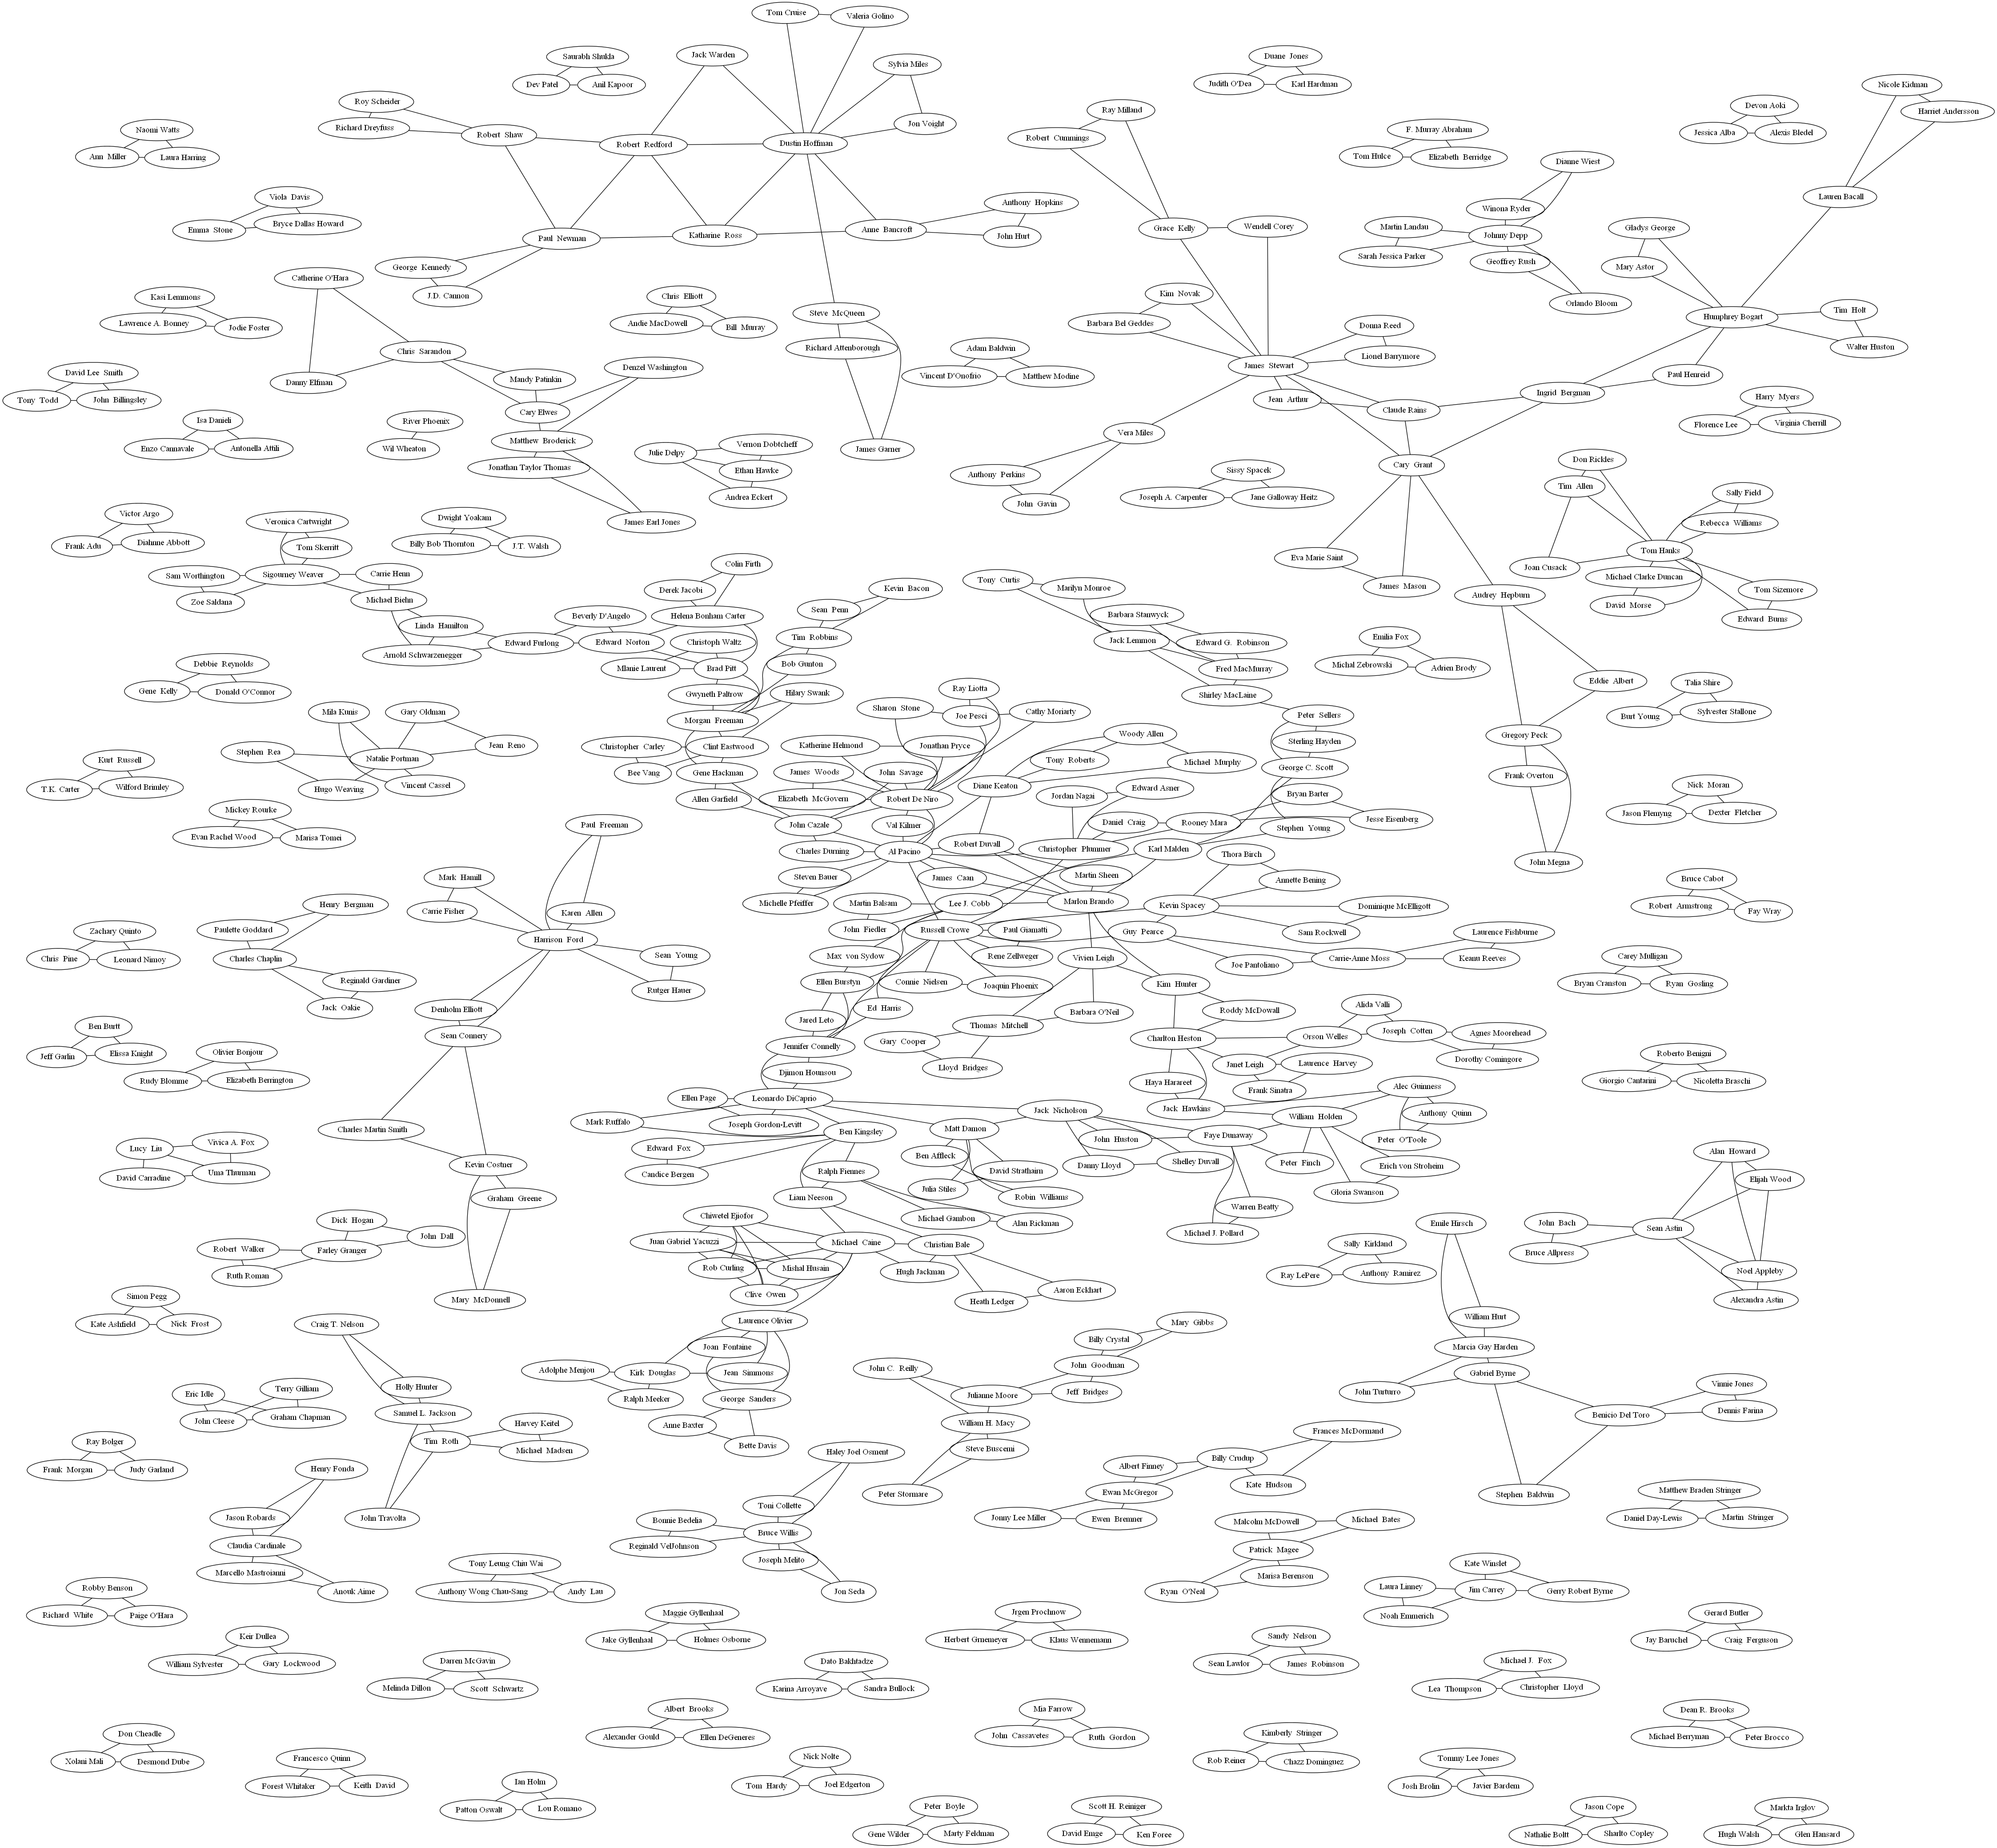
Graph of Actors Starring Together in Movies in IMDB
Branch and Bound Tree
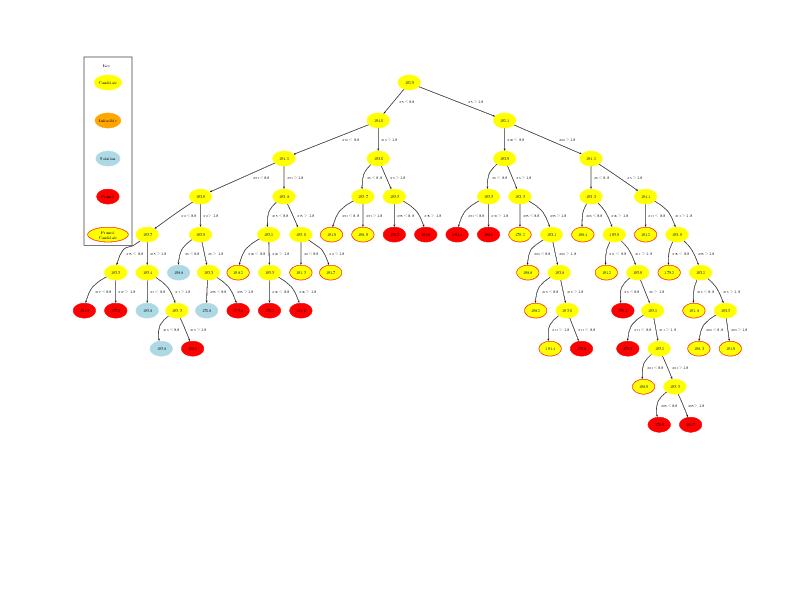
SAT Game Tree

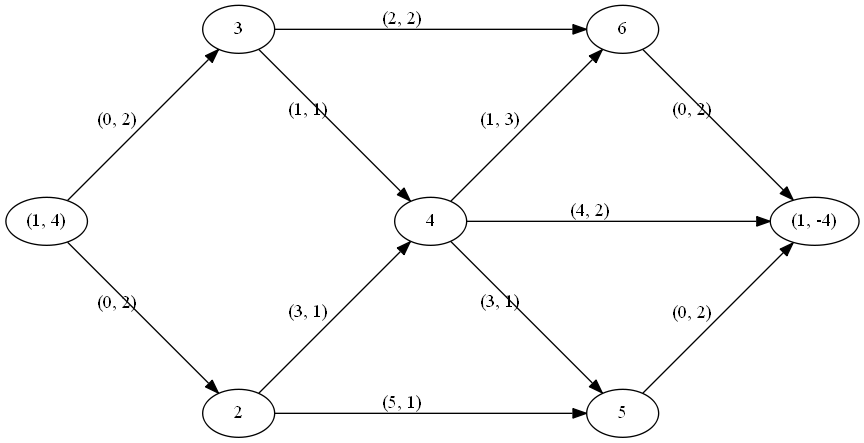
Flow Problem
Owner
- Name: COIN-OR Foundation
- Login: coin-or
- Kind: organization
- Email: info@coin-or.org
- Location: United States of America
- Website: https://www.coin-or.org
- Twitter: coin_or
- Repositories: 80
- Profile: https://github.com/coin-or
Computational Infrastructure for Operations Research.
GitHub Events
Total
- Issues event: 1
- Watch event: 1
- Push event: 1
Last Year
- Issues event: 1
- Watch event: 1
- Push event: 1
Issues and Pull Requests
Last synced: 12 months ago
All Time
- Total issues: 4
- Total pull requests: 4
- Average time to close issues: 2 months
- Average time to close pull requests: about 1 hour
- Total issue authors: 2
- Total pull request authors: 1
- Average comments per issue: 1.75
- Average comments per pull request: 0.0
- Merged pull requests: 0
- Bot issues: 0
- Bot pull requests: 0
Past Year
- Issues: 0
- Pull requests: 0
- Average time to close issues: N/A
- Average time to close pull requests: N/A
- Issue authors: 0
- Pull request authors: 0
- Average comments per issue: 0
- Average comments per pull request: 0
- Merged pull requests: 0
- Bot issues: 0
- Bot pull requests: 0
Top Authors
Issue Authors
- aykutbulut (3)
- gotakeoff (1)
- tkralphs (1)
Pull Request Authors
- tkralphs (4)
Top Labels
Issue Labels
Pull Request Labels
Packages
- Total packages: 1
-
Total downloads:
- pypi 317 last-month
- Total dependent packages: 1
- Total dependent repositories: 5
- Total versions: 30
- Total maintainers: 1
pypi.org: coinor.gimpy
Graph Methods in Python
- Homepage: https://github.com/coin-or/GiMPy/
- Documentation: https://coinor.gimpy.readthedocs.io/
- License: Eclipse Public License
-
Latest release: 2.1.1
published over 5 years ago