colocalvision
A GUI-based tool for ImageJ designed to streamline the colocalization analysis process for fluorescent microscopy images, including assisting masking & thresholding procedures for neuronal imaging
Science Score: 44.0%
This score indicates how likely this project is to be science-related based on various indicators:
-
✓CITATION.cff file
Found CITATION.cff file -
✓codemeta.json file
Found codemeta.json file -
✓.zenodo.json file
Found .zenodo.json file -
○DOI references
-
○Academic publication links
-
○Academic email domains
-
○Institutional organization owner
-
○JOSS paper metadata
-
○Scientific vocabulary similarity
Low similarity (12.4%) to scientific vocabulary
Repository
A GUI-based tool for ImageJ designed to streamline the colocalization analysis process for fluorescent microscopy images, including assisting masking & thresholding procedures for neuronal imaging
Basic Info
Statistics
- Stars: 0
- Watchers: 0
- Forks: 0
- Open Issues: 0
- Releases: 0
Metadata Files
README.md
ColocalVision
A GUI-based tool for ImageJ designed to streamline the colocalization analysis process for fluorescent microscopy images, by assisting masking & thresholding procedures, featuring automated thresholding, channel computations, masking operations, and more
To use:
(1) Set up a folder containing all of the images you want to include in your batch analysis.
(2) Run the BatchThresholdAnalysis.ijm script from the "Plugins > Run" tab at the ImageJ menu.
(3) The user interface will pop up. Select your preferences and click “Run.”
(4) The script will automatically prompt you to select your target input folder.
(5) After you have selected an input folder, click through the default BioFormat settings every time the prompt pops up (this is the options window that loads every time you open a file in ImageJ). This step aside, the script will automate the rest of the image processing.
(6) Once the script's done running, it will prompt you to save the resulting threshold value table as a .csv or .tsv file to load into Excel later. You can choose to close this prompt if you don't want to save it. Either way, the values will also show up in a separate tabulated window in ImageJ. You can also save it as a spreadsheet file directly from this window.
(7) Open the specific cropped image that you want to analyze. Run the AnalyzeImage.ijm script from "Plugins > Run" at the ImageJ menu.
(8) The user interface will pop up. Input the average threshold values (general practice for decimal values is to round up to the nearest integer) for each channel. Adjust the other parameters as needed. Click “Run.”
(9) The script will automatically perform the thresholding and produce the measurements/data/results in tables. You can save the tables as a spreadsheet compatible with Excel.
Batch Processing Auto-Threshold Analysis Script Notes:
- This script is used to calculate the average threshold values produced by autothresholding of a large batch of image files. These values can be calculated using a variety of autothreshold algorithms of differing signal sensitivity, which can be selected according to the user’s specific needs. These averaged threshold values for each channel are then displayed in a custom ImageJ table and also automatically saved as a .csv/.tsv/Excel file. These values can be inputted into the colocalization analysis script, with the goal of enabling greater consistency across image analyses.
- When run, the script will prompt the user to select a target folder containing their image files, as well as a destination folder to store their saved threshold values.
- Channel names can again be customized for the purpose of convenience, if different signals or microscope settings are used. By default, these are set to “MAP2” in Channel 1, “TAU” in Channel 2, “BAI2” in Channel 3, and “PICCOLO” in Channel 4, having been designed with the BAI2 mixed co-culture experiment in mind.
- The script again offers the option of using maximum intensity Z-stack projections, which compresses all Z-slices in a channel into a single composite image on the basis of max intensity across the full range of Z-slices in a single image channel. Here, the autothreshold values will be calculated using Z-slices if the option is enabled, and should be selected if the user plans on using Z-projections in their colocalization analysis.
- There are a number of autothresholding algorithms that the user can select from. The selected algorithm will be used on all image files in the user-selected folder. The default option is ImageJ’s “Default” method, which happens to be a variation of the IsoData algorithm that seemingly reflects a balance between signal sensitivity and noise filtration capcity. Users may experiment with the results of different algorithms to determine which best suits their needs.
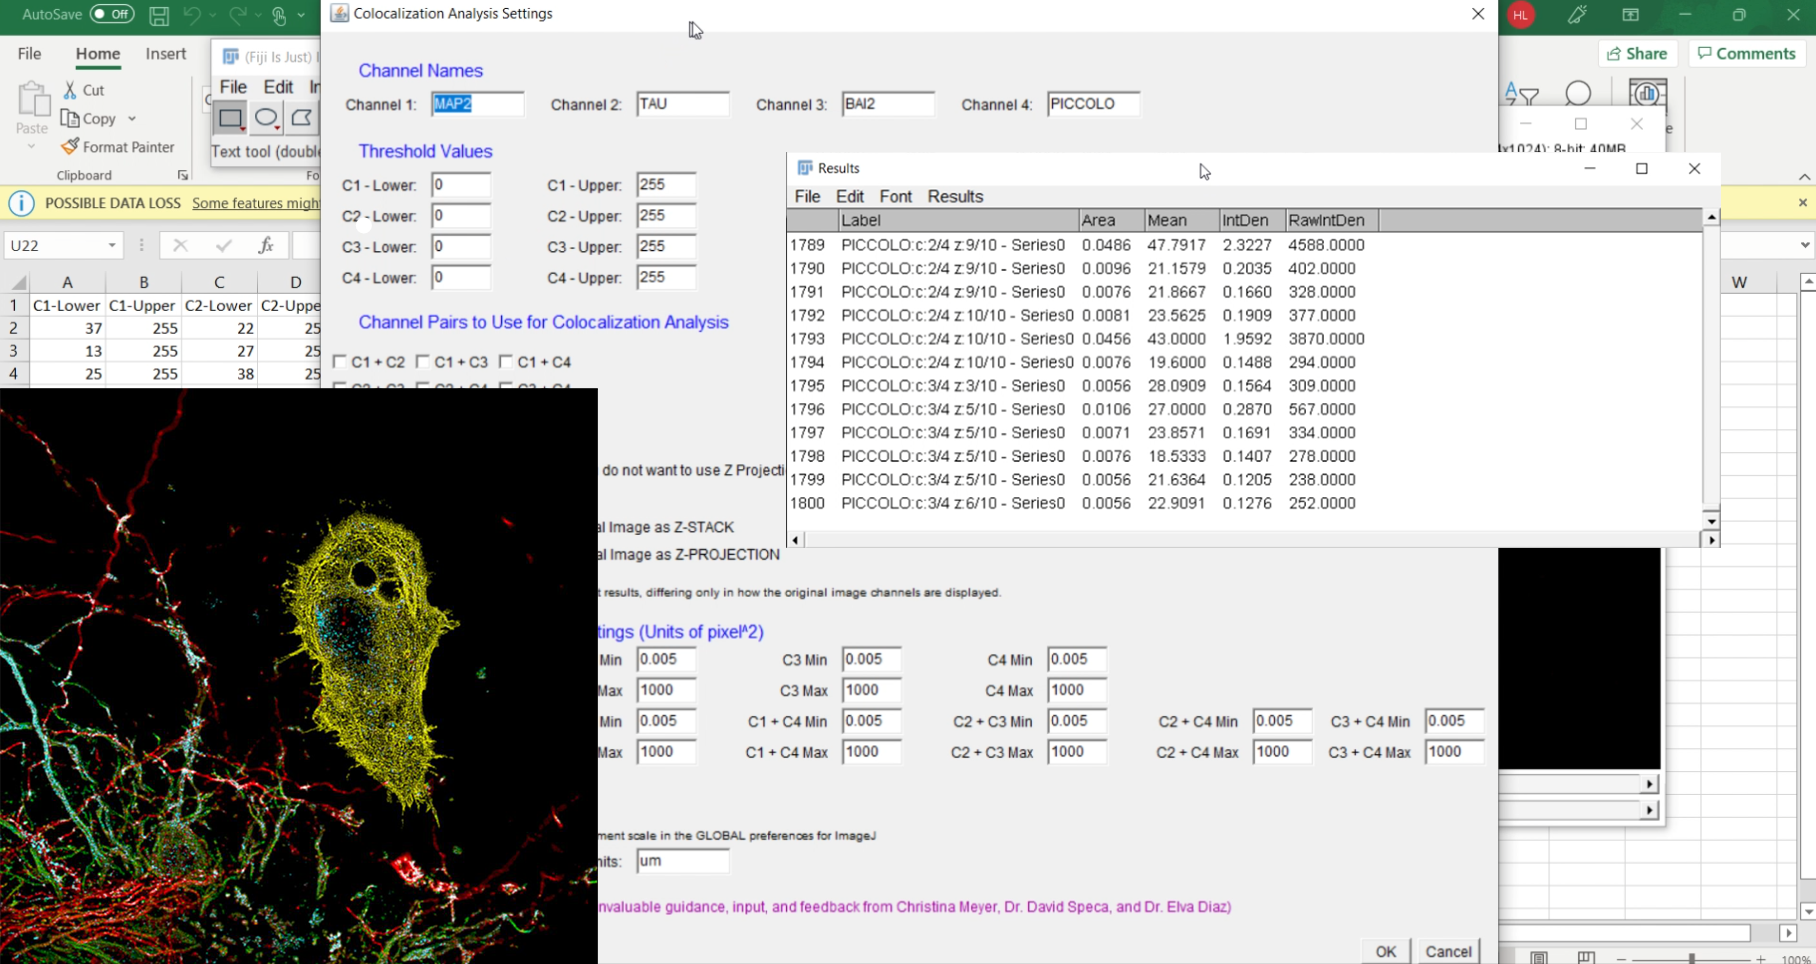
Colocalization Analysis Script Notes:
- This script is used to perform colocalization analysis and particle measurements on a single image file at a time. It automatically creates binary masks using user-inputted thresholds, combines the desired pairs of masks, and analyzes the resulting concatenated binary images, measuring the count, size, and density of detected particles.
- Channel names can be customized if different signals or microscope settings are used. By default, these are set to “MAP2” in Channel 1, “TAU” in Channel 2, “BAI2” in Channel 3, and “PICCOLO” in Channel 4, having been designed with the BAI2 mixed co-culture experiment in mind.
- Threshold values can be directly inputed into the user interface. These values are provided by the Batch Processing Auto-Threshold Analysis script, which calculates averaged optimal threshold ranges based on the set of images that the user would like to include in the analysis.
- The user can specify which pairs channels to include in the colocalization analysis.
- The script offers the option of using maximum intensity Z-stack projections, which compresses all Z-slices in a channel into a single composite image on the basis of max intensity across the range of Z-slices. If using the Z-projection method, the user can choose whether to view the original non-thresholded image channels either as a regular Z-stack or as a Z-projection. With either one of these options thought, the thresholded masks will be created using Z-projections.
- The user can specify the minimum and maximum particle size to be measured during analysis for each channel and possible combination of channels. By default, these are set to 0.005 and 1000 (extremely large), respectively, in units of pixels2.
- The measurement scale can also be set, which by default is set to 1 pixel = 0.0225 um (1 um = 22.5 pixels) in the script. Note that this configures the global setting for measurement scale in ImageJ, so one should readjust the setting accordingly if they are performing other analyses outside of the script using different measurement scales.
Owner
- Name: BAI2Synapse
- Login: BAI2Synapse
- Kind: organization
- Repositories: 1
- Profile: https://github.com/BAI2Synapse
Citation (CITATION.cff)
cff-version: 1.2.0
message: "If you use this software, please cite it as below."
authors:
- family-names: "Low"
  given-names: "Henry"
  orcid: "https://orcid.org/0009-0000-2348-9791"
title: "ColocalVision: An Automated Image Analysis Tool for Evaluating Colocalization in Fluorescent Microscopy Images"
version: 1.0
doi: 10.5281/zenodo.8173501
date-released: 8-1-2021
url: "https://github.com/henrylowgh/ColocalVision/"
GitHub Events
Total
- Push event: 8
- Create event: 4
Last Year
- Push event: 8
- Create event: 4