https://github.com/fanchengyan/eomaps
A library to create interactive maps of geographical datasets
Science Score: 23.0%
This score indicates how likely this project is to be science-related based on various indicators:
-
○CITATION.cff file
-
○codemeta.json file
-
○.zenodo.json file
-
✓DOI references
Found 8 DOI reference(s) in README -
✓Academic publication links
Links to: zenodo.org -
○Academic email domains
-
○Institutional organization owner
-
○JOSS paper metadata
-
○Scientific vocabulary similarity
Low similarity (13.8%) to scientific vocabulary
Last synced: 8 months ago
·
JSON representation
Repository
A library to create interactive maps of geographical datasets
Basic Info
- Host: GitHub
- Owner: Fanchengyan
- License: bsd-3-clause
- Language: Python
- Default Branch: master
- Homepage: https://eomaps.readthedocs.io/
- Size: 95 MB
Statistics
- Stars: 0
- Watchers: 0
- Forks: 0
- Open Issues: 0
- Releases: 0
Fork of raphaelquast/EOmaps
Created almost 2 years ago
· Last pushed over 1 year ago
https://github.com/Fanchengyan/EOmaps/blob/master/
 | Tests & Review | [](https://github.com/raphaelquast/EOmaps/actions/workflows/testMaps.yml) | [](https://codecov.io/gh/raphaelquast/EOmaps) | [](https://github.com/pyOpenSci/software-submission/issues/138) | | :---------------------: | :------------------------------------------------------------------------------------------------------------------------------------------------------------------------------: | :-----------------------------------------------------------------------------------------------------------------: | :---------------------------------------------------------------------------------------------------------------------------------------------: | | Package & Documentation | [](https://pypi.org/project/eomaps/) | [](https://anaconda.org/conda-forge/eomaps) | [](https://eomaps.readthedocs.io/en/latest/?badge=latest) | | License & Citation | [](https://github.com/raphaelquast/EOmaps/blob/master/LICENSE) | [](https://zenodo.org/badge/latestdoi/410829039) | |
| Tests & Review | [](https://github.com/raphaelquast/EOmaps/actions/workflows/testMaps.yml) | [](https://codecov.io/gh/raphaelquast/EOmaps) | [](https://github.com/pyOpenSci/software-submission/issues/138) | | :---------------------: | :------------------------------------------------------------------------------------------------------------------------------------------------------------------------------: | :-----------------------------------------------------------------------------------------------------------------: | :---------------------------------------------------------------------------------------------------------------------------------------------: | | Package & Documentation | [](https://pypi.org/project/eomaps/) | [](https://anaconda.org/conda-forge/eomaps) | [](https://eomaps.readthedocs.io/en/latest/?badge=latest) | | License & Citation | [](https://github.com/raphaelquast/EOmaps/blob/master/LICENSE) | [](https://zenodo.org/badge/latestdoi/410829039) | |
----
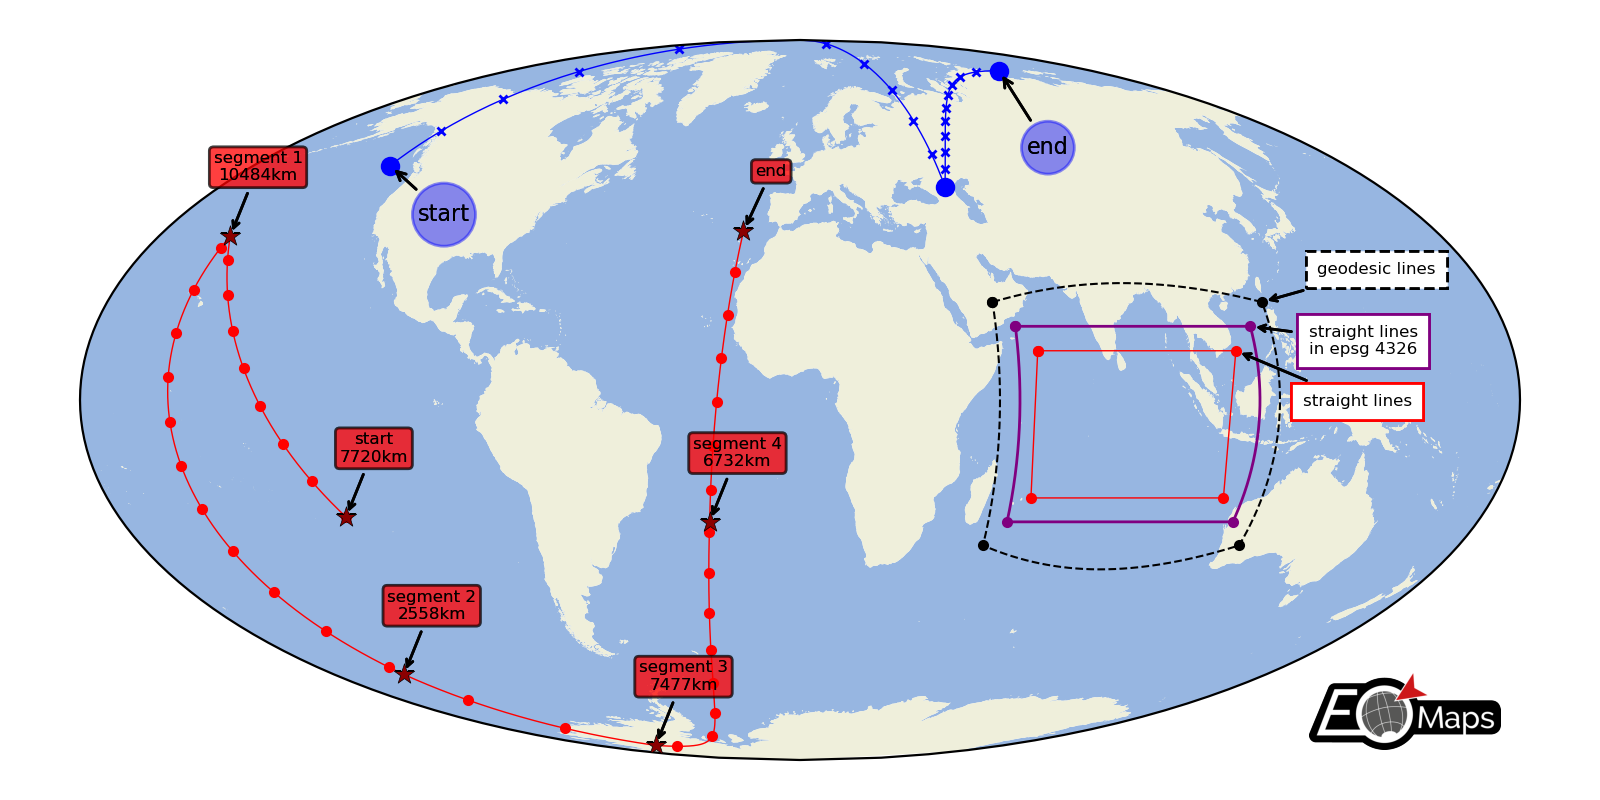
A python package to visualize and analyze geographical datasets.
| EOmaps aims to provide a comprehensive, flexible, well-documented and easy-to-use API to create publication-ready maps that can directly be used for interactive data analysis. |
>
> The following BibTeX entry uses a DOI that always points to the latest release of EOmaps!
> (You can get the DOI for a specific version form the zenodo-page) > > ```bibtex > @software{eomaps, > author = {Raphael Quast}, > title = {EOmaps: A python package to visualize and analyze geographical datasets.}, > doi = {10.5281/zenodo.6459598}, > url = {https://doi.org/10.5281/zenodo.6459598} > } > ``` > >
>
## Getting started
Head over to the start-page of the Documentation to get an overview of all available features and functionalities!
> [!TIP]
> For a quick hands-on introduction, checkout this article on dev.to:
> [Geographic data visualization and analysis with EOmaps: Interactive maps in python!](https://dev.to/raphaelquast/geographic-data-visualization-and-analysis-with-eomaps-interactive-maps-in-python-48e1)
## Installation
To install **EOmaps** (and all its dependencies) with the [conda](https://docs.conda.io/projects/conda/en/stable/) package-manager, simply use:
```python
conda install -c conda-forge eomaps
```
> [!TIP]
> To get a **huge speedup**, use [mamba](https://mamba.readthedocs.io/en/latest/) to solve the dependencies!
> ```python
> mamba install -c conda-forge eomaps
> ```
> Advanced users can also use `pip` to install **EOmaps** (and selectively install optional dependency groups)
> ```pyhton
> pip install eomaps # install only minimal required dependencies
> pip install eomaps[all] # install all optional dependencies
> ...
> ```
For more detailes, have a look at the [Installation Instructions](https://eomaps.readthedocs.io/en/dev/installation.html) or the quickstart guide ["From 0 to EOmaps"](https://eomaps.readthedocs.io/en/dev/quickstart_quide.html#quickstart-guide)!
## Contribute
Interested in contributing to EOmaps? **Awesome!**
You can find detailed instructions on how to setup EOmaps for development in the [Contribution Guide](https://eomaps.readthedocs.io/en/dev/contribute/contribute.html)!
> Found a bug or got an idea for an interesting feature?
> Open an [issue](https://github.com/raphaelquast/EOmaps/issues) or start a [discussion](https://github.com/raphaelquast/EOmaps/discussions), and I'll see what I can do!
---------------
BibTeX
>> The following BibTeX entry uses a DOI that always points to the latest release of EOmaps!
> (You can get the DOI for a specific version form the zenodo-page) > > ```bibtex > @software{eomaps, > author = {Raphael Quast}, > title = {EOmaps: A python package to visualize and analyze geographical datasets.}, > doi = {10.5281/zenodo.6459598}, > url = {https://doi.org/10.5281/zenodo.6459598} > } > ``` > >
|
|

|

|
|
|

|
|

|
|

|
|

|
## Thanks to - [Jakob Quast](https://quastquest.jimdofree.com/) for designing the nice logo!
Owner
- Name: Fanchengyan
- Login: Fanchengyan
- Kind: user
- Repositories: 12
- Profile: https://github.com/Fanchengyan
GitHub Events
Total
- Push event: 1
Last Year
- Push event: 1