Optimising Light Source Positioning for Even and Flux-Efficient Illumination
Optimising Light Source Positioning for Even and Flux-Efficient Illumination - Published in JOSS (2019)
https://github.com/adrena-lab/optimising-light-source-positioning
Science Score: 93.0%
This score indicates how likely this project is to be science-related based on various indicators:
-
○CITATION.cff file
-
✓codemeta.json file
Found codemeta.json file -
✓.zenodo.json file
Found .zenodo.json file -
✓DOI references
Found 1 DOI reference(s) in JOSS metadata -
○Academic publication links
-
○Committers with academic emails
-
○Institutional organization owner
-
✓JOSS paper metadata
Published in Journal of Open Source Software
Repository
'Optimising Light Source Positioning for Even and Intense Illumination
Basic Info
Statistics
- Stars: 0
- Watchers: 0
- Forks: 1
- Open Issues: 0
- Releases: 1
Metadata Files
README.md
Optimising Light Source Positioning for Even and Flux-Efficient Illumination
Statement of Need
Designing imaging systems is a challenge faced by researchers in many fields. For example, many studies require optical set-ups with uniform illumination for data acquisition which must be rapidly assembled and optimised to meet the needs of each experiment. Similarly, when prototyping new pieces of equipment with imaging systems, the lighting must be carefully designed. Non-uniform illumination can contribute to low quality data, particularly so when illumination variation approaches or exceeds the sensitivity range of the capture device. Furthermore, low flux efficiency may negatively impact the reliability of the data and subsequent analysis.
This software is aimed at researchers who are optimising equipment for any application, from fluorescence measurements to image analysis, which require even and flux-efficient illumination. The code can be easily adjusted to model a variety of light source configurations and rapidly calculates results for many thousands of possible arrangements. This will significantly reduce the resources required to design an effective lighting system.
Dependencies
This software was designed for Matlab R2018a (Version 9.4) and requires the following toolboxes:
- Image Processing Toolbox
- Statistics and Machine Learning Toolbox
- Parallel Computing Toolbox
- MATLAB Distributed Computing Server
Installation Instructions
In order to install and run this software the following files must be downloaded and saved to the same folder:
- OptimisingLightSource_Positioning.m
- CreateVariableCombinations.m
- ExcludeUnallowedCombinations.m
- FarFieldData.mat
- Illumination_Calculations.m
- ConvhullOptionReduction.m
- PlotSaveResults.m
Function Descriptions
Complete help blocks for each function have been provided which explicitly define the input and output of each function. Below, we provide a more general overview of the function of each file.
OptimisingLightSource_Positioning.m
This is the main script file for the software. In this file, the user provides the required information for each of the following functions. This includes, but is not limited to, the ranges for each positional variable, details regarding the imaging system specifications such as the size of the illuminated area and the position of the camera, and the tolerances for selecting the most viable configurations. Documentation within this file advises the user where to change the code to adapt it to their specific needs.
CreateVariableCombinations.m
The position of the light source is defined in Cartesian coordinates relative to the centre of the illuminated area. Further to this, a range of allowed angles of illumination in Polar coordinates (theta and phi) relative to the surface normal must be provided by the user. The user provides limits and resolution for each of these variables in the main function file. CreateVariableCombinations.m then takes this information and generates a matrix of all possible positional configurations.
ExcludeUnallowedCombinations.m
The function ExcludeUnallowedCombinations.m works to exclude positional configurations that are unfeasible. The code is currently written such that any positional configuration that will block the field of view of the imaging device will be eliminated. Furthermore, any configuration in which the principle axis of the light source does not intersect with the illuminated area (as defined by the user in the ExcludeUnallowedCombinations.m) are deemed unsuitable and removed from the matrix of positional configurations.
FarFieldData.mat
In order to calculate the illumination profile, the far field data for the light source is required. This is usually provided by the manufacturer. The data should be presented as a two column matrix where the first column is the angle (in degrees ranging from -90 to 90) from the principle axis and the second column is the relative intensity. The data should be saved as FarFieldData.mat or the name of the variable should be modified in the main function file.
Illumination_Calculations.m
Illimination_Calculations.m uses the far field data as well as user provided values to calculate the illumination profile for the light sources in each positional configuration. In the main function file, the user must provide the name of the variable containing the far field data as well as the size of the illuminated area. Additionally, the user provides the x and y resolution which defines the coarseness of the grid as well as the area over which the flux is calculated. The position of the camera must also be provided. This function file assumes that there are four identical light sources positioned across two lines of symmetry. This can be adjusted as needed.
ConvhullOptionReduction.m
ConvhullOptionReduction.m uses a modified convex hull operation to reduce the full matrix of positional configurations to only the most viable by using two figures of merit: the total flux and the standard deviation. The user can decide to use absolute standard deviation or standard deviation as a percentage of the mean flux. As standard deviation is not necessarily a perfect descriptor for uniformity, additional data points may be of interest. Therefore, the user can provide tolerance values for both total radiant flux and standard deviation to broaden the domain of selected configurations.
PlotSaveResults.m
To visualise the illumination profile of the remaining positional configurations, PlotSaveResults.m will provide a colormap representing illumination profile and the relative positions of the light sources. It will also provide the positional information of the light source, the total flux, and the standard deviation of the flux.
Contribution Guidelines
To report bugs or seek support please open an issue on this repository. Contributions to the software are welcome; please open an issue for further discussion.
Example Usage & Automated Test
A system is being designed to image thin layer chromatography (TLC) plates which are 100 x 80mm in size. The imaging device is to be placed at the centre of the system at a height of 110mm. The maximum dimensions of the system are 200 x 160mm. Four LED light sources are available which will be placed around the system across two axes of symmetry. It is desired to determine the optimal position of the light sources to provide even illumination while maintaining sufficient flux to achieve high quality images. Running the software as is should produce the same results as this example.
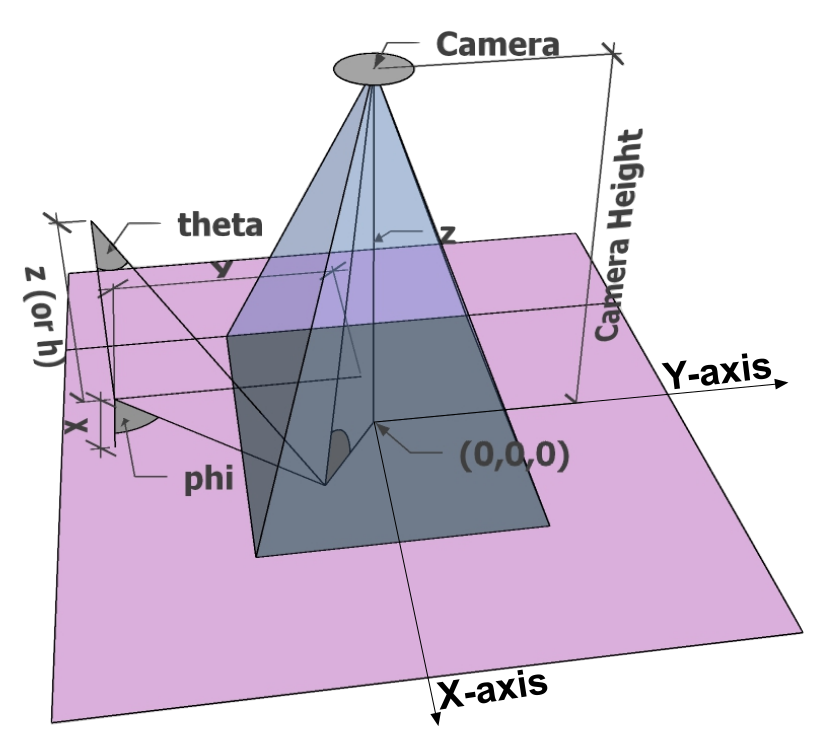
Figure 1: Schematic illustrating the placement of the light source relative to the illuminated area with all relevant variables.
To reduce the computing time, a coarse investigation of the positional configurations was performed first.
Step 1
In OptimisingLightSource_Positioning.m, the following limits and resolutions were provided for each variable. Note: The centre of the system should lie at the (0,0,0) point in the Cartesian coordinate system.
``` %Theta, enter in degrees thetarangeinterval = 30; thetarangelowerlimit = 0; thetarangeupperlimit = 90;
%Phi, enter in degrees phirangeinterval = 30; phirangelowerlimit = 0; phirangeupperlimit = 90;
%X-Position xinterval = 30; xlowerlimit = -100; xupper_limit = -10;
%Y-Position yinterval = 20; ylowerlimit = -80; yupper_limit = -10;
%Height above illuminated surface (z-position) Hinterval = 25; Hlowerlimit = 10; Hupperlimit = 110; ``` CreateVariable_Combinations.m uses this information and will produce 1280 possible configurations; however, not all of these are practical.
Step 2
In step 2, the impractical configurations are removed from consideration. There exists a rectangular pyramid wherein the placement of a light source would obstruct the view from the imaging device. The vertices of this pyramid correspond to the vertices of the area being imaged and the position of the imaging device. These are provided in ExcludeUnallowedCombinations.m.
%Vertices of the domain (rectangle) being imaged
V1 = [-50, -40,   0];
V2 = [-50,  40,   0];
V3 = [ 50,  40,   0];
V4 = [ 50, -40,   0];
%Position of the imaging device
V5 = [  0,   0, 110];
The software then determines if any of the combinations lie within this pyramid and excludes them from further consideration. To further reduce the computational time, any configuration in which the principle axis of the light source does not intersect the illuminated area can be excluded. The user provides the vertices of the illuminated area (which may be different from the region being imaged) and ExcludeUnallowedCombinations.m removes these configurations. Subsequently, only 260 feasible combinations remain for investigation.
Step 3
Next the software will calculated the illumination profile for each configuration. In the main function file (OptimisingLightSource_Positioning.m) the user provides the far field data as well as the limits for the area of interest along with a resolution for the x and y directions and the position of the camera.
``` Xlimit = 50; XResolution = 1; Ylimit = 40; YResolution = 1;
%Camera Position Camera_Position = [0, 0, 110]; ```
As the width of the TLC plate is 100 x 80 mm the region of interest will extend from -50 to 50 mm along the x-axis and from -40 to 40 mm along the y-axis. A resolution of 1 mm was chosen; therefore, the flux will be calculated for 1 mm2. The resulting structure, Illumination_Data contains the values for each variable along with the associated total flux, standard deviation, and standard deviation as a percentage of the mean flux.
Step 4
In order to choose an optimal illumination configuration, the set of all parameter combinations must be filtered down according to specific figures of merit. Within this step, we provide a method for the user to refine their data set. Our code uses a modified convex hull method to select configurations which maximize total flux for a given standard deviation.
The descriptors used to determine how strong and uniform the illumination is are total flux and standard deviation respectively. Standard deviation is provided both as an absolute value and as a percentage of the mean flux. The user may select which will be more suitable for their optimisation
For absolute standard deviation the StdDevSelector value should be 1; for the standard deviation as a percentage of the mean flux it should be 0.
As total flux and standard deviation (as an absolute value or a percentage of the mean flux) are not perfect descriptors for the system, it may be necessary to reduce the constraints of the data filter. Tolerance values for these figures of merit are here specified by the user.
Std_Dev_Selector = 1;
Total_Flux_Tolerance = 5*10^-6;
Standard_Deviation_Tolerance = 10^-8;
This process further reduces the number of viable configurations from 260 to 26 as shown in Figure 2.
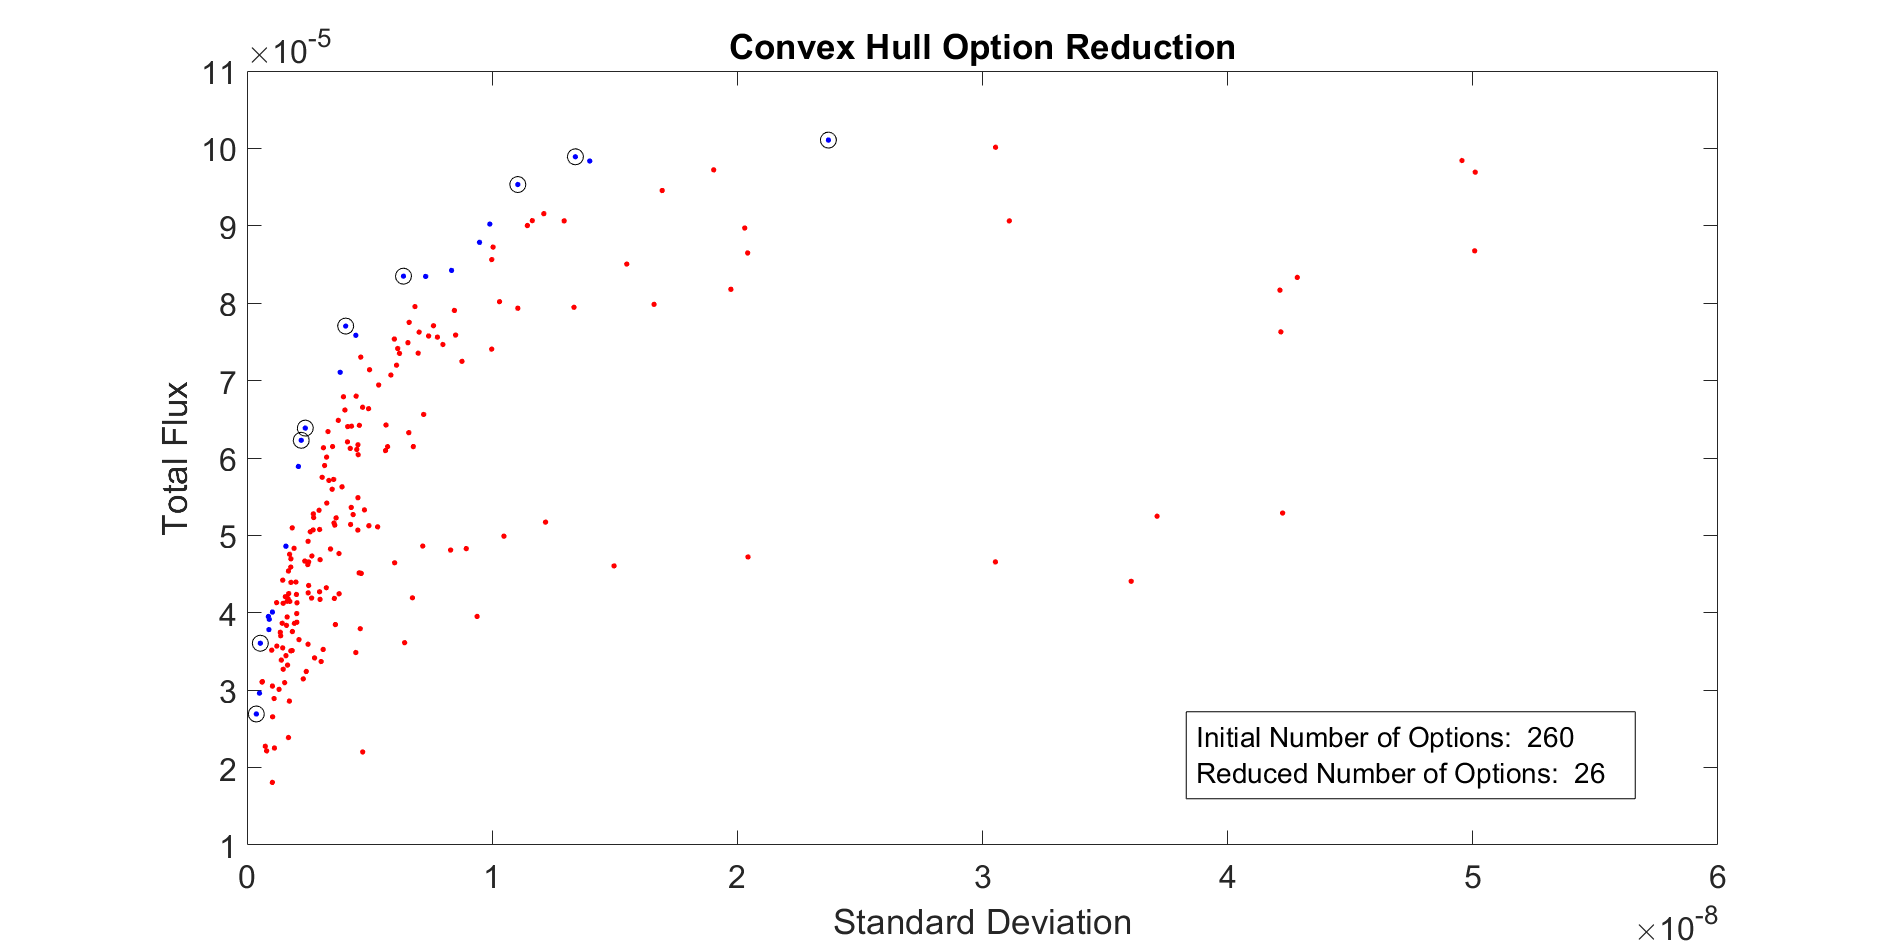 Figure 2: The figures of merit, total flux and illumination variation (standard deviation), define the axes against which every parameter-combination is mapped (forming a cloud). The modified convex hull (boundary) of the candidate population is shown in blue and circled. The values which have been selected based on the user provided tolerances are shown in blue.
Step 5
The remaining options provided after the modified convhull method was applied can be further reduced based upon user restrictions for minimum total flux or maximum standard deviation. Furthermore, these final configurations are few enough in number to be plotted without requiring undue computational resources and evaluated by the user. Examples of these illumination profiles are shown in Figure 3.
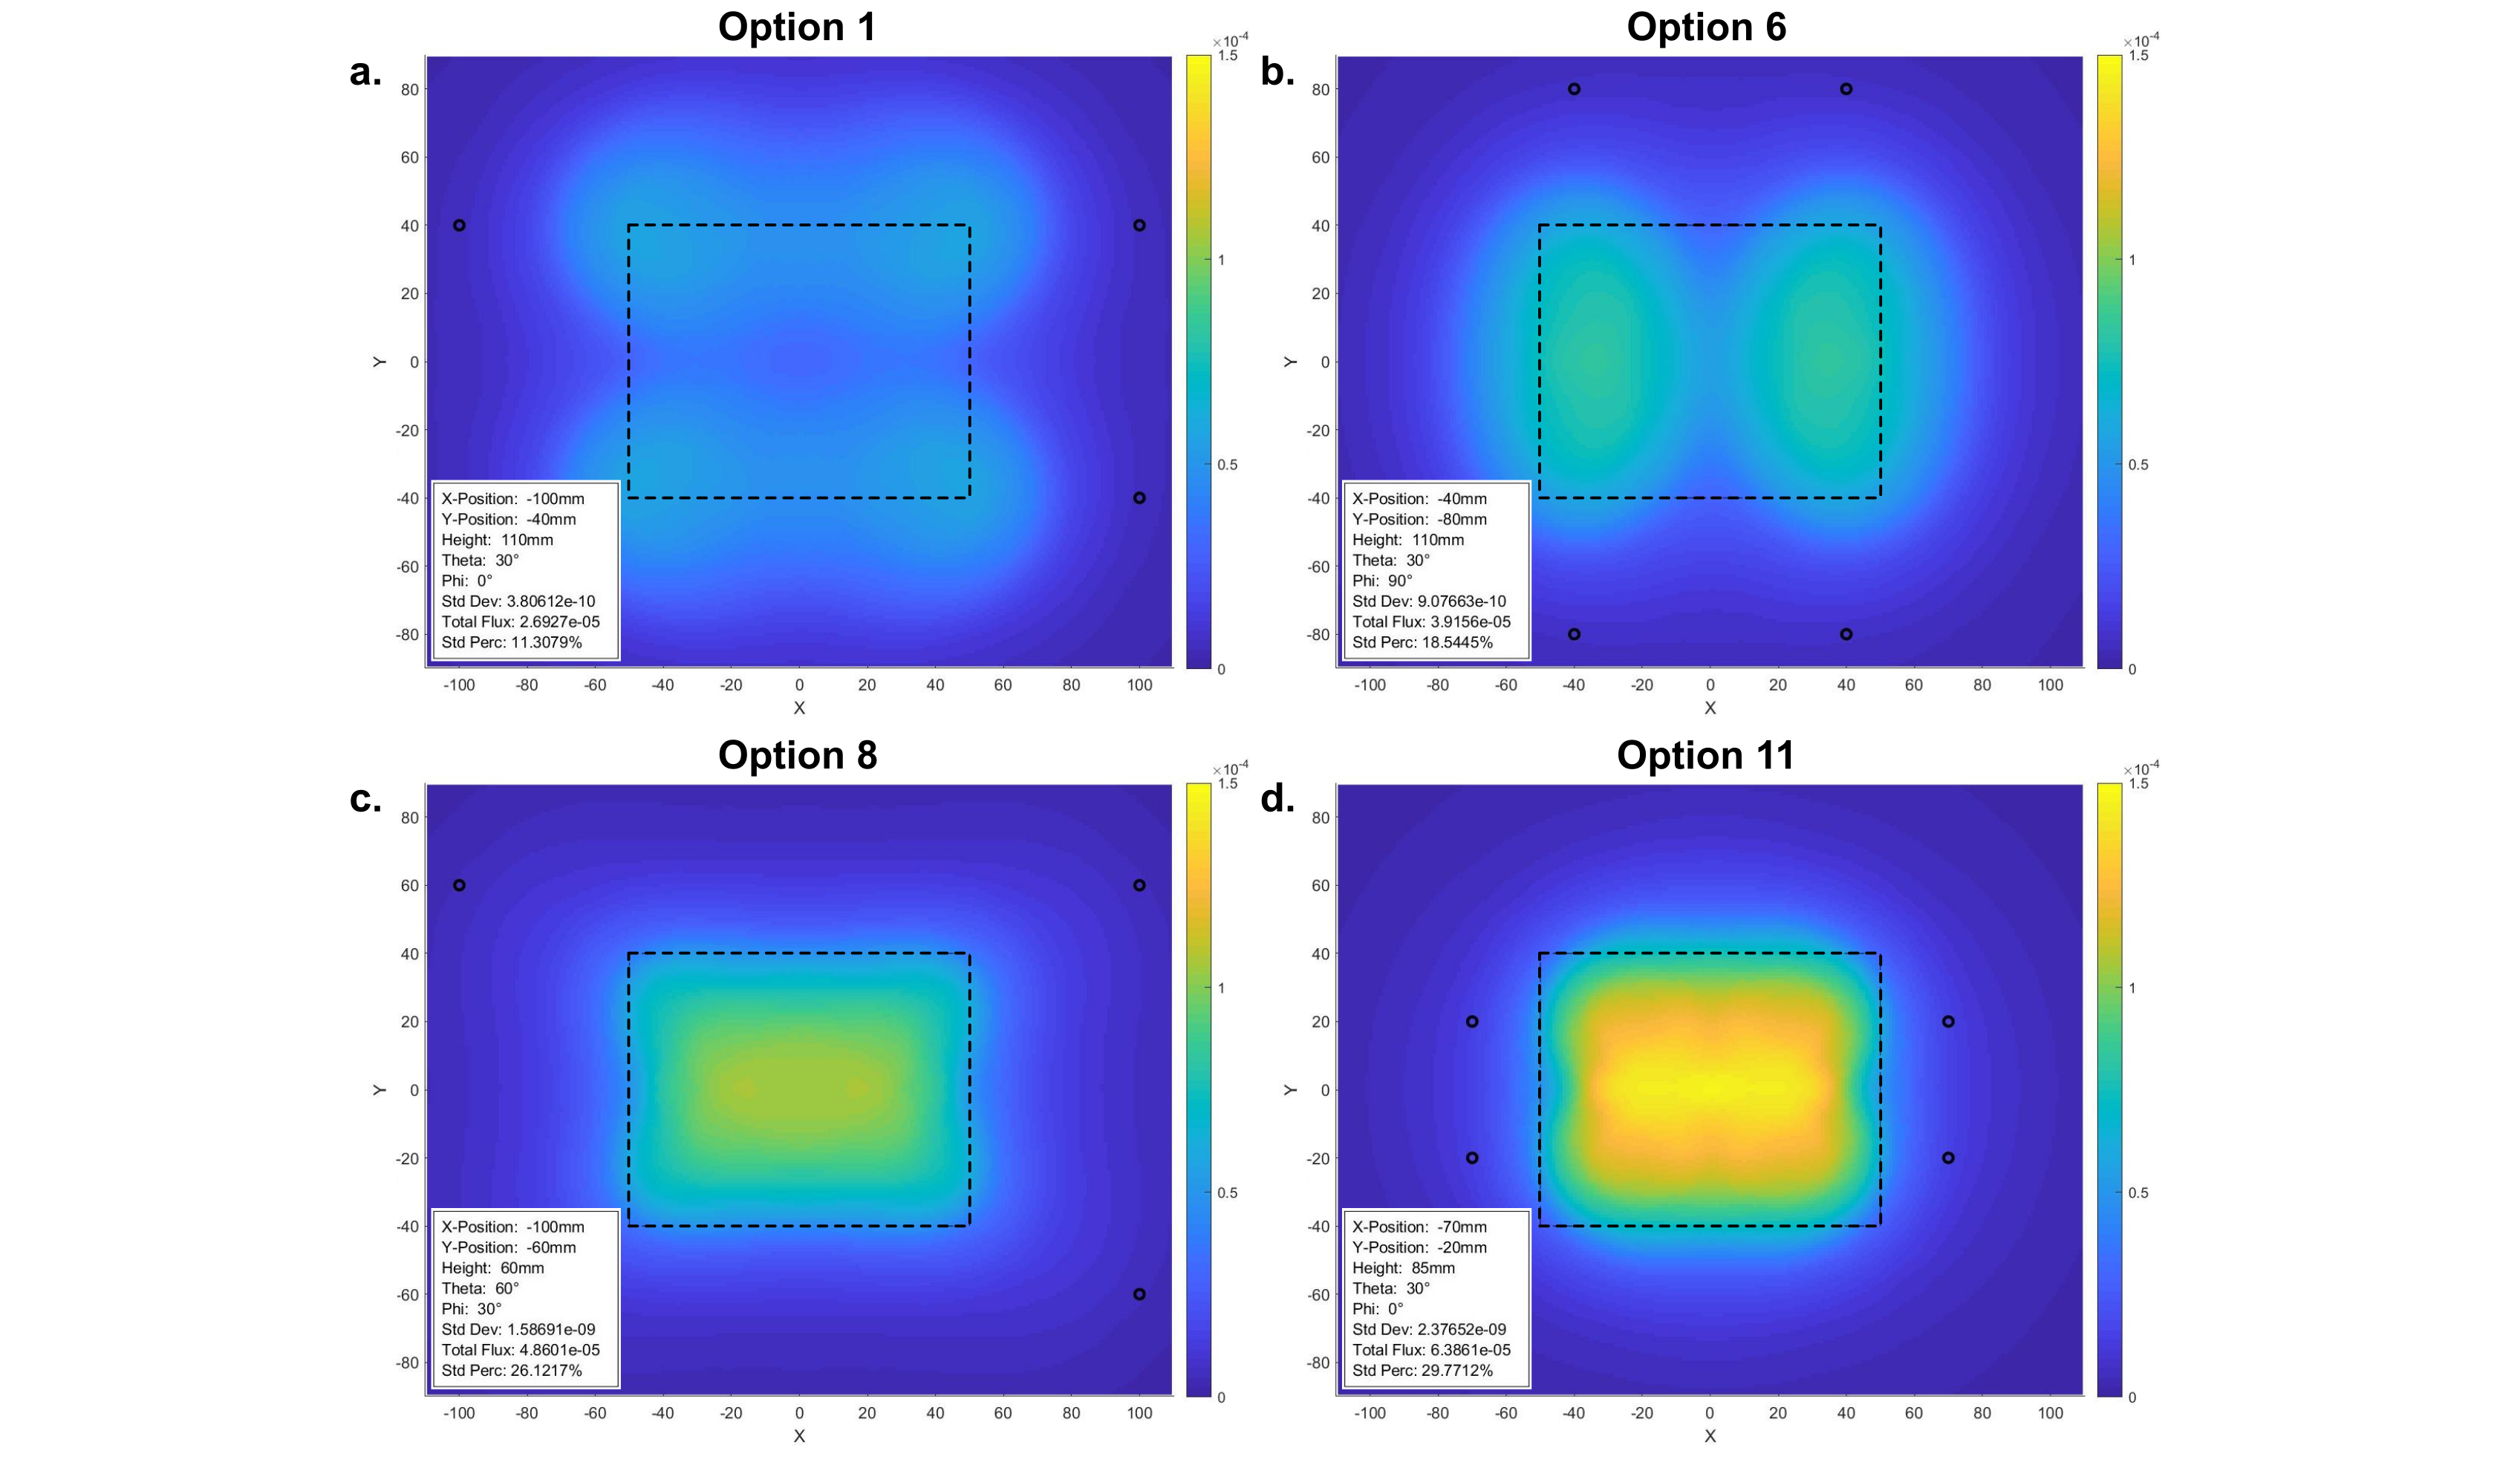 Figure 3: Illumination profiles for systems with four active light sources denoted by the black circles on the plot. The details of the variable values for these light sources are summarized in a legend on the bottom left of the plot. These plots represent configuration options 1, 6, 8, & 11.
The configuration options shown in Figure 3 show increasing standard deviation and total flux from a to b. Option 8 appeared to provide a good balance between flux efficiency and uniformity. Therefore, a more in depth analysis could be performed in the vicinity of the light source positions in option 8.
Owner
- Name: Adaptive and Responsive Nanomaterials (AdReNa) lab
- Login: AdReNa-lab
- Kind: organization
- Location: London, UK
- Twitter: AdReNa_Lab
- Repositories: 2
- Profile: https://github.com/AdReNa-lab
JOSS Publication
Optimising Light Source Positioning for Even and Flux-Efficient Illumination
Authors

Department of Chemical Engineering, University College London, Torrington Place, London WC1E 7JE, U.K.
Department of Chemical Engineering, University College London, Torrington Place, London WC1E 7JE, U.K.
Department of Chemical Engineering, University College London, Torrington Place, London WC1E 7JE, U.K.
Editor
Tania Allard
Tags
Even Illumination Modelling IlluminationGitHub Events
Total
- Fork event: 1
Last Year
- Fork event: 1
Issues and Pull Requests
Last synced: 11 months ago
All Time
- Total issues: 1
- Total pull requests: 0
- Average time to close issues: 4 months
- Average time to close pull requests: N/A
- Total issue authors: 1
- Total pull request authors: 0
- Average comments per issue: 1.0
- Average comments per pull request: 0
- Merged pull requests: 0
- Bot issues: 0
- Bot pull requests: 0
Past Year
- Issues: 0
- Pull requests: 0
- Average time to close issues: N/A
- Average time to close pull requests: N/A
- Issue authors: 0
- Pull request authors: 0
- Average comments per issue: 0
- Average comments per pull request: 0
- Merged pull requests: 0
- Bot issues: 0
- Bot pull requests: 0
Top Authors
Issue Authors
- trallard (1)