Science Score: 44.0%
This score indicates how likely this project is to be science-related based on various indicators:
-
✓CITATION.cff file
Found CITATION.cff file -
✓codemeta.json file
Found codemeta.json file -
✓.zenodo.json file
Found .zenodo.json file -
○DOI references
-
○Academic publication links
-
○Academic email domains
-
○Institutional organization owner
-
○JOSS paper metadata
-
○Scientific vocabulary similarity
Low similarity (9.4%) to scientific vocabulary
Repository
R package of the ANR-Itineris
Basic Info
- Host: GitHub
- Owner: zoometh
- License: cc-by-4.0
- Language: HTML
- Default Branch: main
- Size: 9.04 MB
Statistics
- Stars: 0
- Watchers: 1
- Forks: 1
- Open Issues: 0
- Releases: 0
Metadata Files
README.md
itineRis 
R package developed for statistical analysis isotops developped in the frame of the ANR-Itineris![]()
Install and load package
Install the R package
devtools::install_github("zoometh/itineRis")
And load it
library(itineRis)
By default, output will be saved in the results/ folder. You can change the output folder by changing the dirOut option in the various functions.
Correspondence Analysis
Run the isotop_ca() function to compute Correspondence Analysis (CA)
isotop_ca(col.group = "Provenienza",
          pt_siz = 2,
          lbl.size = 3)
The user can select 3 or more variables that appears both in the dataset and in the reference thesaurus. The latter gathers lists of elements (Cu, Ar, ...), chemical compounds (SiO2, TiO2, ...), or isotopes.
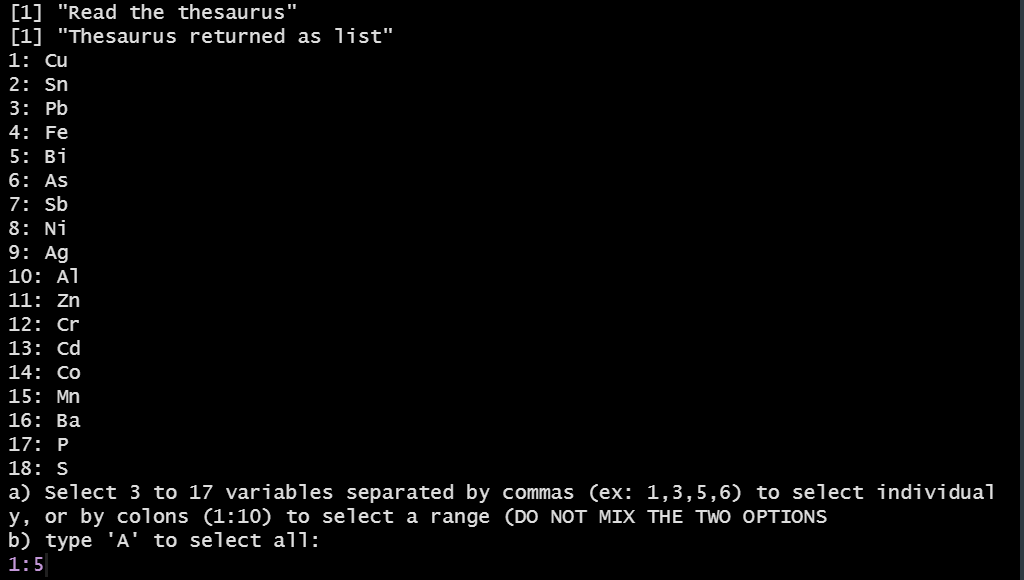
Selection of variables (elements)
The result will is:
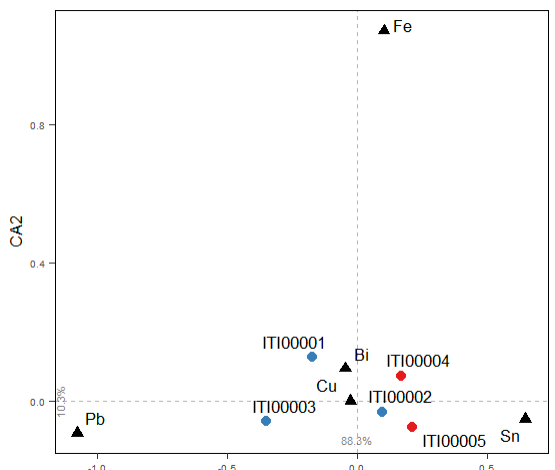
CA on elements
interactive ternary plot of LIA
Create an interactive ternary plot, with plotly, to visualise the results of lead isotopic analysis (LIA)
Create an hash object to store
d <- hash::hash()
Read the LIA measures for objects and mines
d <- read_lia(d = d,
              d.tag = "lia.objects",
              df.path = "C:/Rprojects/itineRis/results/LIA data objects.xlsx",
              header.line = 2)
d <- read_lia(d = d,
              d.tag = "lia.mines",
              pattern.objects.num = "Locality/.Mine",
              pattern.objects.Pb206_Pb204 = "206Pb/204Pb",
              pattern.objects.Pb207_Pb204 = "207Pb/204Pb",
              pattern.objects.Pb208_Pb204 = "208Pb/204Pb",
              df.path = "C:/Rprojects/itineRis/results/Coordinates-mines_Thomas Huet.xlsx",
              header.line = 1)
Group the datasets, assign colors and symbols
``` library(dplyr)
mydf <- rbind(d$lia.mines, d$lia.objects) df.isotop <- isotop_dataframe(df = mydf, df.path = NA) df.isotop[df.isotop$object == "golasecca", "color.object"] <- "#0000FF" df.isotop[df.isotop$object == "hochdorf", "color.object"] <- "#00FFFF" df.isotop[df.isotop$object == "France", "color.object"] <- "#FF0000" df.isotop[df.isotop$object == "France", "symbol"] <- "triangle" df.isotop[df.isotop$object == "Iberian Peninsula", "color.object"] <- "#FFA500" df.isotop[df.isotop$object == "Iberian Peninsula", "symbol"] <- "triangle" df.isotop[df.isotop$object == "Switzerland", "color.object"] <- "#964B00" df.isotop[df.isotop$object == "Switzerland", "symbol"] <- "triangle" ```
Create a ternary plot
isotop_ternaryplot(df.isotop)
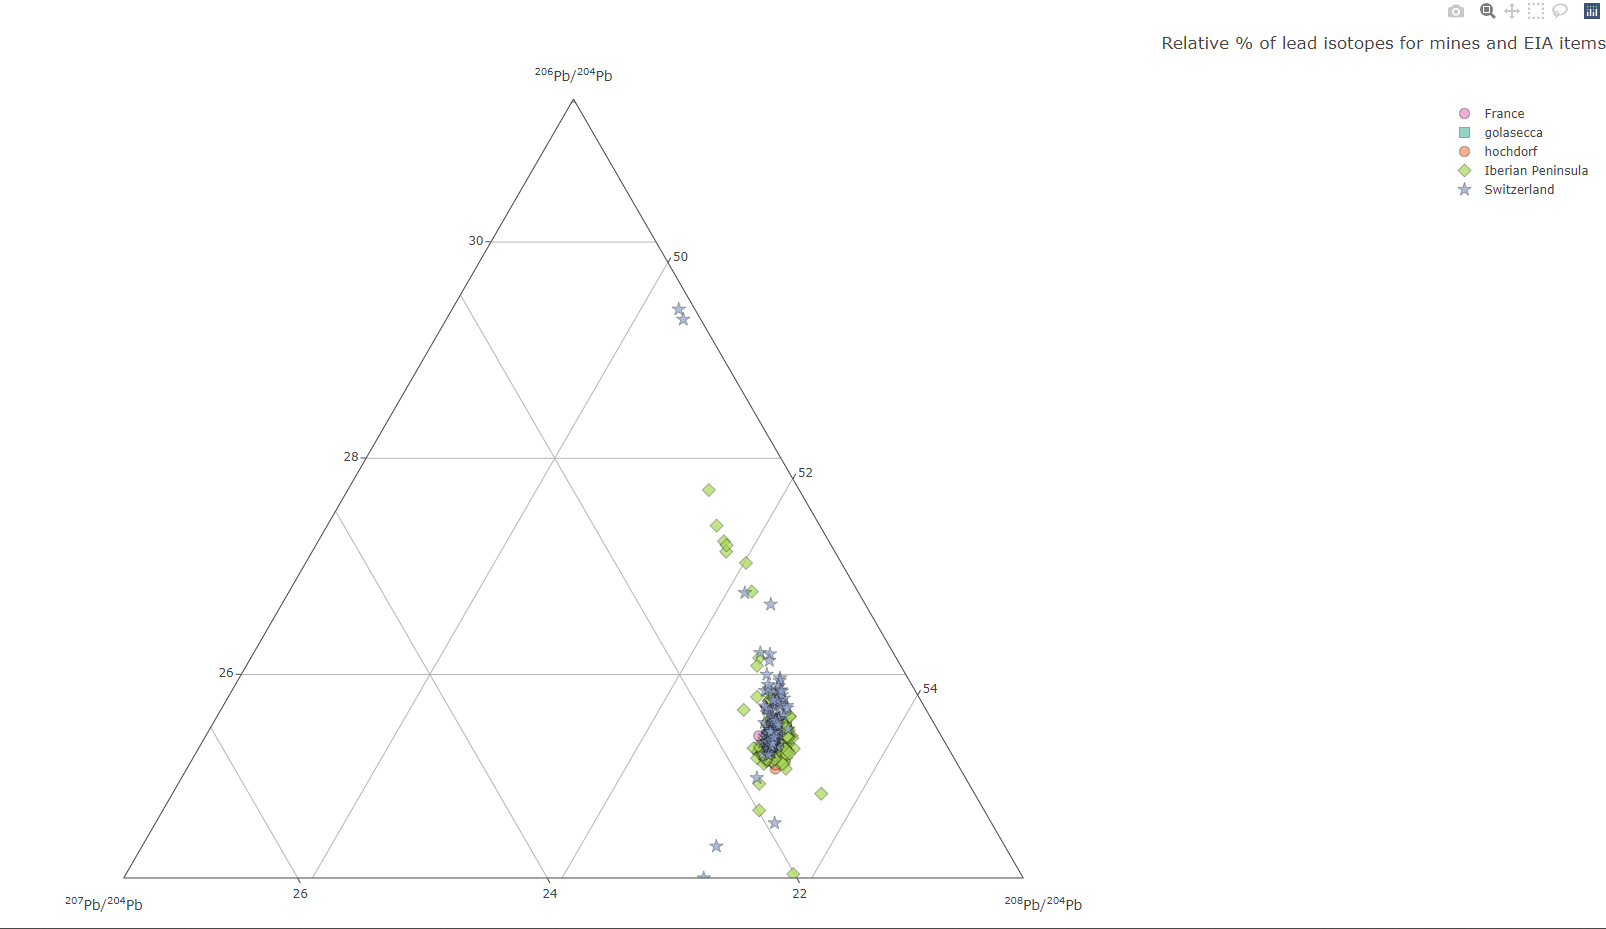
landing page of the interactive Plotly plot
In Shiny
A similar function is hosted on a Shiny Server: http://shinyserver.cfs.unipi.it:3838/teach/stats/stats/dim3/

landing page of the interactive Shiny ternary plot
The parameters (objects, mines, kmeans) can be selected with the input box:
objects: categories of objects (by defaultgolaseccaorhordorf)mines: mines' countries (by defaultFrance,Iberian Peninsula, orSwitzerland)kmeans: number of Kmeans[^1] centers, or clusters (by default between1to5)

input selection
Use the Zoom tool to select a region of interest in the graph (to zoom out, double click).

Zoom in
The Zoom tool, the Span tool and the Hover info allow you to view the results sample by sample.

hover info for the sample `4230_08` allocated to the cluster `1`
Each sample is tagged with the number of the Kmeans cluster to which it belongs.
Interactive map of mines
Create an interactive leaflet map of mines
d <- hash::hash()
d <- read_mines(d = d,
                df.path = "C:/Rprojects/itineRis/results/Coordinates-mines_Thomas Huet.xlsx")
map_leaflet(d = d,
            d.coords = "mines.coords",
            export.plot = T,
            out.plot = "map_sites.html",
            dirOut = "C:/Rdev-itineris/itineris/data/")
Gives:
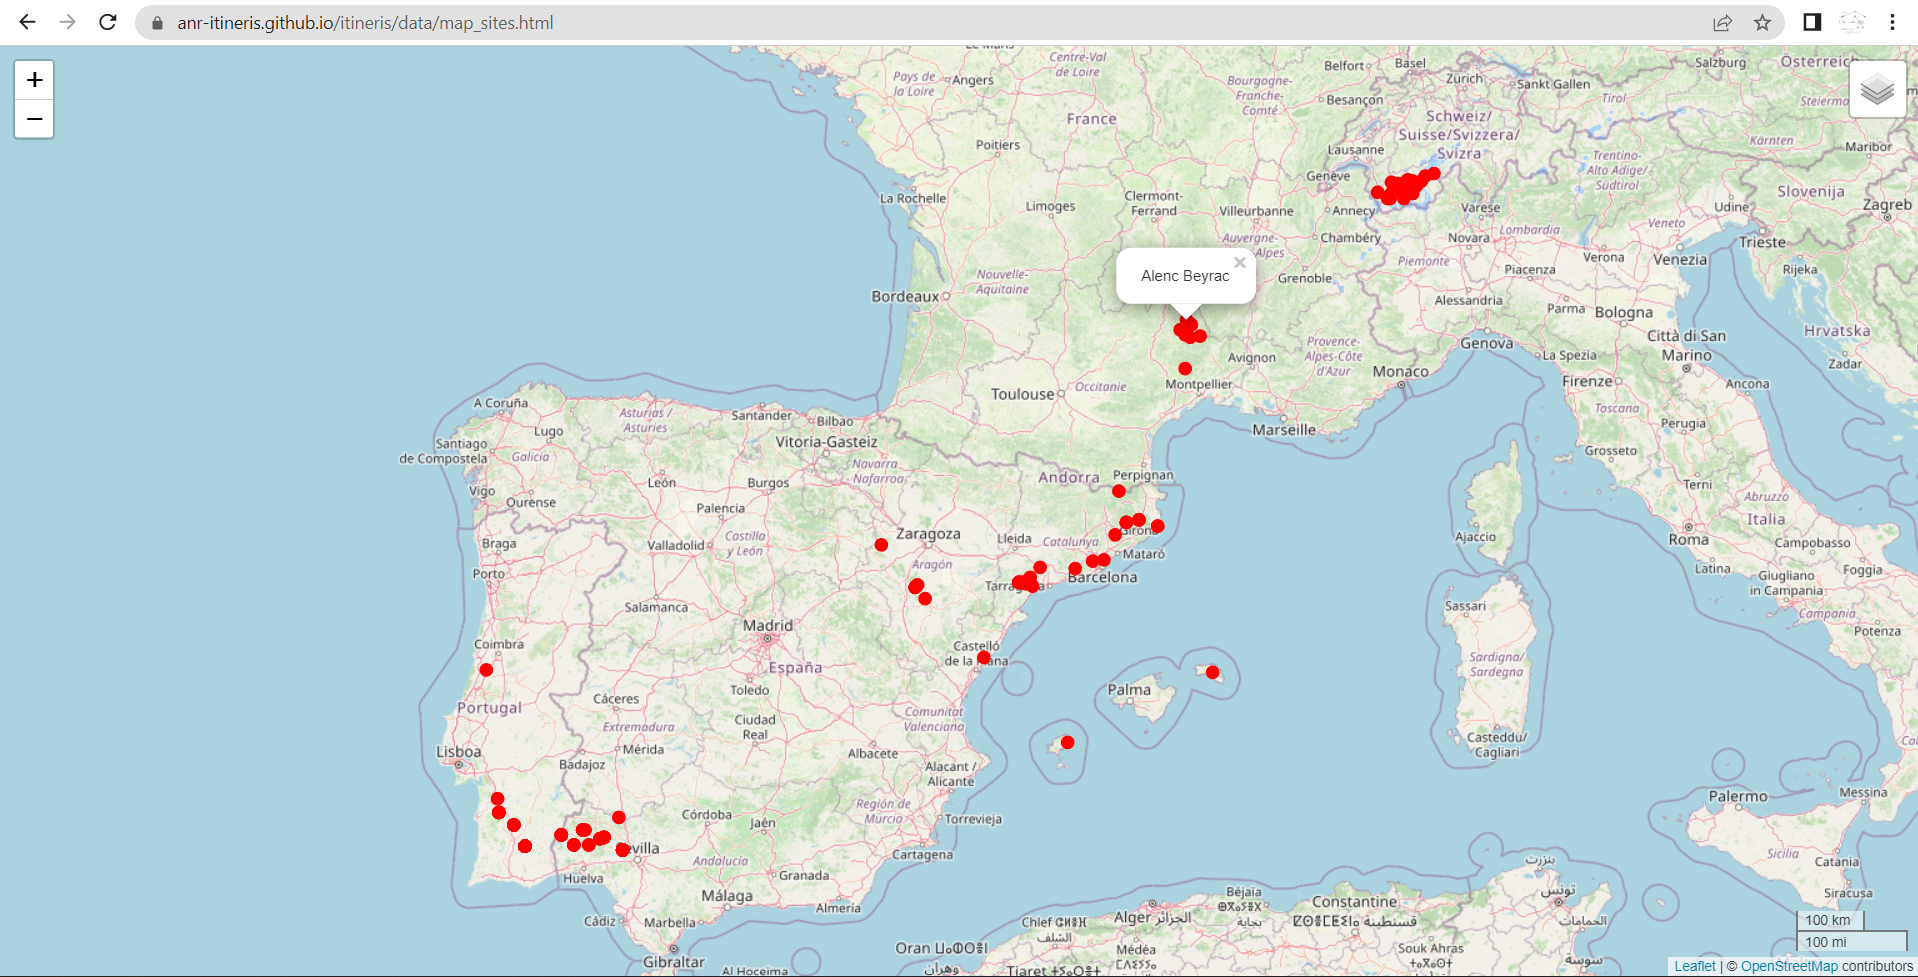
https://zoometh.github.io/itineRis/results/map_sites.html
Thesaurus
The function thesaurus() creates interactive graphs to display the thesaurus of the project
thes <- "https://raw.githubusercontent.com/ANR-Itineris/itineris/main/lod/thesaurus/Itineris_th101.rdf"
thesaurus(root = "artefact",
          outPlot = "collapsibleTree",
          export.plot = T,
          outDir = "C:/Rprojects/itineRis/results/")
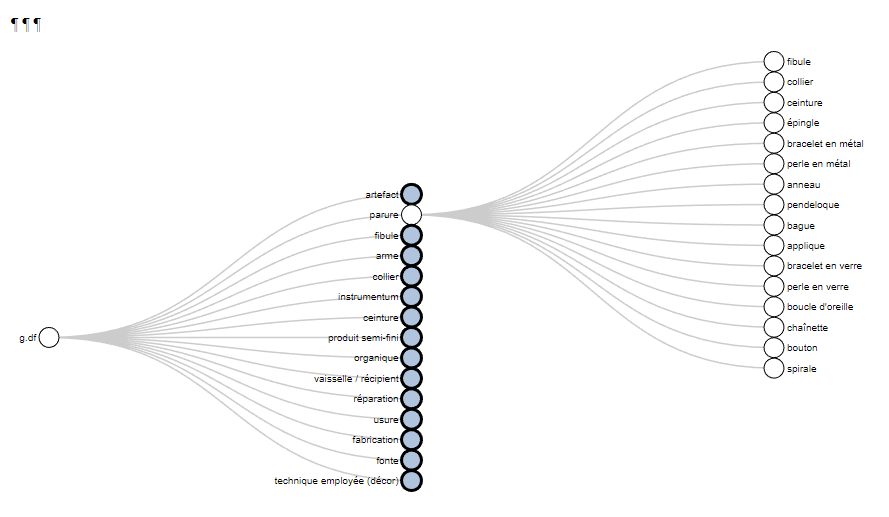
https://zoometh.github.io/itineRis/results/artefact
[^1]: the Kmeans (R function kmeans()) is run on the selected objects and mines. It tags every sample with the number of its cluster ()
Owner
- Name: Thomas Huet
- Login: zoometh
- Kind: user
- Location: 2 South Parks Road, Oxford OX1 3TG
- Company: University of Oxford
- Website: https://tinyurl.com/zoometh
- Repositories: 7
- Profile: https://github.com/zoometh
Prehistory and Computational Archaeology
Citation (citation.cff)
cff-version: 1.0.0
message: "If you use this software, please cite it as below."
authors:
- family-names: "Huet"
  given-names: "Thomas"
  orcid: "https://orcid.org/0000-0002-1112-6122"
title: "ItineRis"
version: 0.0.0.9000
doi:
date-released:
url: "https://github.com/zoometh/itineRis"
GitHub Events
Total
- Fork event: 1
Last Year
- Fork event: 1
Dependencies
- DescTools * imports
- dplyr * imports
- htmlwidgets * imports
- plotly * imports
- knitr * suggests
- rmarkdown * suggests