dasymetric-toolbox-arcgispro
Science Score: 57.0%
This score indicates how likely this project is to be science-related based on various indicators:
-
✓CITATION.cff file
Found CITATION.cff file -
✓codemeta.json file
Found codemeta.json file -
✓.zenodo.json file
Found .zenodo.json file -
✓DOI references
Found 4 DOI reference(s) in README -
○Academic publication links
-
○Committers with academic emails
-
○Institutional organization owner
-
○JOSS paper metadata
-
○Scientific vocabulary similarity
Low similarity (12.0%) to scientific vocabulary
Keywords
Repository
Statistics
- Stars: 9
- Watchers: 6
- Forks: 5
- Open Issues: 2
- Releases: 1
Topics
Metadata Files
README.md
Intelligent Dasymetric Toolbox for ArcGIS Pro
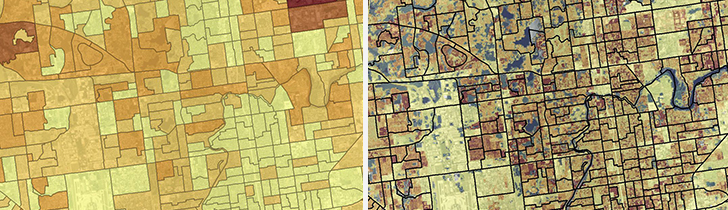
![]()
Following the methods described in Baynes, J., Neale, A., & Hultgren, T. (2022), EPA developed the Intelligent Dasymetric Mapping (IDM) toolbox for ArcGIS Pro and a corresponding toolbox that uses open source GIS packages.
Overview
The US Census Bureau aggregates population counts into various units (e.g., blocks, block groups, tracts) that are bounded by both visible features such as roads and streams, as well as invisible boundaries such as county or state limits. While this aggregation is practical for the purposes of the Census, it is difficult to determine how many individuals within a census block live near roads, in floodplains, or other potential risk exposures using these boundaries. This is particularly true in sparsely populated areas with large census blocks.
Dasymetric mapping is a geospatial technique that uses information such as land cover to distribute population counts within selected boundaries like census blocks. EPA researchers use dasymetric population data to calculate the distribution of ecosystem services, model viewsheds, estimate resource use, and measure exposure potential.
IDM uses a representative population density for each ancillary class (e.g., land cover type) to distribute population counts from source units (e.g., census blocks). The representative population density of an ancillary class is the number of people per grid cell that are expected to reside in the ancillary class throughout the study area. IDM uses three methods to determine the representative population density of an ancillary class.
1. Preset density - A preset density is a representative population density for an ancillary class that is determined by the user and provided in a configuration file. Any class and density value can be set using this method, but it is commonly used to identify uninhabited ancillary classes (e.g., open water as 0).
2. Sampling - A sampled density is a representative population density for an ancillary class that is determined by collecting representative source units of the ancillary class. A representative source unit for an ancillary class is a source unit that is 1) of sufficient size 2) sufficiently composed of the ancillary class (i.e., homogenous). Finally, there must be 3) a sufficient number of representative source units for an ancillary class to be sampled. These three parameters are adjustable by the user in the IDM toolbox.
3. Intelligent Areal Weighting - Representative population densities that are not preset or sampled are determined using intelligent areal weighting (IAW).
Finally, to ensure that the population estimated for a source unit is equal to the original population count of the source unit, a distribution ratio is applied.
NOTE: Source units that are too small or irregularly shaped to be represented in a raster matching the resolution of the ancillary raster are ignored by the IDM toolbox. For the EnviroAtlas dasymetric model, population counts in these blocks were identified and merged into neighboring blocks as a preprocessing step.
NOTE: Simple area weighting is used for population counts within a source unit made up entirely of ancillary classes with representative population densities estimated at or preset to zero.
For more information on the dasymetric data created for EnviroAtlas, see our website, factsheet, or journal article.
Requirements
The IDM Toolbox was developed for ArcGIS Pro 2.2.4. It has been tested on versions up to 3.2
The Spatial Analyst or 3D Analyst extensions are required.
Use of the IDM toolbox may require increasing the maximum number of unique values the 'Combine Tool' can produce.
You can increase this number by changing a setting in ArcGIS Pro. On the Project tab, select Options and select the Raster and Imagery choice. In the dialog box, select the Raster Dataset choice and enter an appropriate value for the Maximum number of unique values to display.
https://pro.arcgis.com/en/pro-app/tool-reference/spatial-analyst/combine.htm
Installation
The IDM Toolbox for ArcGIS Pro can be added to a new or existing ArcGIS Pro project.
Usage
Preset Densities
The user can set a population density for any ancillary class using their own domain knowledge by modifying the 'config.json' file in the toolbox's root directory. Any class and density value can be provided using this method, but it is commonly used to identify uninhabited ancillary classes (e.g., open water as 0).
The preset densities for the following ancillary classes from the National Land Cover Database (NLCD) are set to 0 people per pixel:
- 11, Open Water
- 12, Perennial Ice/Snow
- 95, Emergent Herbaceous Wetlands
The config.json file is a data dictionary with ancillary raster value as the key (string data type) and preset density as the value (float / integer data type).
For example:
{ "11":0, "12":0, "95":0, "0":0 }
Tool parameters
|Parameter| Description| Data Type
|--|--|--|
|Population Features| The source units with population counts and a unique identifier to be converted to a raster. Common source units are census polygons.| Feature Class |
|Population Count Field | The field in Population Features that stores the population counts.| Field|
|Population Key Field|The field in the Population Features that stores the unique identifier for the source unit. | Field
- ObjectID
- Short integer
- Long integer
- Text
- Double
NOTE: The cell size and spatial reference from the ancillary raster are used for all output rasters from this tool. | Raster Dataset | |Uninhabited File (optional) | An optional feature class containing polygons where no population is expected to reside. The ancillary raster values that overlay the areas within the provided feature class are reclassified as an uninhabited ancillary class (i.e., class "0") and the representative population density for this class is preset to 0 people per pixel.| Feature Class| |Minimum Sample | This is the minimum number of representative source units required for an ancillary class to be considered sampled. A source unit is considered representative of an ancillary class if the ancillary class makes up a certain percent of the source unit’s populated area. Any class that is not preset or sufficiently sampled will be assigned a density using the IAW method.
The default is 3. | Long | |Minimum Sampling Area | The minimum size of a representative source unit (in number of ancillary raster cells). Any source unit with a populated area smaller than this parameter will not be considered a representative source unit. Increasing this number may eliminate small areas that might be outliers that could skew the class average.
The default is 1.| Long | |Percent | A source unit is considered representative of an ancillary class if the ancillary class makes up a certain percent of the source unit’s populated area. This parameter is the minimum percent area of a source unit that a single ancillary class must cover for that source unit to be a representative source unit. This value is in decimal notation.
The default is 0.95.| Double | |Output Directory | The directory where all outputs from the tool will be saved.
NOTE: Must be a folder location, geodatabases are not supported with this tool. | Workspace
Outputs
|Filename | Description |
|--|--|
|DensityRaster.tif | The final population density raster for the study area.|
|DasyRaster.tif | The dasymetric raster represents the spatial intersection of the population source units and the ancillary raster. Each value represents a unique combination of source unit and ancillary raster. These are also known as 'target units'.|
|PopRaster.tif | The population features provided by the user are converted to a raster using the population key field as the values of the raster.|
|uninhablandcover.tif| If the user provides an optional uninhabited file, this raster will be provided in the output directory. This is a copy of the ancillary raster where areas covered by the uninhabited areas are classified as an uninhabited ancillary class (i.e., class 0).|
|PopTable.dbf | The population working table consists of the following information for each source unit in the population features
Population count field_ - The population count of the source unit. The field name will be the same name as the corresponding field in the population features.
- Value - A unique identifier for the target unit and the raster value for the target unit in DasyRaster.tif.
- Count - The number of pixels in the dasymetric raster for the target unit.
- Polygon ID_ - This field stores the unique identifier for the source unit associated with the target unit. The unique identifier is the value of the source unit in the population raster. The name of this field will be the first 9 characters of the population raster’s base name.
- Ancillary ID - This field stores the value of the ancillary class associated with the target unit. The name of this field will be the first 9 characters of the ancillary raster’s base name.
- POPCOUNT - The population count for the source unit associated with the target unit.
- POPAREA - The populated area of the source unit associated with the target unit.
- CLASSDENS - The representative population density for the ancillary class associated with the target unit.
- POPEST - The population estimated for the target unit before the distribution ratio is calculated.
- REMAREA - The remaining area of a target unit after population has been estimated for areas covered by sampled or preset classes in the source unit associated with the target unit.
- POPDIFF - The remaining population of the source unit associated with the target unit. It is the difference between the population estimated by sampled and preset densities and the original population count for the source unit.
- TOTALFRACT - The distribution ratio for the target unit. It is the ratio of the target unit’s population estimate to the total population estimated for the source unit associated with the target unit.
- NEWPOP: The final population estimated for the target unit.
- NEWDENSITY - The final population density estimated for the target unit.
- REPCAT - The ancillary class for which the representative population density was calculated.
- SUM population count: This field stores the sum of the population counts of all representative source units for a sampled class. The field name is a concatenation of ‘SUM’ and the name of the population count field provided by the user.
- SUMPOPAR - This field stores the sum of the populated area of all representative source units of a sampled class.
- SAMPLEDENS - The sampled density of a sampled class is the sum of population count divided by the ‘SUMPOP_AR’ of the sampled class.
- METHOD - The method used to determine the representative population density for the ancillary class. The three available methods are: Sampled, Preset, or IAW.
- CLASSDENS - The representative population density for the ancillary class. For classes that are sampled and do not have a preset density, the CLASSDENS will be the same as SAMPLEDENS.
Example
Example data are provided.
|Parameter| Value| |--|--| |Population Features |2010blocksDE.shp| |Population Count Field | POP10 | |Population Key Field | polyID | |Ancillary Raster | nlcd2011DE.tif | |Uninhabited File | uninhab_DE.shp | |Minimum Sample | 3 | |Minimum Sampling Area | 1 | |Percent | 0.95| |Output Directory | |
Contact
U.S. Environmental Protection Agency
Office of Research and Development
Durham, NC 27709
https://ecomments.epa.gov/enviroatlas/
Credits
The Intelligent Dasymetric Toolbox for ArcGIS Pro was developed for EnviroAtlas. EnviroAtlas is a collaborative effort led by U.S. EPA that provides geospatial data, easy-to-use tools, and other resources related to ecosystem services, their stressors, and human health.
The dasymetric toolbox was updated for ArcGIS Pro in January 2020 by Anam Khan2 and Jeremy Baynes3 and described in Baynes, et al., 20221. This release introduced optional functionality to mask known uninhabited areas.
The toolbox was originally developed for ArcMap 10 by Torrin Hultgren4 following the methods of Mennis and Hultgren (2006)5.
1 Baynes, J., Neale, A., & Hultgren, T. (2022). Improving intelligent dasymetric mapping population density estimates at 30 m resolution for the conterminous United States by excluding uninhabited areas. Earth system science data, 14(6), 2833.
2 Oak Ridge Associated Universities, National Student Services Contractor at the U.S. EPA
3 U.S. EPA Office of Research and Development
4 National Geospatial Support Team at U.S. EPA
5 Mennis, Jeremy & Hultgren, Torrin. (2006). Intelligent Dasymetric Mapping and Its Application to Areal Interpolation. Cartography and Geographic Information Science. 33. 179-194.
License
MIT License
Copyright (c) 2024 U.S. Federal Government (in countries where recognized)
Permission is hereby granted, free of charge, to any person obtaining a copy of this software and associated documentation files (the "Software"), to deal in the Software without restriction, including without limitation the rights to use, copy, modify, merge, publish, distribute, sublicense, and/or sell copies of the Software, and to permit persons to whom the Software is furnished to do so, subject to the following conditions:
The above copyright notice and this permission notice shall be included in all copies or substantial portions of the Software.
THE SOFTWARE IS PROVIDED "AS IS", WITHOUT WARRANTY OF ANY KIND, EXPRESS OR IMPLIED, INCLUDING BUT NOT LIMITED TO THE WARRANTIES OF MERCHANTABILITY, FITNESS FOR A PARTICULAR PURPOSE AND NONINFRINGEMENT. IN NO EVENT SHALL THE AUTHORS OR COPYRIGHT HOLDERS BE LIABLE FOR ANY CLAIM, DAMAGES OR OTHER LIABILITY, WHETHER IN AN ACTION OF CONTRACT, TORT OR OTHERWISE, ARISING FROM, OUT OF OR IN CONNECTION WITH THE SOFTWARE OR THE USE OR OTHER DEALINGS IN THE SOFTWARE.
EPA Disclaimer
The United States Environmental Protection Agency (EPA) GitHub project code is provided on an "as is" basis and the user assumes responsibility for its use. EPA has relinquished control of the information and no longer has responsibility to protect the integrity, confidentiality, or availability of the information. Any reference to specific commercial products, processes, or services by service mark, trademark, manufacturer, or otherwise, does not constitute or imply their endorsement, recommendation or favoring by EPA. The EPA seal and logo shall not be used in any manner to imply endorsement of any commercial product or activity by EPA or the United States Government.
Owner
- Name: U.S. Environmental Protection Agency
- Login: USEPA
- Kind: organization
- Location: United States of America
- Website: https://www.epa.gov
- Twitter: EPA
- Repositories: 449
- Profile: https://github.com/USEPA
Citation (CITATION.cff)
cff-version: 1.1.0
message: "If you use this software, please cite it as below."
authors:
- family-names: U.S. Environmental Protection Agency
  given-names: Office of Research and Development
title: Intelligent Dasymetric Toolbox for ArcGIS Pro
version: v1.0.1
date-released: 2025-03-26
doi: 10.5281/zenodo.6645815
GitHub Events
Total
- Watch event: 1
- Push event: 2
- Fork event: 2
Last Year
- Watch event: 1
- Push event: 2
- Fork event: 2
Committers
Last synced: over 2 years ago
Top Committers
| Name | Commits | |
|---|---|---|
| jeremybaynes | b****y@e****v | 4 |
| rwashing523 | w****e@e****v | 1 |
Committer Domains (Top 20 + Academic)
Issues and Pull Requests
Last synced: about 1 year ago
All Time
- Total issues: 2
- Total pull requests: 0
- Average time to close issues: N/A
- Average time to close pull requests: N/A
- Total issue authors: 2
- Total pull request authors: 0
- Average comments per issue: 0.5
- Average comments per pull request: 0
- Merged pull requests: 0
- Bot issues: 0
- Bot pull requests: 0
Past Year
- Issues: 1
- Pull requests: 0
- Average time to close issues: N/A
- Average time to close pull requests: N/A
- Issue authors: 1
- Pull request authors: 0
- Average comments per issue: 0.0
- Average comments per pull request: 0
- Merged pull requests: 0
- Bot issues: 0
- Bot pull requests: 0
Top Authors
Issue Authors
- tillinghasttillinghast (1)
- elenamazon (1)