pytorchts
PyTorch based Probabilistic Time Series forecasting framework based on GluonTS backend
Science Score: 54.0%
This score indicates how likely this project is to be science-related based on various indicators:
-
✓CITATION.cff file
Found CITATION.cff file -
✓codemeta.json file
Found codemeta.json file -
✓.zenodo.json file
Found .zenodo.json file -
○DOI references
-
✓Academic publication links
Links to: arxiv.org -
○Committers with academic emails
-
○Institutional organization owner
-
○JOSS paper metadata
-
○Scientific vocabulary similarity
Low similarity (12.5%) to scientific vocabulary
Keywords
Keywords from Contributors
Repository
PyTorch based Probabilistic Time Series forecasting framework based on GluonTS backend
Basic Info
Statistics
- Stars: 1,326
- Watchers: 24
- Forks: 200
- Open Issues: 103
- Releases: 9
Topics
Metadata Files
README.md
PyTorchTS
PyTorchTS is a PyTorch Probabilistic Time Series forecasting framework which provides state of the art PyTorch time series models by utilizing GluonTS as its back-end API and for loading, transforming and back-testing time series data sets.
Installation
$ pip3 install pytorchts
Quick start
Here we highlight the the API changes via the GluonTS README.
```python import matplotlib.pyplot as plt import pandas as pd import torch
from gluonts.dataset.common import ListDataset from gluonts.dataset.util import to_pandas
from pts.model.deepar import DeepAREstimator from pts import Trainer ```
This simple example illustrates how to train a model on some data, and then use it to make predictions. As a first step, we need to collect some data: in this example we will use the volume of tweets mentioning the AMZN ticker symbol.
python
url = "https://raw.githubusercontent.com/numenta/NAB/master/data/realTweets/Twitter_volume_AMZN.csv"
df = pd.read_csv(url, header=0, index_col=0, parse_dates=True)
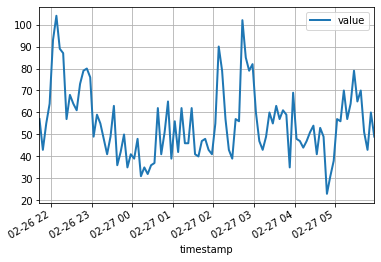
The first 100 data points look like follows:
python
df[:100].plot(linewidth=2)
plt.grid(which='both')
plt.show()
We can now prepare a training dataset for our model to train on. Datasets are essentially iterable collections of dictionaries: each dictionary represents a time series with possibly associated features. For this example, we only have one entry, specified by the "start" field which is the timestamp of the first data point, and the "target" field containing time series data. For training, we will use data up to midnight on April 5th, 2015.
python
training_data = ListDataset(
    [{"start": df.index[0], "target": df.value[:"2015-04-05 00:00:00"]}],
    freq = "5min"
)
A forecasting model is a predictor object. One way of obtaining predictors is by training a correspondent estimator. Instantiating an estimator requires specifying the frequency of the time series that it will handle, as well as the number of time steps to predict. In our example we're using 5 minutes data, so req="5min", and we will train a model to predict the next hour, so prediction_length=12. The input to the model will be a vector of size input_size=43 at each time point. We also specify some minimal training options in particular training on a device for epoch=10.
```python device = torch.device("cuda" if torch.cuda.is_available() else "cpu")
estimator = DeepAREstimator(freq="5min",
predictionlength=12,
inputsize=19,
trainer=Trainer(epochs=10,
device=device))
predictor = estimator.train(trainingdata=trainingdata, numworkers=4)
45it [00:01, 37.60it/s, avgepochloss=4.64, epoch=0]
48it [00:01, 39.56it/s, avgepochloss=4.2, epoch=1]
45it [00:01, 38.11it/s, avgepochloss=4.1, epoch=2]
43it [00:01, 36.29it/s, avgepochloss=4.05, epoch=3]
44it [00:01, 35.98it/s, avgepochloss=4.03, epoch=4]
48it [00:01, 39.48it/s, avgepochloss=4.01, epoch=5]
48it [00:01, 38.65it/s, avgepochloss=4, epoch=6]
46it [00:01, 37.12it/s, avgepochloss=3.99, epoch=7]
48it [00:01, 38.86it/s, avgepochloss=3.98, epoch=8]
48it [00:01, 39.49it/s, avgepoch_loss=3.97, epoch=9]
```
During training, useful information about the progress will be displayed. To get a full overview of the available options, please refer to the source code of DeepAREstimator (or other estimators) and Trainer.
We're now ready to make predictions: we will forecast the hour following the midnight on April 15th, 2015.
python
test_data = ListDataset(
    [{"start": df.index[0], "target": df.value[:"2015-04-15 00:00:00"]}],
    freq = "5min"
)
python
for test_entry, forecast in zip(test_data, predictor.predict(test_data)):
    to_pandas(test_entry)[-60:].plot(linewidth=2)
    forecast.plot(color='g', prediction_intervals=[50.0, 90.0])
plt.grid(which='both')
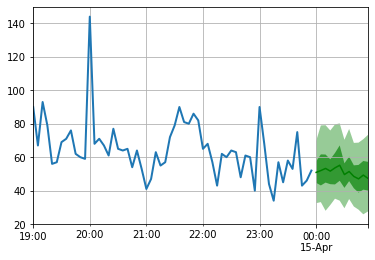
Note that the forecast is displayed in terms of a probability distribution: the shaded areas represent the 50% and 90% prediction intervals, respectively, centered around the median (dark green line).
Development
pip install -e .
pytest test
Citing
To cite this repository:
tex
@software{pytorchgithub,
    author = {Kashif Rasul},
    title = {{P}yTorch{TS}},
    url = {https://github.com/zalandoresearch/pytorch-ts},
    version = {0.6.x},
    year = {2021},
}
Scientific Article
We have implemented the following model using this framework:
Multi-variate Probabilistic Time Series Forecasting via Conditioned Normalizing Flows
tex
@INPROCEEDINGS{rasul2020tempflow,
author = {Kashif Rasul and  Abdul-Saboor Sheikh and  Ingmar Schuster and Urs Bergmann and Roland Vollgraf},
title = {{M}ultivariate {P}robabilistic {T}ime {S}eries {F}orecasting via {C}onditioned {N}ormalizing {F}lows},
year = {2021},
url = {https://openreview.net/forum?id=WiGQBFuVRv},
booktitle = {International Conference on Learning Representations 2021},
}
Autoregressive Denoising Diffusion Models for Multivariate Probabilistic Time Series Forecasting
tex
@InProceedings{pmlr-v139-rasul21a,
title =    {{A}utoregressive {D}enoising {D}iffusion {M}odels for {M}ultivariate {P}robabilistic {T}ime {S}eries {F}orecasting},
author =       {Rasul, Kashif and Seward, Calvin and Schuster, Ingmar and Vollgraf, Roland},
booktitle =    {Proceedings of the 38th International Conference on Machine Learning},
pages =    {8857--8868},
year =     {2021},
editor =   {Meila, Marina and Zhang, Tong},
volume =   {139},
series =   {Proceedings of Machine Learning Research},
month =    {18--24 Jul},
publisher =    {PMLR},
pdf =      {http://proceedings.mlr.press/v139/rasul21a/rasul21a.pdf},
url =      {http://proceedings.mlr.press/v139/rasul21a.html},
}
Probabilistic Time Series Forecasting with Implicit Quantile Networks
tex
@misc{gouttes2021probabilistic,
  title={{P}robabilistic {T}ime {S}eries {F}orecasting with {I}mplicit {Q}uantile {N}etworks},
  author={Adèle Gouttes and Kashif Rasul and Mateusz Koren and Johannes Stephan and Tofigh Naghibi},
  year={2021},
  eprint={2107.03743},
  archivePrefix={arXiv},
  primaryClass={cs.LG}
}
Owner
- Name: Zalando Research
- Login: zalandoresearch
- Kind: organization
- Email: research@zalando.de
- Location: Berlin, Germany
- Website: https://research.zalando.com/
- Repositories: 9
- Profile: https://github.com/zalandoresearch
Repositories of the research branch of Zalando SE
Citation (CITATION.cff)
cff-version: 1.2.0
message: If you use this software, please cite it using the following metadata
title: PyTorchTS
authors:
- family-names: Rasul
  given-names: Kashif
license: MIT
repository-code: https://github.com/zalandoresearch/pytorch-ts
version: 0.6.0
GitHub Events
Total
- Issues event: 18
- Watch event: 89
- Issue comment event: 20
- Fork event: 12
Last Year
- Issues event: 18
- Watch event: 89
- Issue comment event: 20
- Fork event: 12
Committers
Last synced: about 1 year ago
Top Committers
| Name | Commits | |
|---|---|---|
| Dr. Kashif Rasul | k****l@g****m | 358 |
| Kashif Rasul | k****l@z****e | 54 |
| Edrin Basha | e****a@z****e | 5 |
| Vahe Hakobyan | v****n@z****e | 3 |
| Ingmar Schuster | i****r@z****e | 2 |
| ssmall41 | s****1 | 1 |
| aslinagy | 6****y | 1 |
| Shoaib Burq | s****q@g****m | 1 |
| Shashank Deshpande | s****8@g****m | 1 |
| Samuel Norling | n****l@g****m | 1 |
| NielsRogge | 4****e | 1 |
| Nick | n****k@k****a | 1 |
| Larkin Liu | l****n@g****m | 1 |
| Clara Grotehans | 6****s | 1 |
| Adele Gouttes | a****s@z****e | 1 |
Committer Domains (Top 20 + Academic)
Issues and Pull Requests
Last synced: 9 months ago
All Time
- Total issues: 134
- Total pull requests: 18
- Average time to close issues: 17 days
- Average time to close pull requests: 10 days
- Total issue authors: 105
- Total pull request authors: 12
- Average comments per issue: 2.66
- Average comments per pull request: 1.06
- Merged pull requests: 9
- Bot issues: 0
- Bot pull requests: 0
Past Year
- Issues: 14
- Pull requests: 0
- Average time to close issues: about 13 hours
- Average time to close pull requests: N/A
- Issue authors: 9
- Pull request authors: 0
- Average comments per issue: 0.64
- Average comments per pull request: 0
- Merged pull requests: 0
- Bot issues: 0
- Bot pull requests: 0
Top Authors
Issue Authors
- hanlaoshi (4)
- ken-take-it-so-so (4)
- lhyuehh (3)
- larkz (3)
- BEbillionaireUSD (3)
- zf223669 (3)
- gabrielebelegni (3)
- AlexMRuch (2)
- xinyaofan (2)
- ClaraGrthns (2)
- Usama-Samad (2)
- goomhow (2)
- youandyourself (2)
- c1adrien (2)
- aaronfderybel (2)
Pull Request Authors
- kashif (5)
- larkz (3)
- janrth (1)
- LemonCANDY42 (1)
- khuyentran1401 (1)
- nonconvexopt (1)
- aslinagy (1)
- NielsRogge (1)
- Samnor (1)
- ClaraGrthns (1)
- shashankdeshpande (1)
- kousu (1)
Top Labels
Issue Labels
Pull Request Labels
Packages
- Total packages: 1
-
Total downloads:
- pypi 129 last-month
- Total dependent packages: 1
- Total dependent repositories: 9
- Total versions: 8
- Total maintainers: 1
pypi.org: pytorchts
PyTorch Probabilistic Time Series Modeling framework
- Homepage: https://github.com/zalandoresearch/pytorch-ts
- Documentation: https://pytorchts.readthedocs.io/
- License: MIT
-
Latest release: 0.6.0
published about 4 years ago
Rankings
Maintainers (1)
Dependencies
- actions/checkout master composite
- actions/setup-python v1 composite
- pypa/gh-action-pypi-publish master composite
- gluonts >=0.9.0
- holidays *
- matplotlib *
- numpy *
- pandas *
- scipy *
- tensorboard *
- torch >=1.8.0
- tqdm *