pygenomeviz
A genome visualization python package for comparative genomics
Science Score: 44.0%
This score indicates how likely this project is to be science-related based on various indicators:
-
✓CITATION.cff file
Found CITATION.cff file -
✓codemeta.json file
Found codemeta.json file -
✓.zenodo.json file
Found .zenodo.json file -
○DOI references
-
○Academic publication links
-
○Committers with academic emails
-
○Institutional organization owner
-
○JOSS paper metadata
-
○Scientific vocabulary similarity
Low similarity (15.4%) to scientific vocabulary
Keywords
Repository
A genome visualization python package for comparative genomics
Basic Info
- Host: GitHub
- Owner: moshi4
- License: mit
- Language: Python
- Default Branch: main
- Homepage: https://moshi4.github.io/pyGenomeViz
- Size: 75.1 MB
Statistics
- Stars: 357
- Watchers: 3
- Forks: 21
- Open Issues: 1
- Releases: 25
Topics
Metadata Files
README.md
pyGenomeViz


![]()
[!NOTE] A major version upgrade, pyGenomeViz v1.0.0, was released on 2024/05. Backward incompatible changes have been made between v1.0.0 and v0.X.X to make for a more sophisticated API/CLI design. Therefore, v0.X.X users should pin the version to v0.4.4 or update existing code for v1.0.0. Previous v0.4.4 documentation is available here.
Table of contents
- Overview
- Installation
- API Examples
- CLI Examples
- GUI (Web Application)
- HTML Viewer
- Inspiration
- Circular Genome Visualization
- Star History
Overview
pyGenomeViz is a genome visualization python package for comparative genomics implemented based on matplotlib. This package is developed for the purpose of easily and beautifully plotting genomic features and sequence similarity comparison links between multiple genomes. It supports genome visualization of Genbank/GFF format file and can be saved figure in various formats (JPG/PNG/SVG/PDF/HTML). User can use pyGenomeViz for interactive genome visualization figure plotting on jupyter notebook, or automatic genome visualization figure plotting in genome analysis scripts/workflow.
For more information, please see full documentation here.
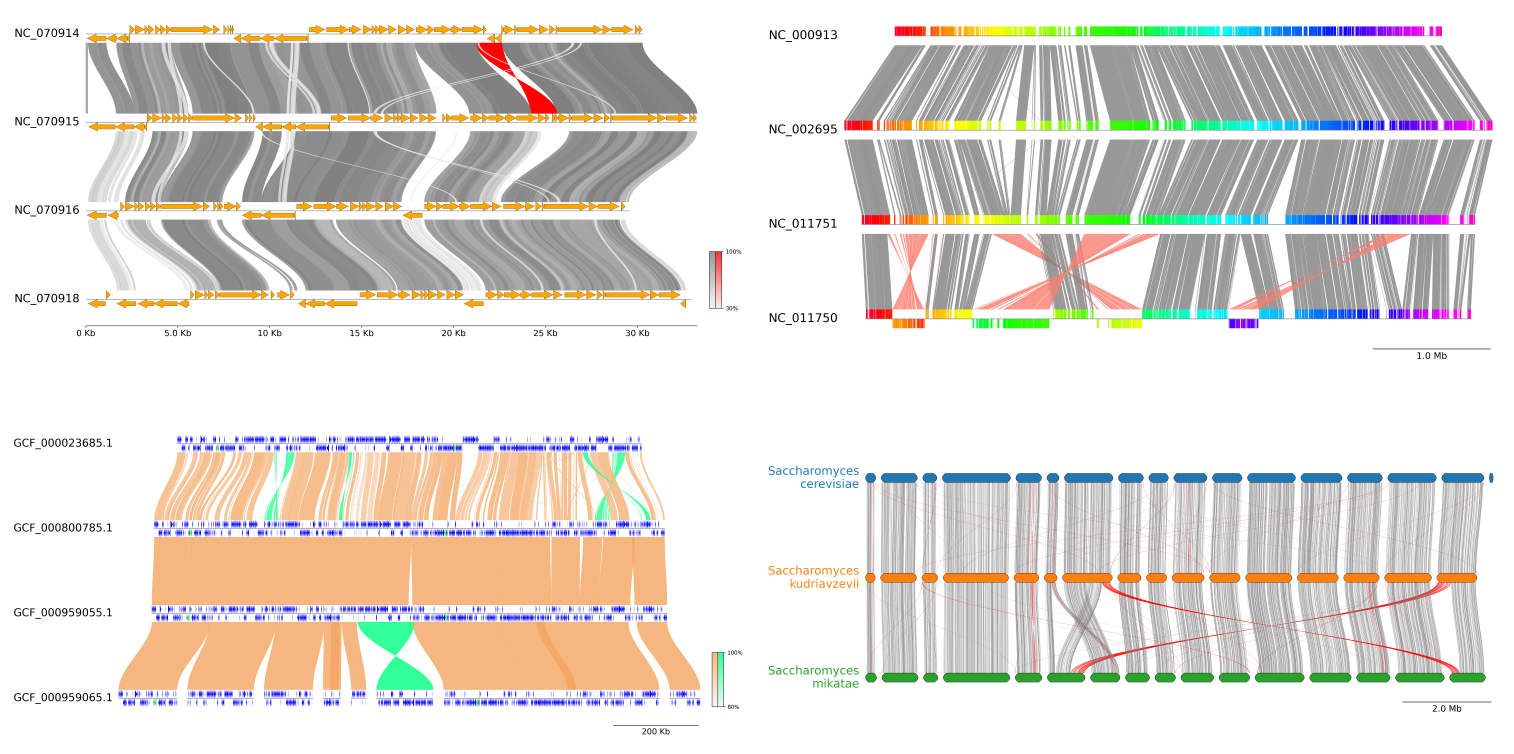
Fig.1 pyGenomeViz example plot gallery
 Fig.2 pyGenomeViz web application example (Demo Page)
Installation
Python 3.9 or later is required for installation.
Install PyPI package:
pip install pygenomeviz
Install conda-forge package:
conda install -c conda-forge pygenomeviz
Use Docker (Image Registry):
docker run -it --rm -p 8501:8501 ghcr.io/moshi4/pygenomeviz:latest pgv-gui -h
API Examples
Jupyter notebooks containing code examples below is available here.
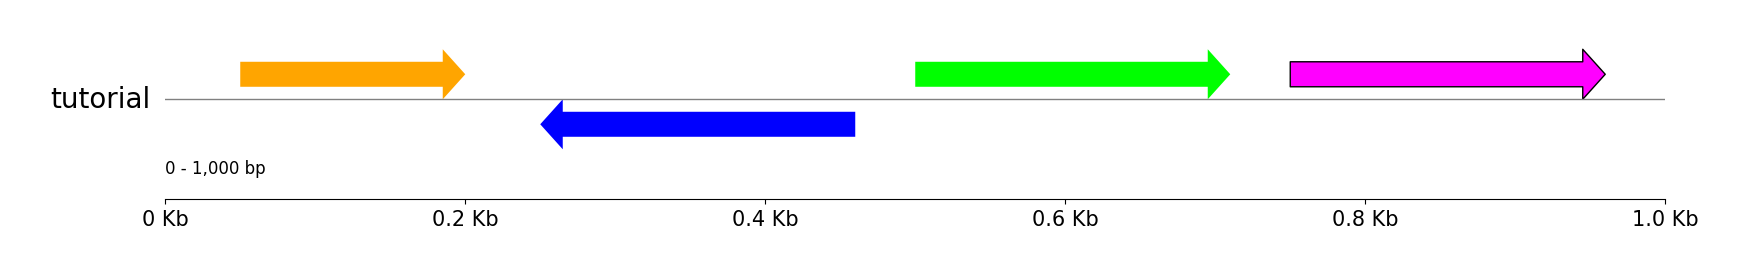
Features
```python from pygenomeviz import GenomeViz
gv = GenomeViz() gv.setscalexticks(ymargin=0.5)
track = gv.addfeaturetrack("tutorial", 1000) track.add_sublabel()
track.addfeature(50, 200, 1) track.addfeature(250, 460, -1, fc="blue") track.addfeature(500, 710, 1, fc="lime") track.addfeature(750, 960, 1, fc="magenta", lw=1.0)
gv.savefig("features.png") ```
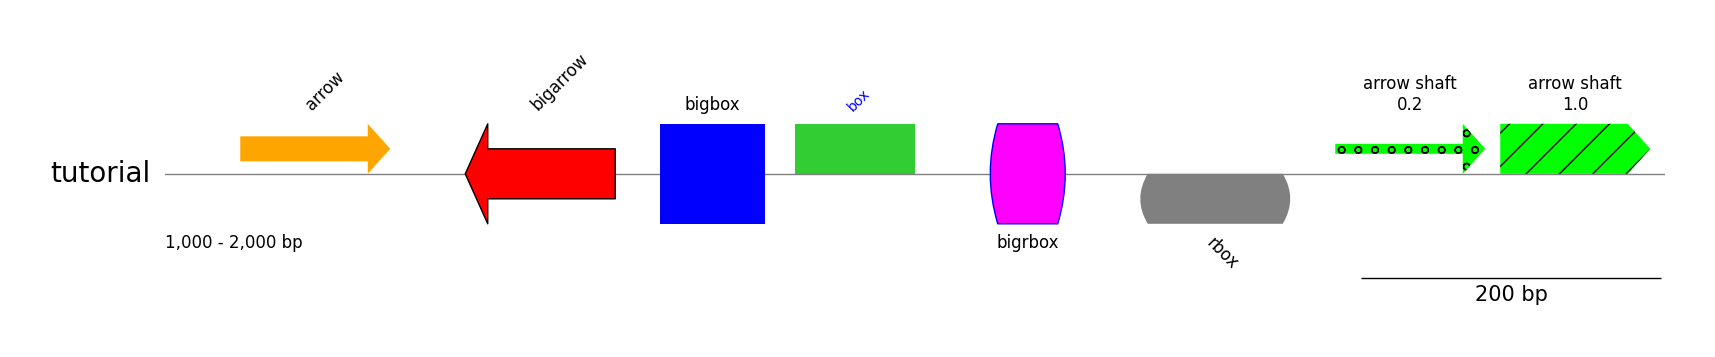
Styled Features
```python from pygenomeviz import GenomeViz
gv = GenomeViz() gv.setscalebar(ymargin=0.5)
track = gv.addfeaturetrack("tutorial", (1000, 2000)) track.add_sublabel()
track.addfeature(1050, 1150, 1, label="arrow") track.addfeature(1200, 1300, -1, plotstyle="bigarrow", label="bigarrow", fc="red", lw=1) track.addfeature(1330, 1400, 1, plotstyle="bigbox", label="bigbox", fc="blue", textkws=dict(rotation=0, hpos="center")) track.addfeature(1420, 1500, 1, plotstyle="box", label="box", fc="limegreen", textkws=dict(size=10, color="blue")) track.addfeature(1550, 1600, 1, plotstyle="bigrbox", label="bigrbox", fc="magenta", ec="blue", lw=1, textkws=dict(rotation=0, vpos="bottom", hpos="center")) track.addfeature(1650, 1750, -1, plotstyle="rbox", label="rbox", fc="grey", textkws=dict(rotation=-45, vpos="bottom")) track.addfeature(1780, 1880, 1, fc="lime", hatch="o", arrowshaftratio=0.2, label="arrow shaft\n0.2", textkws=dict(rotation=0, hpos="center")) track.addfeature(1890, 1990, 1, fc="lime", hatch="/", arrowshaftratio=1.0, label="arrow shaft\n1.0", textkws=dict(rotation=0, hpos="center"))
gv.savefig("styled_features.png") ```
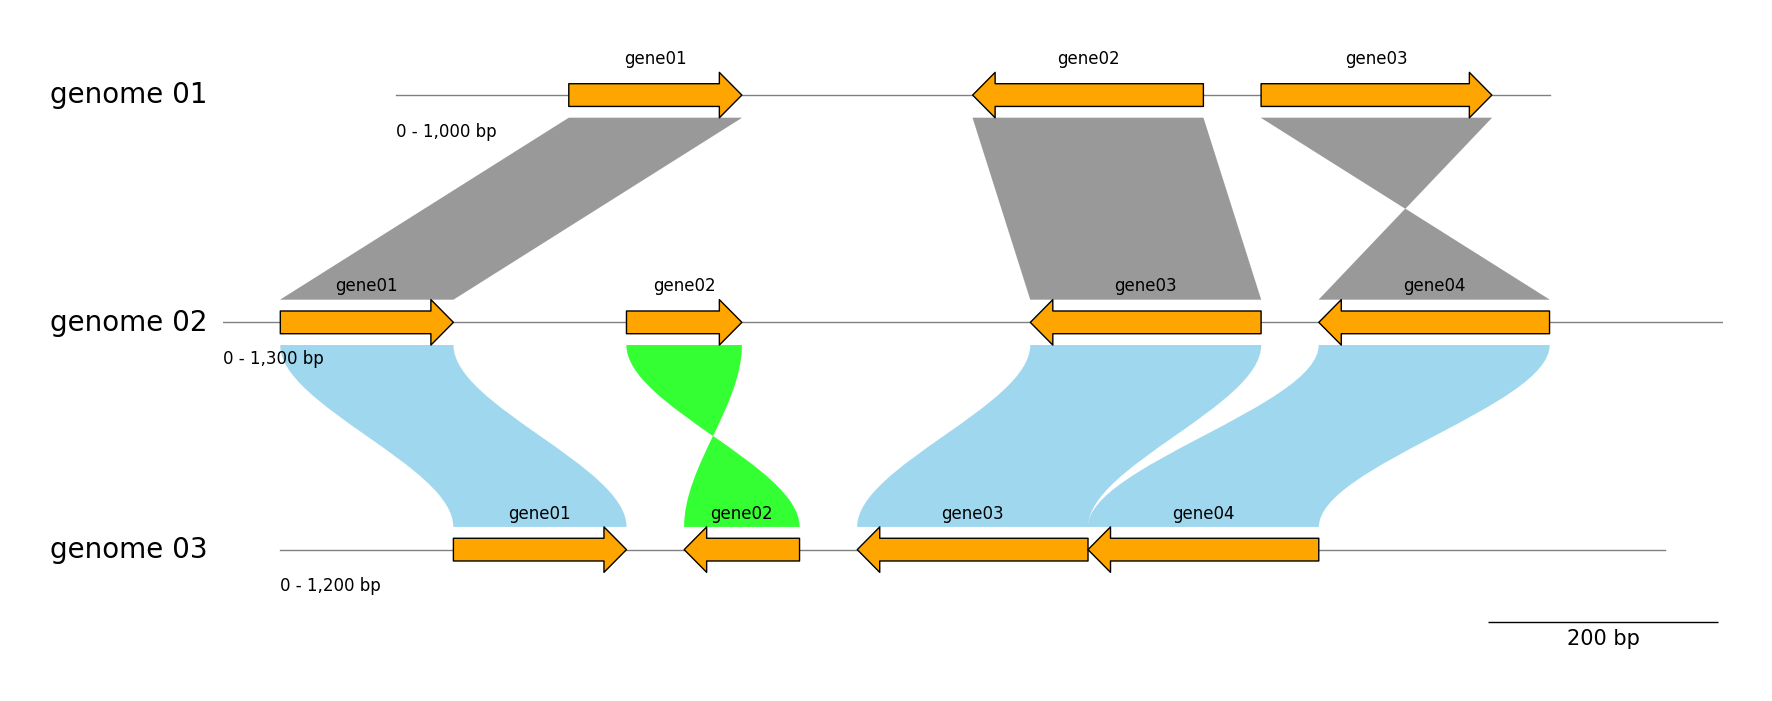
Tracks & Links
```python from pygenomeviz import GenomeViz
genome_list = [ dict(name="genome 01", size=1000, features=((150, 300, 1), (500, 700, -1), (750, 950, 1))), dict(name="genome 02", size=1300, features=((50, 200, 1), (350, 450, 1), (700, 900, -1), (950, 1150, -1))), dict(name="genome 03", size=1200, features=((150, 300, 1), (350, 450, -1), (500, 700, -1), (700, 900, -1))), ]
gv = GenomeViz(trackaligntype="center") gv.setscalebar()
for genome in genomelist: name, size, features = genome["name"], genome["size"], genome["features"] track = gv.addfeaturetrack(name, size) track.addsublabel() for idx, feature in enumerate(features, 1): start, end, strand = feature track.addfeature(start, end, strand, plotstyle="bigarrow", lw=1, label=f"gene{idx:02d}", textkws=dict(rotation=0, vpos="top", hpos="center"))
Add links between "genome 01" and "genome 02"
gv.addlink(("genome 01", 150, 300), ("genome 02", 50, 200)) gv.addlink(("genome 01", 700, 500), ("genome 02", 900, 700)) gv.add_link(("genome 01", 750, 950), ("genome 02", 1150, 950))
Add links between "genome 02" and "genome 03"
gv.addlink(("genome 02", 50, 200), ("genome 03", 150, 300), color="skyblue", invertedcolor="lime", curve=True) gv.addlink(("genome 02", 350, 450), ("genome 03", 450, 350), color="skyblue", invertedcolor="lime", curve=True) gv.addlink(("genome 02", 900, 700), ("genome 03", 700, 500), color="skyblue", invertedcolor="lime", curve=True) gv.addlink(("genome 03", 900, 700), ("genome 02", 1150, 950), color="skyblue", invertedcolor="lime", curve=True)
gv.savefig("tracksandlinks.png") ```
Exon Features
```python from pygenomeviz import GenomeViz
exonregions1 = [(0, 210), (300, 480), (590, 800), (850, 1000), (1030, 1300)] exonregions2 = [(1500, 1710), (2000, 2480), (2590, 2800)] exon_regions3 = [(3000, 3300), (3400, 3690), (3800, 4100), (4200, 4620)]
gv = GenomeViz() track = gv.addfeaturetrack("Exon Features", 5000) track.addexonfeature(exonregions1, strand=1, plotstyle="box", label="box", textkws=dict(rotation=0, hpos="center")) track.addexonfeature(exonregions2, strand=-1, plotstyle="arrow", label="arrow", textkws=dict(rotation=0, vpos="bottom", hpos="center"), patchkws=dict(fc="darkgrey"), intronpatchkws=dict(ec="red")) track.addexonfeature(exonregions3, strand=1, plotstyle="bigarrow", label="bigarrow", textkws=dict(rotation=0, hpos="center"), patchkws=dict(fc="lime", lw=1))
gv.savefig("exon_features.png") ```

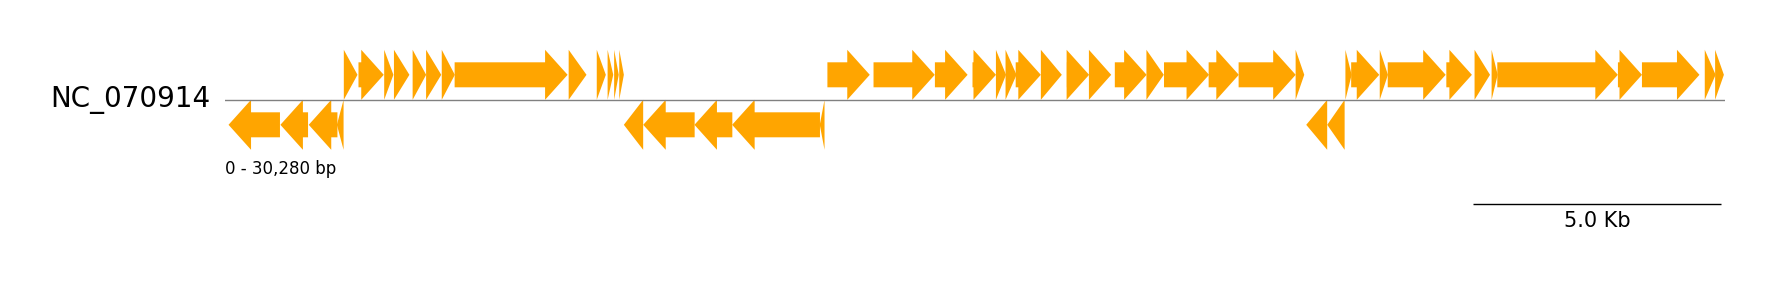
Genbank Features
```python from pygenomeviz import GenomeViz from pygenomeviz.parser import Genbank from pygenomeviz.utils import loadexamplegenbank_dataset
gbkfiles = loadexamplegenbankdataset("yersiniaphage") gbk = Genbank(gbkfiles[0])
gv = GenomeViz() gv.setscalebar(ymargin=0.5)
track = gv.addfeaturetrack(gbk.name, gbk.genomelength) track.addsublabel()
features = gbk.extractfeatures() track.addfeatures(features)
gv.savefig("genbank_features.png") ```
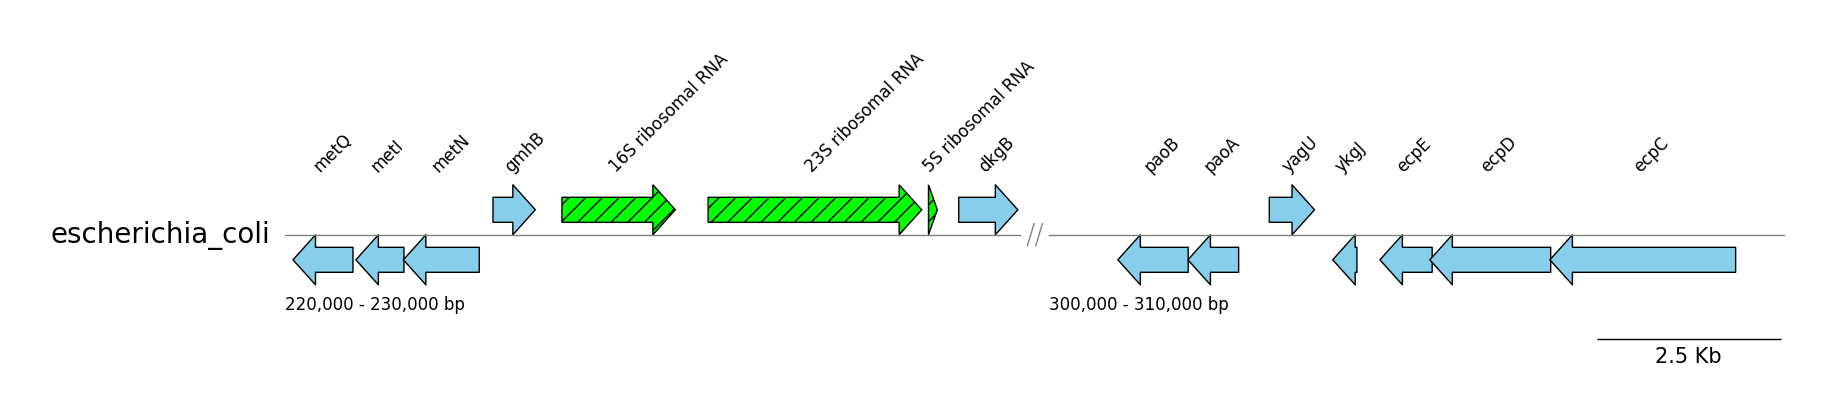
GFF Features
```python from pygenomeviz import GenomeViz from pygenomeviz.parser import Gff from pygenomeviz.utils import loadexamplegff_file
gfffile = loadexamplegfffile("escherichiacoli.gff.gz") gff = Gff(gfffile)
gv = GenomeViz() gv.setscalebar(ymargin=0.5)
targetranges = ((220000, 230000), (300000, 310000)) track = gv.addfeaturetrack(name=gff.name, segments=targetranges) track.setsegmentsep(symbol="//")
for segment in track.segments: segment.addsublabel() # Plot CDS features cdsfeatures = gff.extractfeatures(featuretype="CDS", targetrange=segment.range) segment.addfeatures(cdsfeatures, labeltype="gene", fc="skyblue", lw=1.0) # Plot rRNA features rrnafeatures = gff.extractfeatures(featuretype="rRNA", targetrange=segment.range) segment.addfeatures(rrnafeatures, label_type="product", hatch="//", fc="lime", lw=1.0)
gv.savefig("gff_features.png") ```
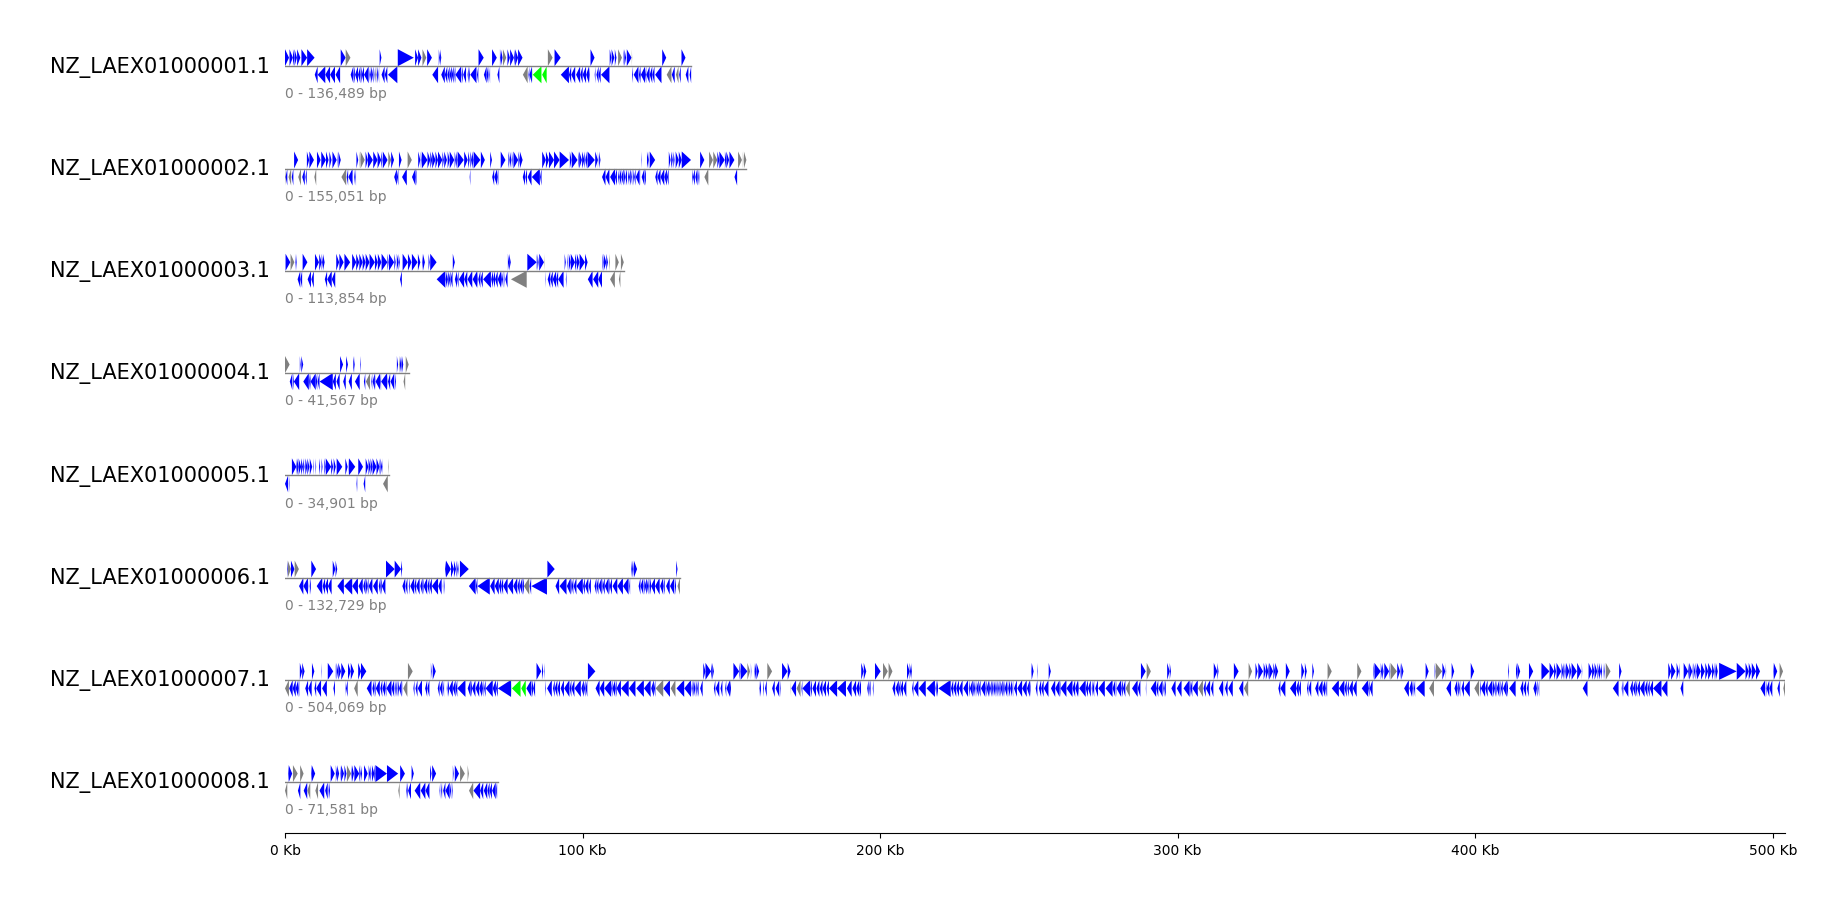
GFF Contigs
```python from pygenomeviz import GenomeViz from pygenomeviz.parser import Gff from pygenomeviz.utils import loadexamplegfffile, ispseudo_feature
gfffile = loadexamplegfffile("mycoplasmamycoides.gff") gff = Gff(gfffile)
gv = GenomeViz(figtrackheight=0.5, featuretrackratio=0.5) gv.setscalexticks(labelsize=10)
Plot CDS, rRNA features for each contig to tracks
for seqid, size in gff.getseqid2size().items(): track = gv.addfeaturetrack(seqid, size, labelsize=15) track.addsublabel(size=10, color="grey") cdsfeatures = gff.getseqid2features(featuretype="CDS")[seqid] # CDS: blue, CDS(pseudo): grey for cdsfeature in cdsfeatures: color = "grey" if ispseudofeature(cdsfeature) else "blue" track.addfeatures(cdsfeature, color=color) # rRNA: lime rrnafeatures = gff.getseqid2features(featuretype="rRNA")[seqid] track.addfeatures(rrna_features, color="lime")
gv.savefig("gff_contigs.png") ```
Genbank Comparison by BLAST
```python from pygenomeviz import GenomeViz from pygenomeviz.parser import Genbank from pygenomeviz.utils import loadexamplegenbank_dataset from pygenomeviz.align import Blast, AlignCoord
gbkfiles = loadexamplegenbankdataset("yersiniaphage") gbklist = list(map(Genbank, gbk_files))
gv = GenomeViz(trackaligntype="center") gv.setscalebar()
Plot CDS features
for gbk in gbklist: track = gv.addfeaturetrack(gbk.name, gbk.getseqid2size(), alignlabel=False) for seqid, features in gbk.getseqid2features("CDS").items(): segment = track.getsegment(seqid) segment.addfeatures(features, plotstyle="bigarrow", fc="limegreen", lw=0.5)
Run BLAST alignment & filter by user-defined threshold
aligncoords = Blast(gbklist, seqtype="protein").run() aligncoords = AlignCoord.filter(aligncoords, lengththr=100, identitythr=30)
Plot BLAST alignment links
if len(aligncoords) > 0: minident = int(min([ac.identity for ac in aligncoords if ac.identity])) color, invertedcolor = "grey", "red" for ac in aligncoords: gv.addlink(ac.querylink, ac.reflink, color=color, invertedcolor=invertedcolor, v=ac.identity, vmin=minident) gv.setcolorbar([color, invertedcolor], vmin=minident)
gv.savefig("genbankcomparisonby_blast.png") ```
CLI Examples
pyGenomeViz provides CLI workflows for genome alignment result visualization of
Genbank genomes using BLAST / MUMmer / MMseqs / progressiveMauve, respectively.
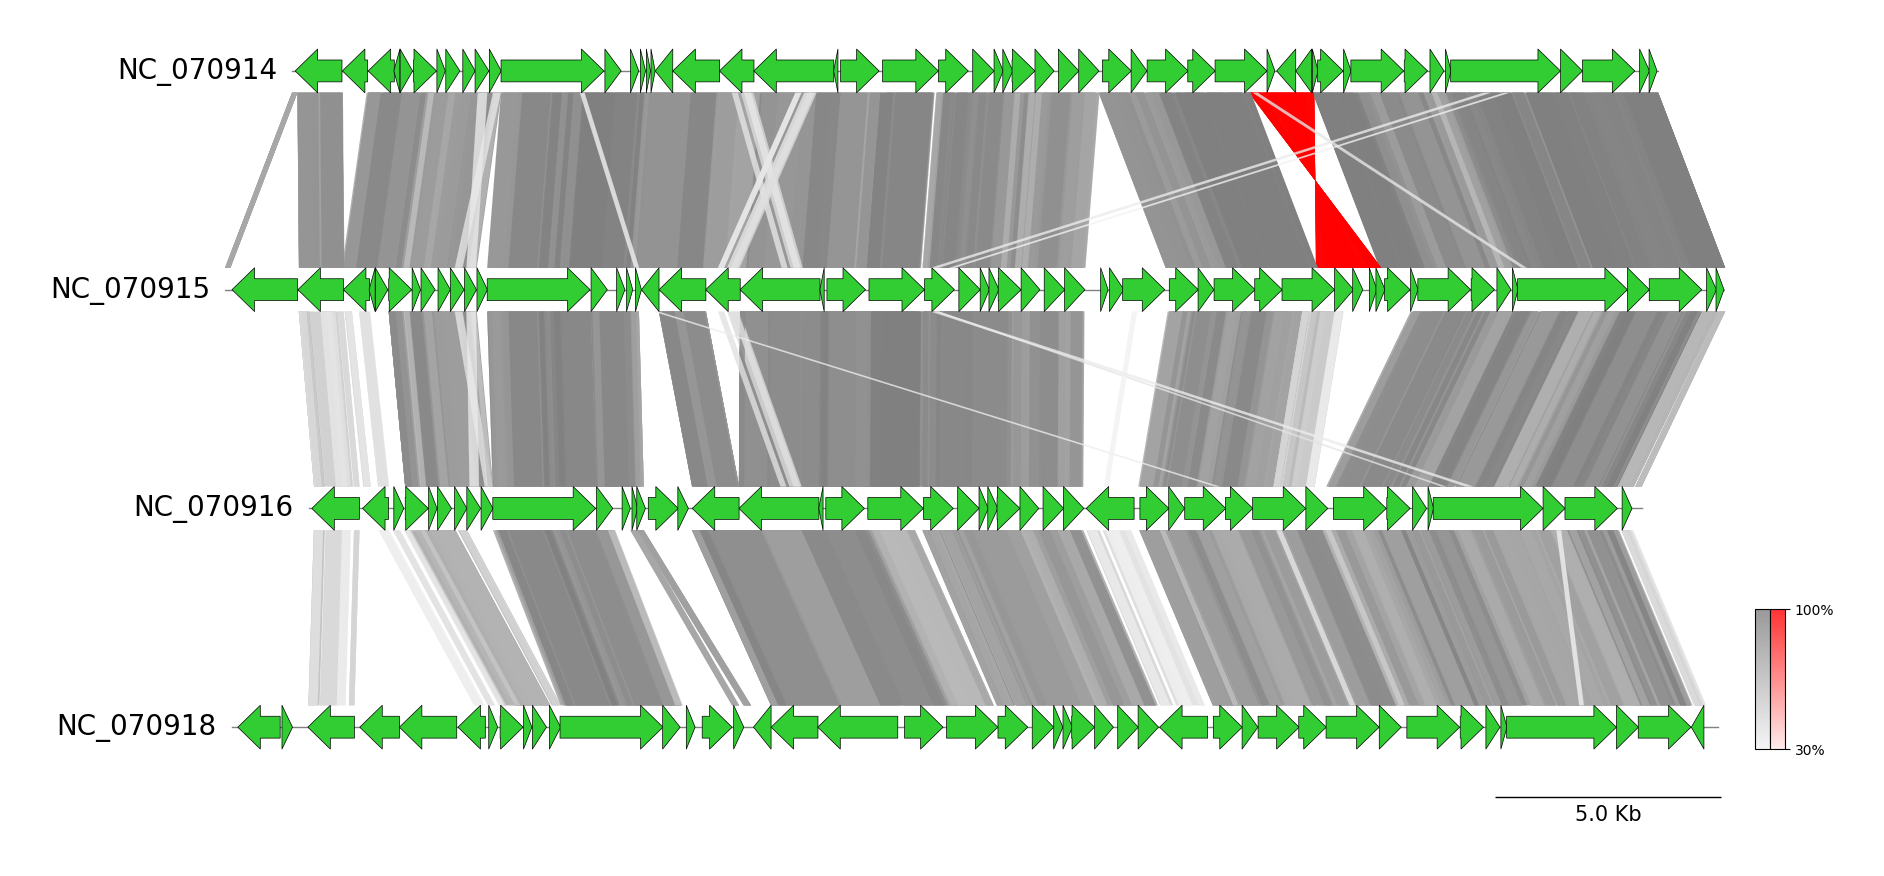
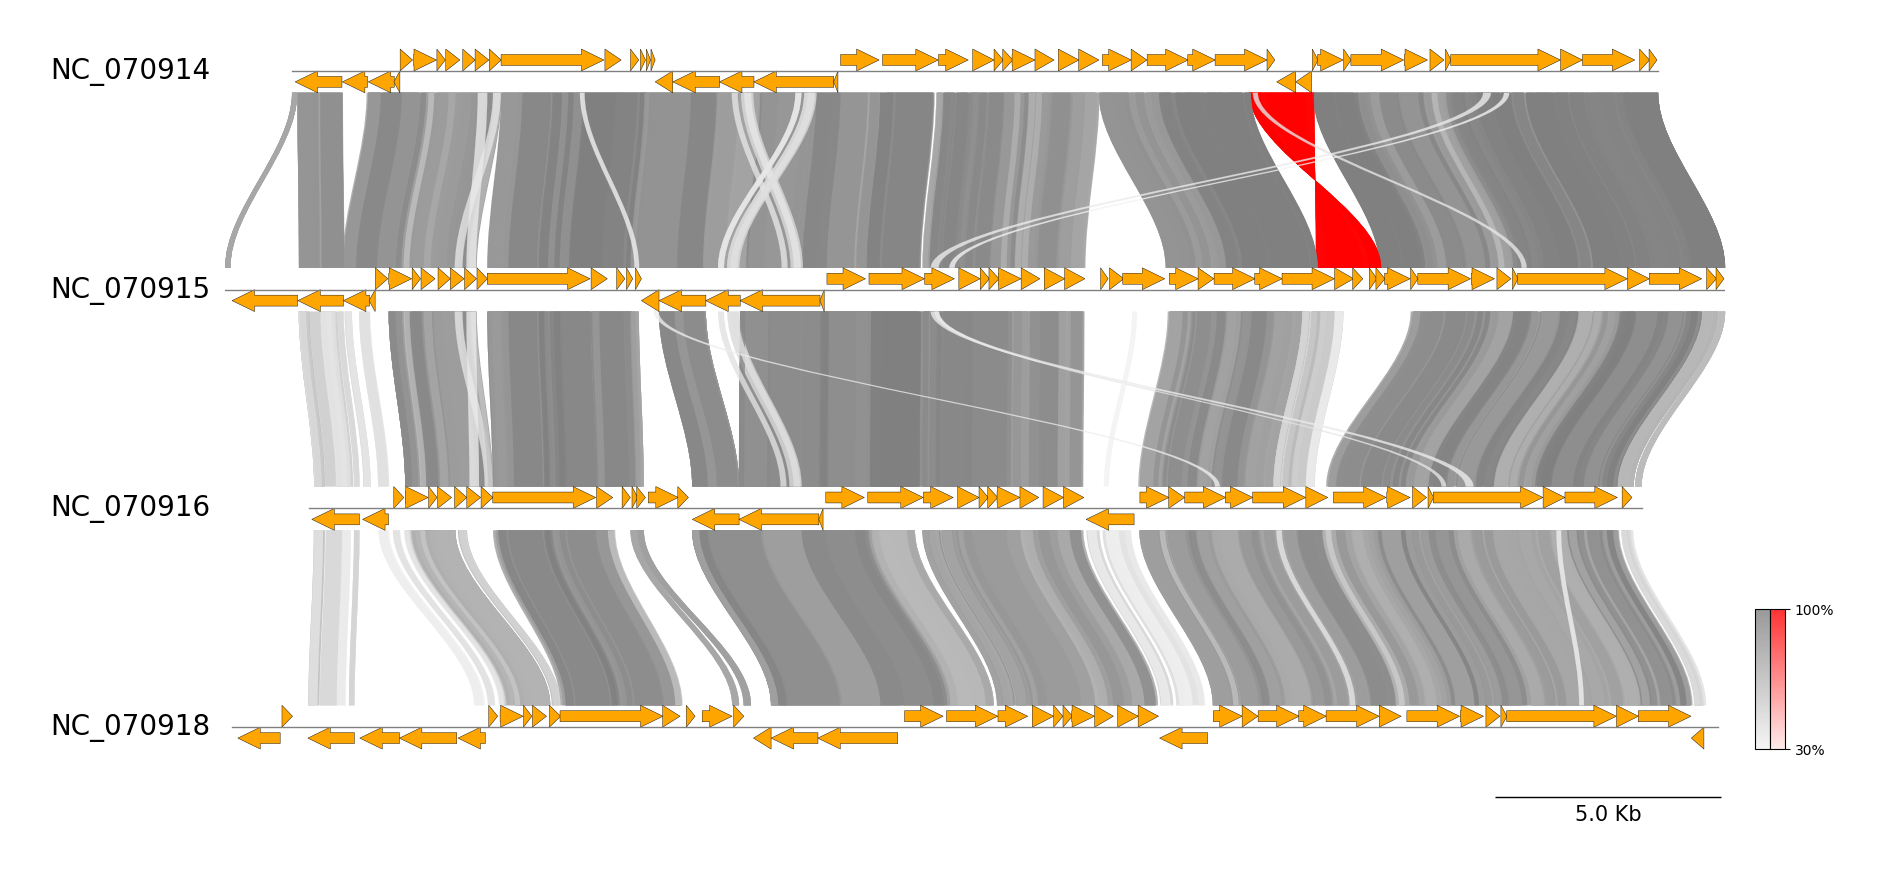
BLAST CLI Workflow
See pgv-blast document for details.
```shell
Download example dataset
pgv-download yersinia_phage
Run BLAST CLI workflow
pgv-blast NC070914.gbk NC070915.gbk NC070916.gbk NC070918.gbk \ -o pgv-blastexample --seqtype protein --showscalebar --curve \ --featurelinewidth 0.3 --lengththr 100 --identitythr 30 ```
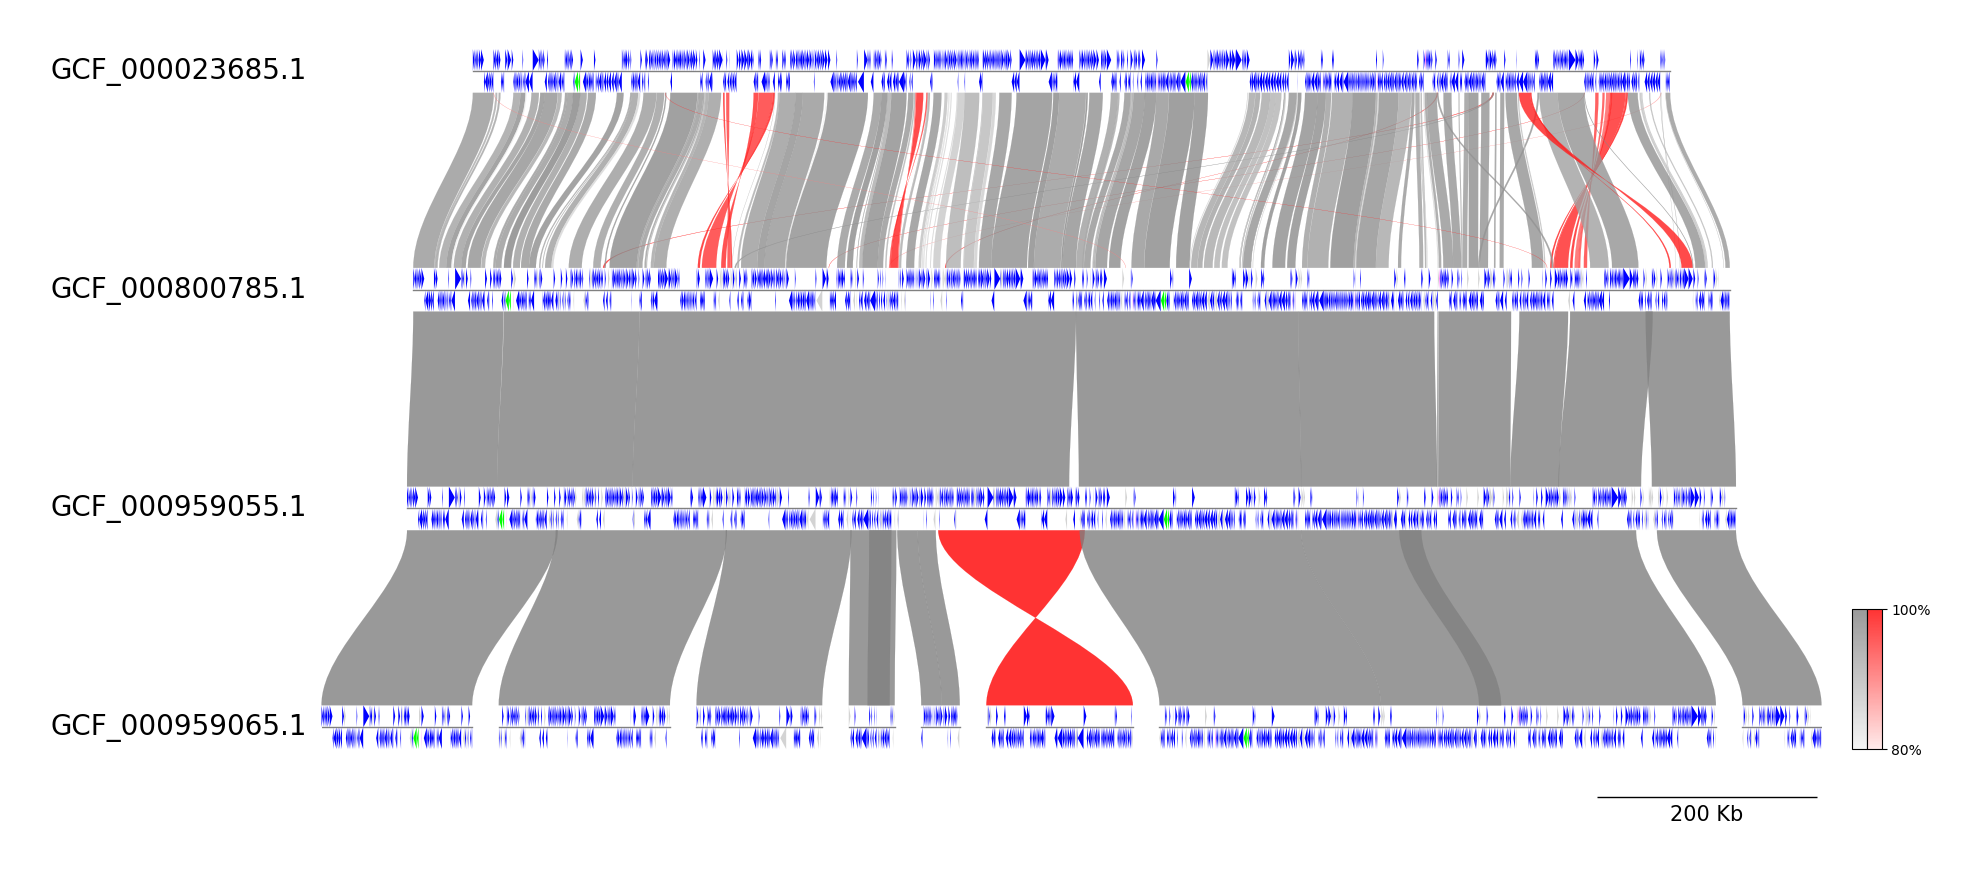
MUMmer CLI Workflow
See pgv-mummer document for details.
```shell
Download example dataset
pgv-download mycoplasma_mycoides
Run MUMmer CLI workflow
pgv-mummer GCF000023685.1.gbff GCF000800785.1.gbff GCF000959055.1.gbff GCF000959065.1.gbff \ -o pgv-mummerexample --showscalebar --curve \ --featuretype2color CDS:blue rRNA:lime tRNA:magenta ```
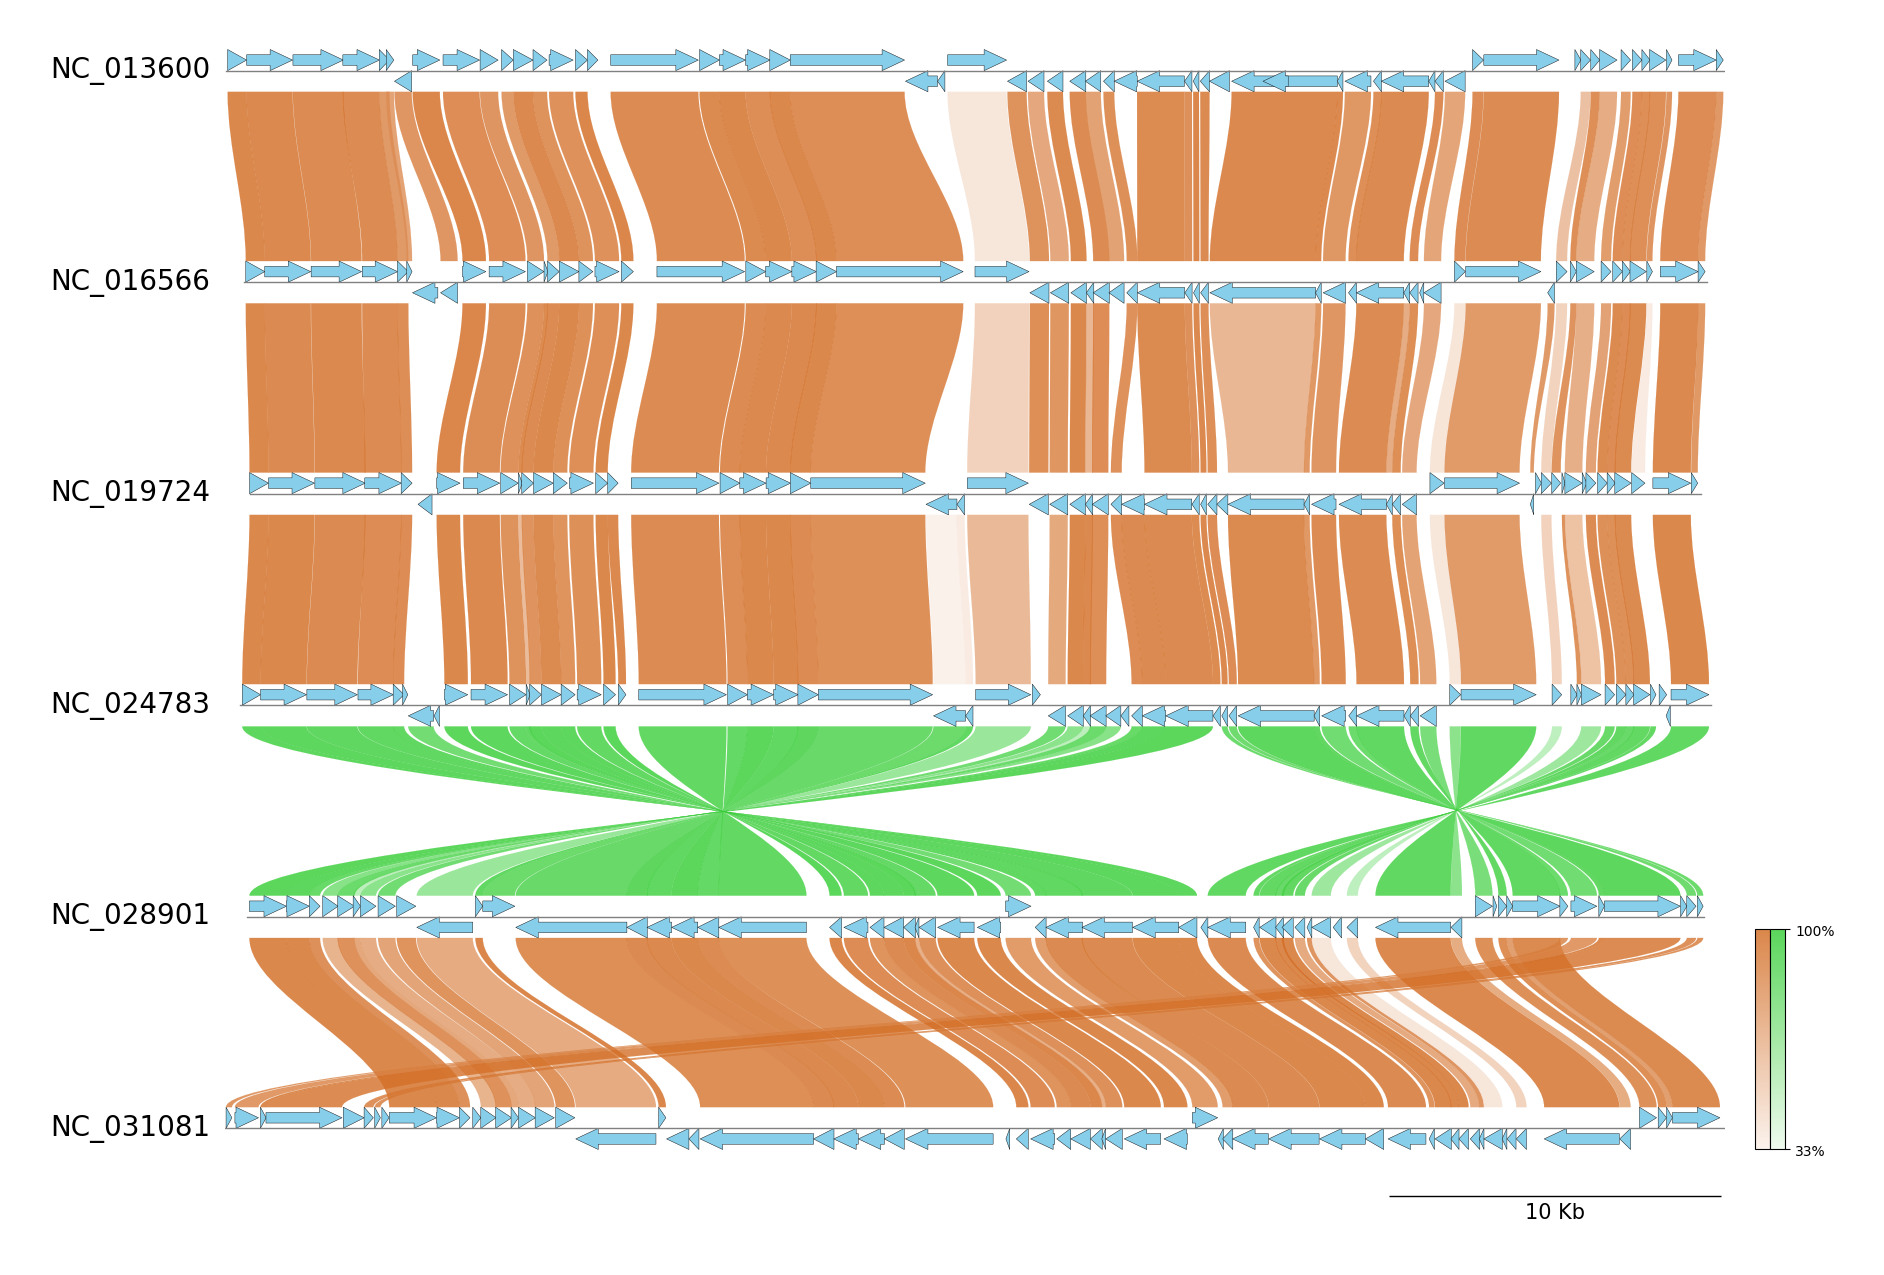
MMseqs CLI Workflow
See pgv-mmseqs document for details.
```shell
Download example dataset
pgv-download enterobacteria_phage
Run MMseqs CLI workflow
pgv-mmseqs NC013600.gbk NC016566.gbk NC019724.gbk NC024783.gbk NC028901.gbk NC031081.gbk \ -o pgv-mmseqsexample --showscalebar --curve --featurelinewidth 0.3 \ --featuretype2color CDS:skyblue --normallinkcolor chocolate --invertedlink_color limegreen ```
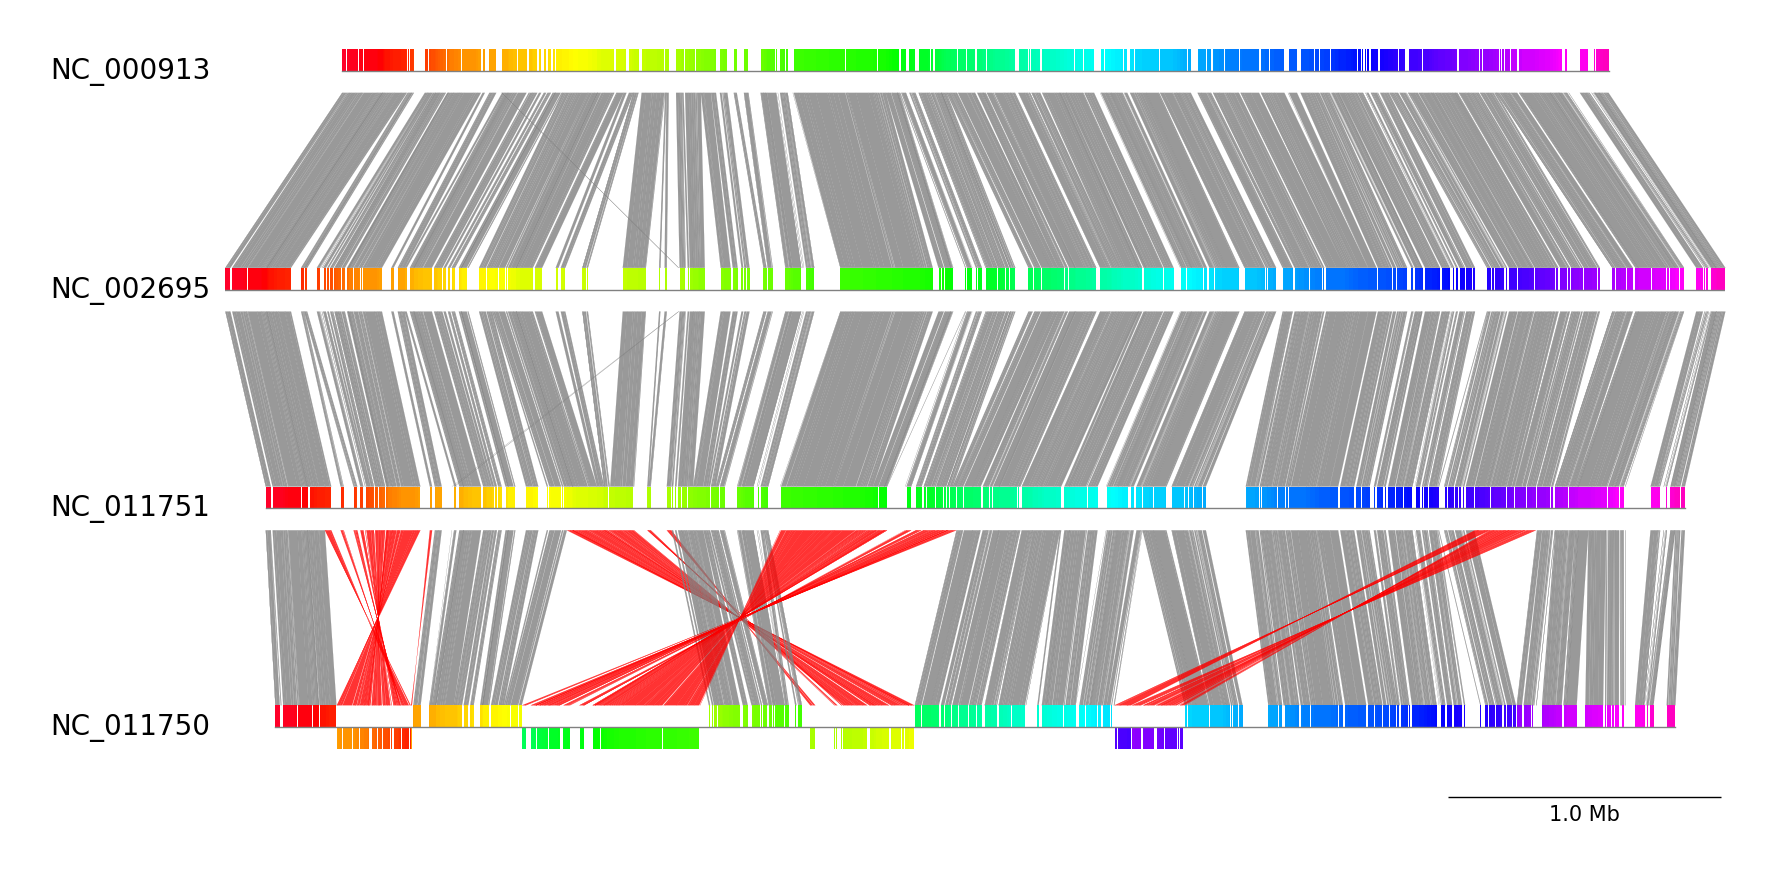
progressiveMauve CLI Workflow
See pgv-pmauve document for details.
```shell
Download example dataset
pgv-download escherichia_coli
Run progressiveMauve CLI workflow
pgv-pmauve NC000913.gbk.gz NC002695.gbk.gz NC011751.gbk.gz NC011750.gbk.gz \ -o pgv-pmauveexample --showscale_bar ```
GUI (Web Application)
pyGenomeViz implements GUI (Web Application) functionality using streamlit as an option. Users can easily visualize the genomic features in Genbank files and their comparison results with GUI (Demo Page). See pgv-gui document for details.
HTML Viewer
pyGenomeViz implements HTML viewer output functionality for interactive data visualization.
In API, HTML file can be output using savefig_html method. In CLI, user can select HTML file output option.
As shown below, pan/zoom, tooltip display, object color change, text change, etc are available in HTML viewer
(Demo Page1, Demo Page2).
Following libraries were used to implement HTML viewer.
- Spectrum: Colorpicker
- Panzoom: SVG panning and zooming
- Tabulator: Interactive Table
- Micromodal: Modal dialog
- Tippy.js: Tooltip
Inspiration
pyGenomeViz was inspired by
Circular Genome Visualization
pyGenomeViz is a python package designed for linear genome visualization. If you are interested in circular genome visualization, check out my other python package pyCirclize.
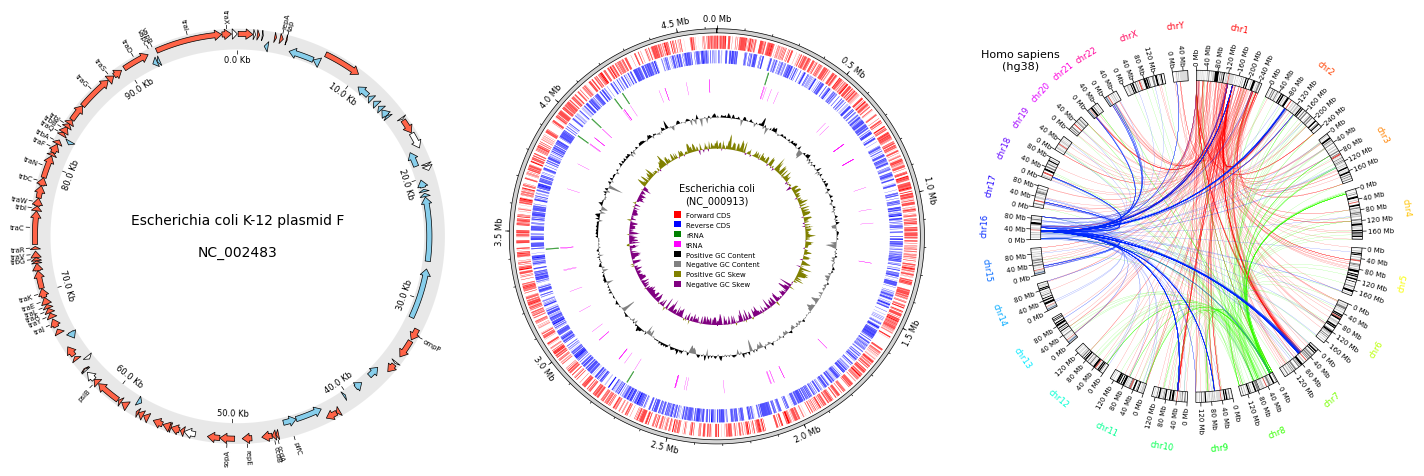
Fig. pyCirclize example plot gallery
Star History
Owner
- Name: moshi
- Login: moshi4
- Kind: user
- Repositories: 13
- Profile: https://github.com/moshi4
Web Developer / Bioinformatics / GIS
Citation (CITATION.cff)
cff-version: 1.2.0
message: If you use this software, please cite it as below.
authors:
  - family-names: Shimoyama
    given-names: Yuki
title: "pyGenomeViz: A genome visualization python package for comparative genomics"
date-released: 2024-05-18
url: https://github.com/moshi4/pyGenomeViz
GitHub Events
Total
- Create event: 6
- Commit comment event: 11
- Release event: 4
- Issues event: 27
- Watch event: 68
- Delete event: 4
- Issue comment event: 24
- Push event: 27
- Pull request event: 10
- Fork event: 1
Last Year
- Create event: 6
- Commit comment event: 11
- Release event: 4
- Issues event: 27
- Watch event: 68
- Delete event: 4
- Issue comment event: 24
- Push event: 27
- Pull request event: 10
- Fork event: 1
Committers
Last synced: about 1 year ago
Top Committers
| Name | Commits | |
|---|---|---|
| moshi | s****1@g****m | 463 |
| Marina Dyachkova | 7****a | 1 |
Issues and Pull Requests
Last synced: 10 months ago
All Time
- Total issues: 58
- Total pull requests: 19
- Average time to close issues: 18 days
- Average time to close pull requests: 1 day
- Total issue authors: 47
- Total pull request authors: 2
- Average comments per issue: 2.21
- Average comments per pull request: 0.21
- Merged pull requests: 18
- Bot issues: 0
- Bot pull requests: 0
Past Year
- Issues: 20
- Pull requests: 9
- Average time to close issues: 1 day
- Average time to close pull requests: 3 days
- Issue authors: 20
- Pull request authors: 2
- Average comments per issue: 1.3
- Average comments per pull request: 0.44
- Merged pull requests: 8
- Bot issues: 0
- Bot pull requests: 0
Top Authors
Issue Authors
- phyto (4)
- Dx-wmc (3)
- amara86 (2)
- mkarikom (2)
- KewinOgink (2)
- moshi4 (2)
- iaindhay (2)
- kneubehl (2)
- diekhans (2)
- UmutBarisTurna41 (1)
- chrissikath (1)
- chtsai0105 (1)
- mcn3159 (1)
- GM110Z (1)
- dadush1 (1)
Pull Request Authors
- moshi4 (23)
- msdyachkova (2)
Top Labels
Issue Labels
Pull Request Labels
Packages
- Total packages: 1
-
Total downloads:
- pypi 1,438 last-month
- Total dependent packages: 1
- Total dependent repositories: 1
- Total versions: 34
- Total maintainers: 1
pypi.org: pygenomeviz
A genome visualization python package for comparative genomics
- Documentation: https://pygenomeviz.readthedocs.io/
- License: MIT
-
Latest release: 1.6.1
published about 1 year ago
Rankings
Maintainers (1)
Dependencies
- 102 dependencies
- black ^22.3.0 develop
- flake8 ^4.0.1 develop
- ipykernel ^6.13.0 develop
- mkdocs ^1.2 develop
- mkdocs-jupyter ^0.21.0 develop
- mkdocs-material ^8.2 develop
- mkdocstrings ^0.19.0 develop
- pydocstyle ^6.1.1 develop
- pytest ^7.1.2 develop
- pytest-cov ^3.0.0 develop
- biopython ^1.79
- matplotlib ^3.5.2
- numpy ^1.21
- python ^3.7.1
- actions/checkout v3 composite
- actions/setup-python v4 composite
- actions/checkout v3 composite
- actions/setup-python v4 composite
- actions/checkout v3 composite
- actions/setup-python v4 composite
- actions/checkout v3 composite
- docker/build-push-action v3 composite
- docker/login-action v2 composite
- python 3.9-slim build