pymsaviz
MSA(Multiple Sequence Alignment) visualization python package for sequence analysis
Science Score: 44.0%
This score indicates how likely this project is to be science-related based on various indicators:
-
✓CITATION.cff file
Found CITATION.cff file -
✓codemeta.json file
Found codemeta.json file -
✓.zenodo.json file
Found .zenodo.json file -
○DOI references
-
○Academic publication links
-
○Committers with academic emails
-
○Institutional organization owner
-
○JOSS paper metadata
-
○Scientific vocabulary similarity
Low similarity (11.6%) to scientific vocabulary
Keywords
Repository
MSA(Multiple Sequence Alignment) visualization python package for sequence analysis
Basic Info
- Host: GitHub
- Owner: moshi4
- License: mit
- Language: Python
- Default Branch: main
- Homepage: https://moshi4.github.io/pyMSAviz
- Size: 7.2 MB
Statistics
- Stars: 144
- Watchers: 4
- Forks: 17
- Open Issues: 0
- Releases: 9
Topics
Metadata Files
README.md
pyMSAviz


![]()
Table of contents
Overview
pyMSAviz is a MSA(Multiple Sequence Alignment) visualization python package for sequence analysis implemented based on matplotlib. This package is developed for the purpose of easily and beautifully plotting MSA in Python. It also implements the functionality to add markers, text annotations, highlights to specific positions and ranges in MSA. pyMSAviz was developed inspired by Jalview and ggmsa. More detailed documentation is available here.
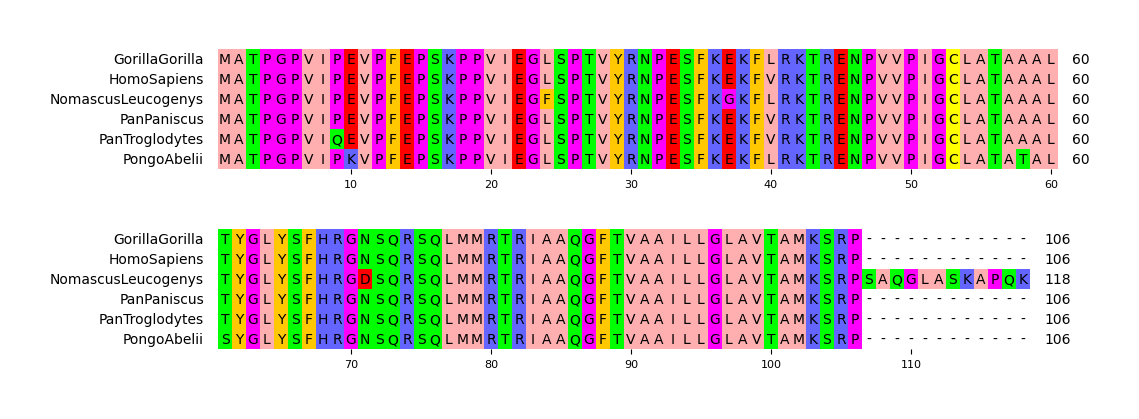
Fig.1 Simple visualization result
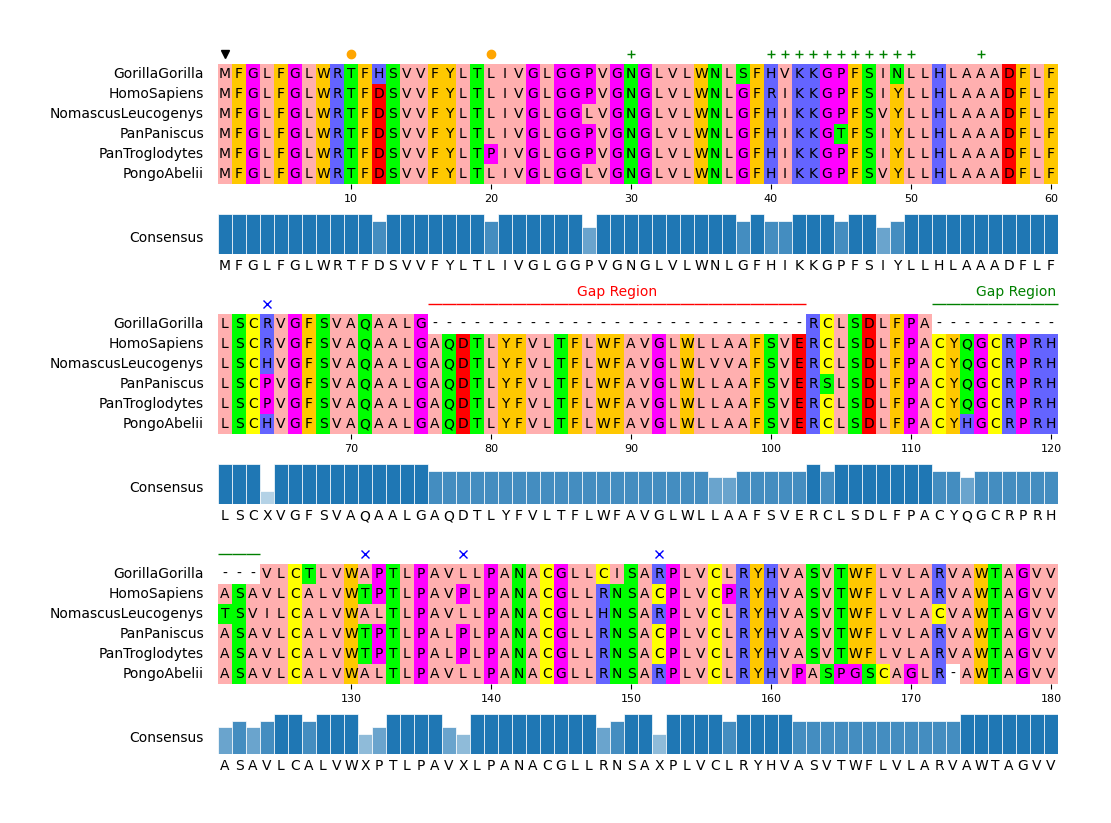
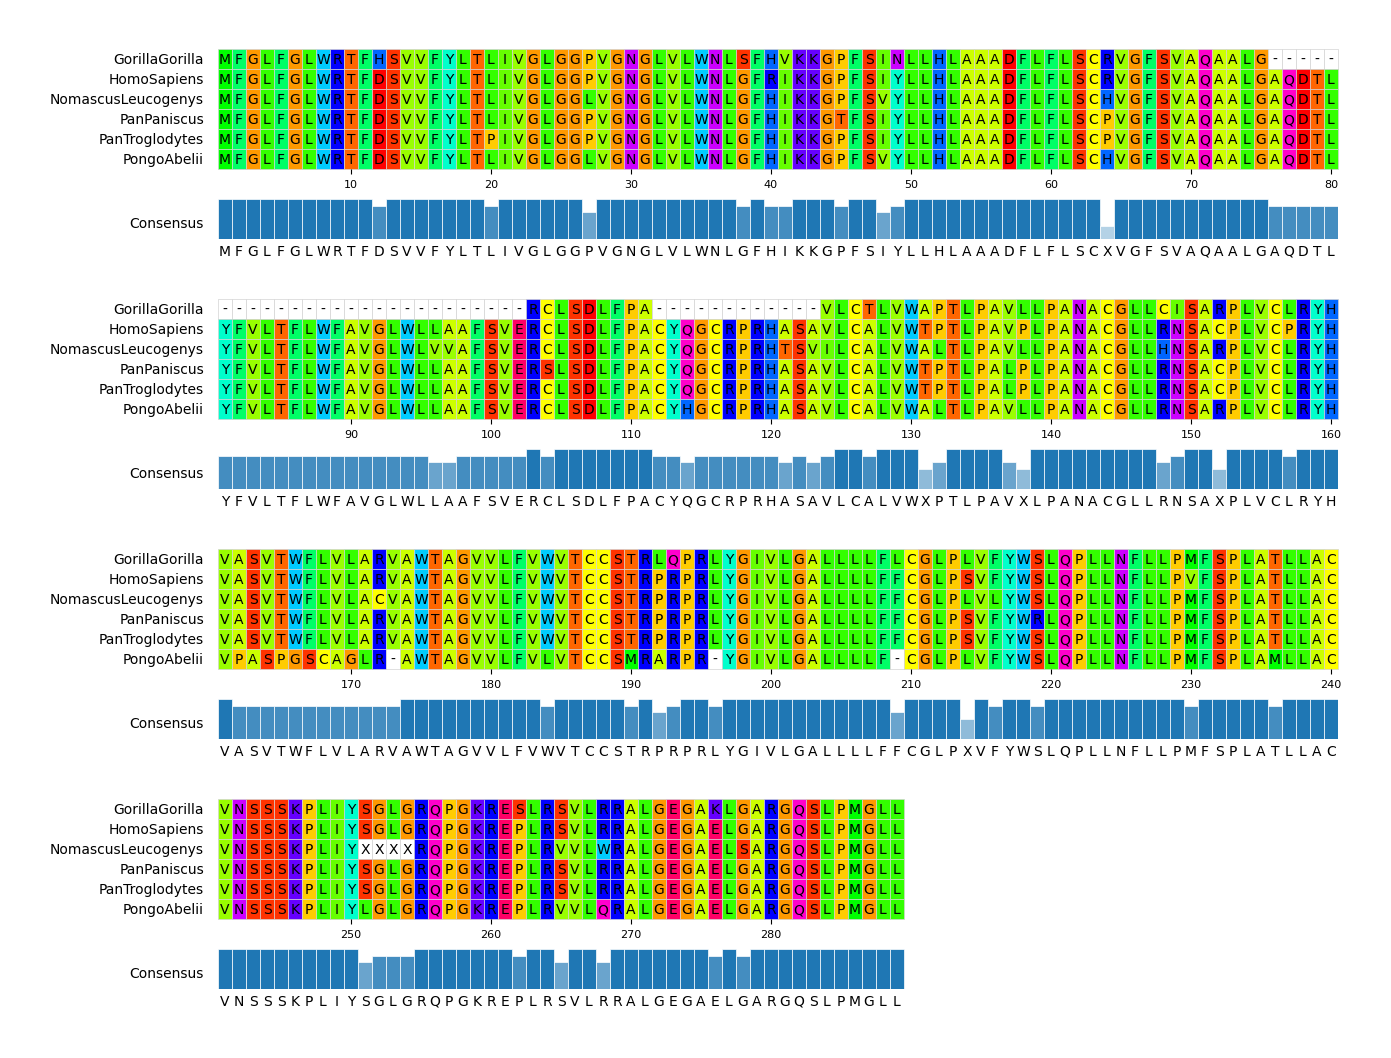
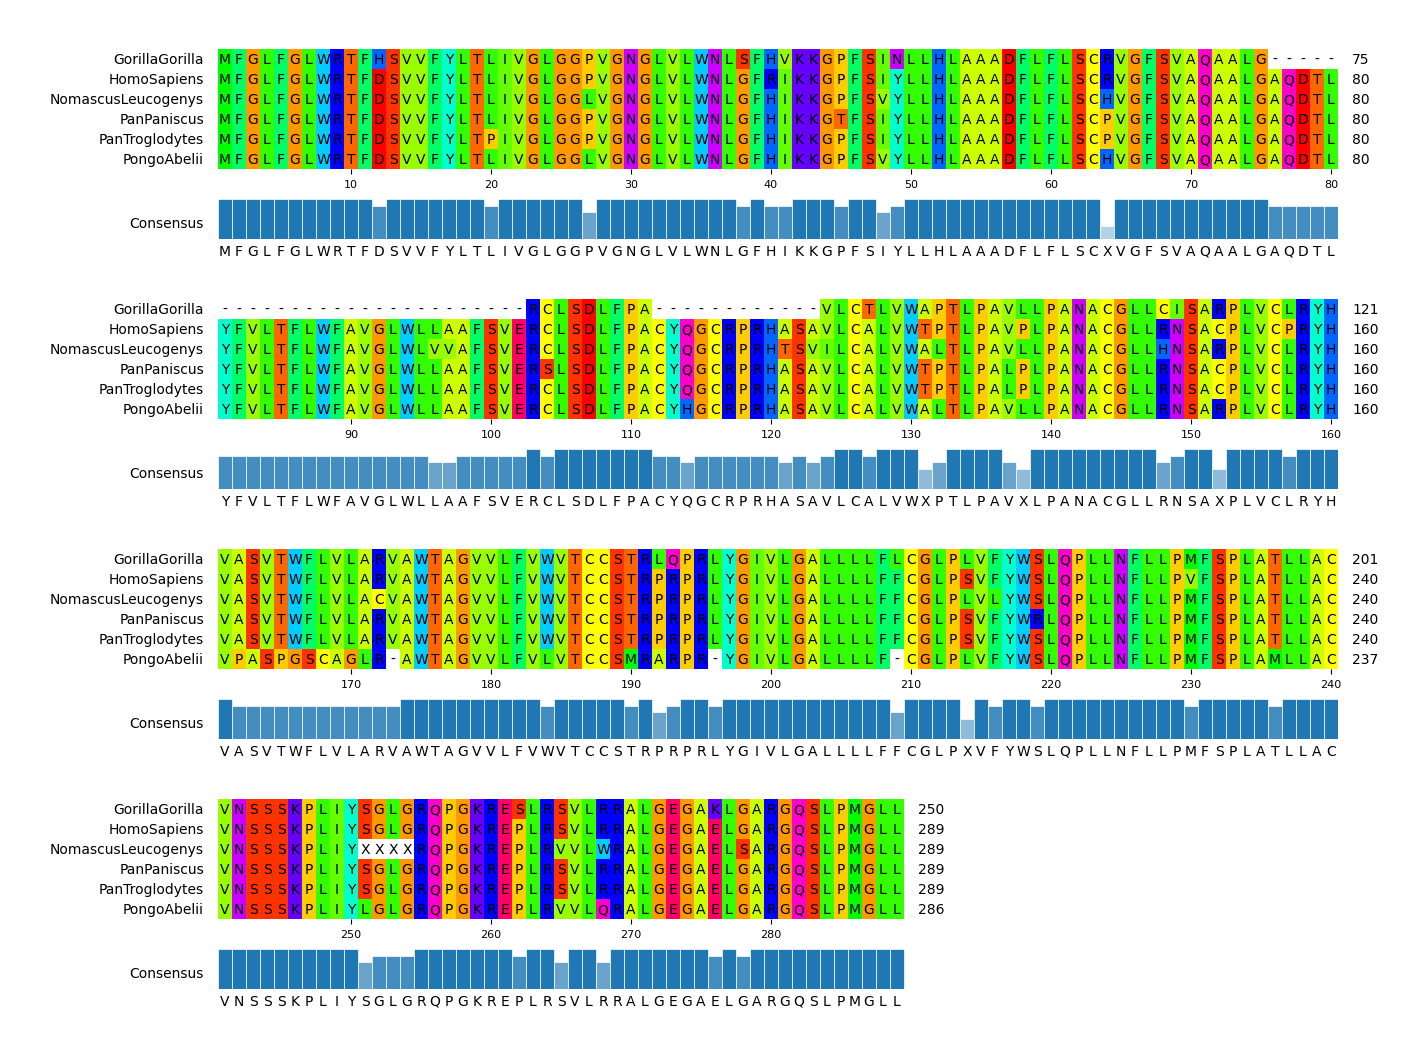
Fig.2 Customized visualization result
Installation
Python 3.9 or later is required for installation.
Install PyPI package:
pip install pymsaviz
Install bioconda package:
conda install -c conda-forge -c bioconda pymsaviz
API Usage
Only simple example usage is described in this section. For more details, please see Getting Started and API Docs.
API Example
API Example 1
```python from pymsaviz import MsaViz, getmsatestdata
msafile = getmsatestdata("HIGD2A.fa") mv = MsaViz(msafile, wraplength=60, showcount=True) mv.savefig("api_example01.png") ```
API Example 2
```python from pymsaviz import MsaViz, getmsatestdata
msafile = getmsatestdata("MRGPRG.fa") mv = MsaViz(msafile, colorscheme="Taylor", wraplength=80, showgrid=True, showconsensus=True) mv.savefig("api_example02.png") ```
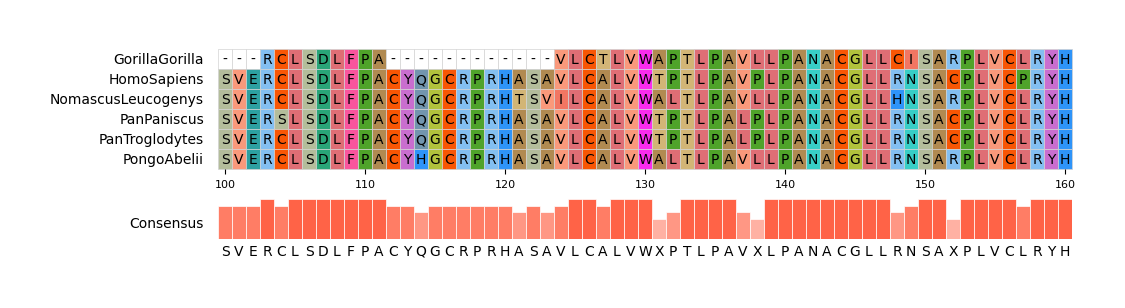
API Example 3
```python from pymsaviz import MsaViz, getmsatestdata
msafile = getmsatestdata("MRGPRG.fa") mv = MsaViz(msafile, end=180, wraplength=60, showconsensus=True)
Extract MSA positions less than 50% consensus identity
posidentlessthan50 = [] identlist = mv.getconsensusidentitylist() for pos, ident in enumerate(identlist, 1): if ident <= 50: posidentlessthan50.append(pos)
Add markers
mv.addmarkers([1]) mv.addmarkers([10, 20], color="orange", marker="o") mv.addmarkers([30, (40, 50), 55], color="green", marker="+") mv.addmarkers(posidentlessthan50, marker="x", color="blue")
Add text annotations
mv.addtextannotation((76, 102), "Gap Region", textcolor="red", rangecolor="red") mv.addtextannotation((112, 123), "Gap Region", textcolor="green", rangecolor="green")
mv.savefig("api_example03.png") ```
CLI Usage
pyMSAviz provides simple MSA visualization CLI.
Basic Command
pymsaviz -i [MSA file] -o [MSA visualization file]
Options
$ pymsaviz --help
usage: pymsaviz [options] -i msa.fa -o msa_viz.png

MSA(Multiple Sequence Alignment) visualization CLI tool

optional arguments:
  -i I, --infile I    Input MSA file
  -o O, --outfile O   Output MSA visualization file (*.png|*.jpg|*.svg|*.pdf)
  --format            MSA file format (Default: 'fasta')
  --color_scheme      Color scheme (Default: 'Zappo')
  --start             Start position of MSA visualization (Default: 1)
  --end               End position of MSA visualization (Default: 'MSA Length')
  --wrap_length       Wrap length (Default: None)
  --wrap_space_size   Space size between wrap MSA plot area (Default: 3.0)
  --label_type        Label type ('id'[default]|'description')
  --show_grid         Show grid (Default: OFF)
  --show_count        Show seq char count without gap on right side (Default: OFF)
  --show_consensus    Show consensus sequence (Default: OFF)
  --consensus_color   Consensus identity bar color (Default: '#1f77b4')
  --consensus_size    Consensus identity bar height size (Default: 2.0)
  --sort              Sort MSA order by NJ tree constructed from MSA distance matrix (Default: OFF)
  --dpi               Figure DPI (Default: 300)
  -v, --version       Print version information
  -h, --help          Show this help message and exit

Available Color Schemes:
['Clustal', 'Zappo', 'Taylor', 'Flower', 'Blossom', 'Sunset', 'Ocean', 'Hydrophobicity', 'HelixPropensity', 'StrandPropensity', 'TurnPropensity', 'BuriedIndex', 'Nucleotide', 'Purine/Pyrimidine', 'Identity', 'None']
CLI Example
Click here to download example MSA files.
CLI Example 1
pymsaviz -i ./example/HIGD2A.fa -o cli_example01.png --color_scheme Identity
CLI Example 2
pymsaviz -i ./example/MRGPRG.fa -o cli_example02.png --wrap_length 80 \
         --color_scheme Taylor --show_consensus --show_count
CLI Example 3
pymsaviz -i ./example/MRGPRG.fa -o cli_example03.png --start 100 --end 160 \
         --color_scheme Flower --show_grid --show_consensus --consensus_color tomato
Star History
Owner
- Name: moshi
- Login: moshi4
- Kind: user
- Repositories: 13
- Profile: https://github.com/moshi4
Web Developer / Bioinformatics / GIS
Citation (CITATION.cff)
cff-version: 1.2.0
message: If you use this software, please cite it as below.
authors:
  - family-names: Shimoyama
    given-names: Yuki
title: "pyMSAviz: MSA visualization python package for sequence analysis"
date-released: 2022-11-13
url: https://github.com/moshi4/pyMSAviz
GitHub Events
Total
- Issues event: 3
- Watch event: 54
- Delete event: 1
- Issue comment event: 2
- Push event: 1
- Fork event: 4
- Create event: 1
Last Year
- Issues event: 3
- Watch event: 54
- Delete event: 1
- Issue comment event: 2
- Push event: 1
- Fork event: 4
- Create event: 1
Issues and Pull Requests
Last synced: 11 months ago
All Time
- Total issues: 12
- Total pull requests: 4
- Average time to close issues: 13 days
- Average time to close pull requests: 4 days
- Total issue authors: 12
- Total pull request authors: 2
- Average comments per issue: 2.5
- Average comments per pull request: 0.25
- Merged pull requests: 3
- Bot issues: 0
- Bot pull requests: 0
Past Year
- Issues: 4
- Pull requests: 1
- Average time to close issues: about 14 hours
- Average time to close pull requests: 3 minutes
- Issue authors: 4
- Pull request authors: 1
- Average comments per issue: 1.5
- Average comments per pull request: 0.0
- Merged pull requests: 1
- Bot issues: 0
- Bot pull requests: 0
Top Authors
Issue Authors
- StefanoLonardi (1)
- ahishsujay (1)
- tonytony99 (1)
- baozg (1)
- thomashjordan (1)
- Yogesh1-11 (1)
- cx994 (1)
- BadSpellign (1)
- alejandrogzi (1)
- heejongkim (1)
- 0xorial (1)
- camilogarciabotero (1)
Pull Request Authors
- moshi4 (3)
- tvieijra (1)
Top Labels
Issue Labels
Pull Request Labels
Packages
- Total packages: 1
-
Total downloads:
- pypi 7,299 last-month
- Total dependent packages: 2
- Total dependent repositories: 0
- Total versions: 9
- Total maintainers: 1
pypi.org: pymsaviz
MSA visualization python package for sequence analysis
- Documentation: https://pymsaviz.readthedocs.io/
- License: mit
-
Latest release: 0.5.0
published almost 2 years ago
Rankings
Maintainers (1)
Dependencies
- 104 dependencies
- black ^22.10.0 develop
- flake8 ^4.0.1 develop
- ipykernel ^6.16.0 develop
- mkdocs ^1.2 develop
- mkdocs-jupyter ^0.21.0 develop
- mkdocs-material ^8.2 develop
- mkdocstrings 0.19.0 develop
- pydocstyle ^6.1.1 develop
- pytest ^7.2.0 develop
- pytest-cov ^4.0.0 develop
- biopython ^1.79
- matplotlib ^3.5.2
- python ^3.7.1
- actions/checkout v3 composite
- actions/setup-python v4 composite
- actions/checkout v3 composite
- actions/setup-python v4 composite
- actions/checkout v3 composite
- actions/setup-python v4 composite