aniclustermap
A tool for drawing ANI clustermap between all-vs-all microbial genomes
Science Score: 26.0%
This score indicates how likely this project is to be science-related based on various indicators:
-
○CITATION.cff file
-
✓codemeta.json file
Found codemeta.json file -
✓.zenodo.json file
Found .zenodo.json file -
○DOI references
-
○Academic publication links
-
○Committers with academic emails
-
○Institutional organization owner
-
○JOSS paper metadata
-
○Scientific vocabulary similarity
Low similarity (9.4%) to scientific vocabulary
Keywords
Repository
A tool for drawing ANI clustermap between all-vs-all microbial genomes
Basic Info
Statistics
- Stars: 80
- Watchers: 3
- Forks: 10
- Open Issues: 0
- Releases: 7
Topics
Metadata Files
README.md
ANIclustermap


Overview
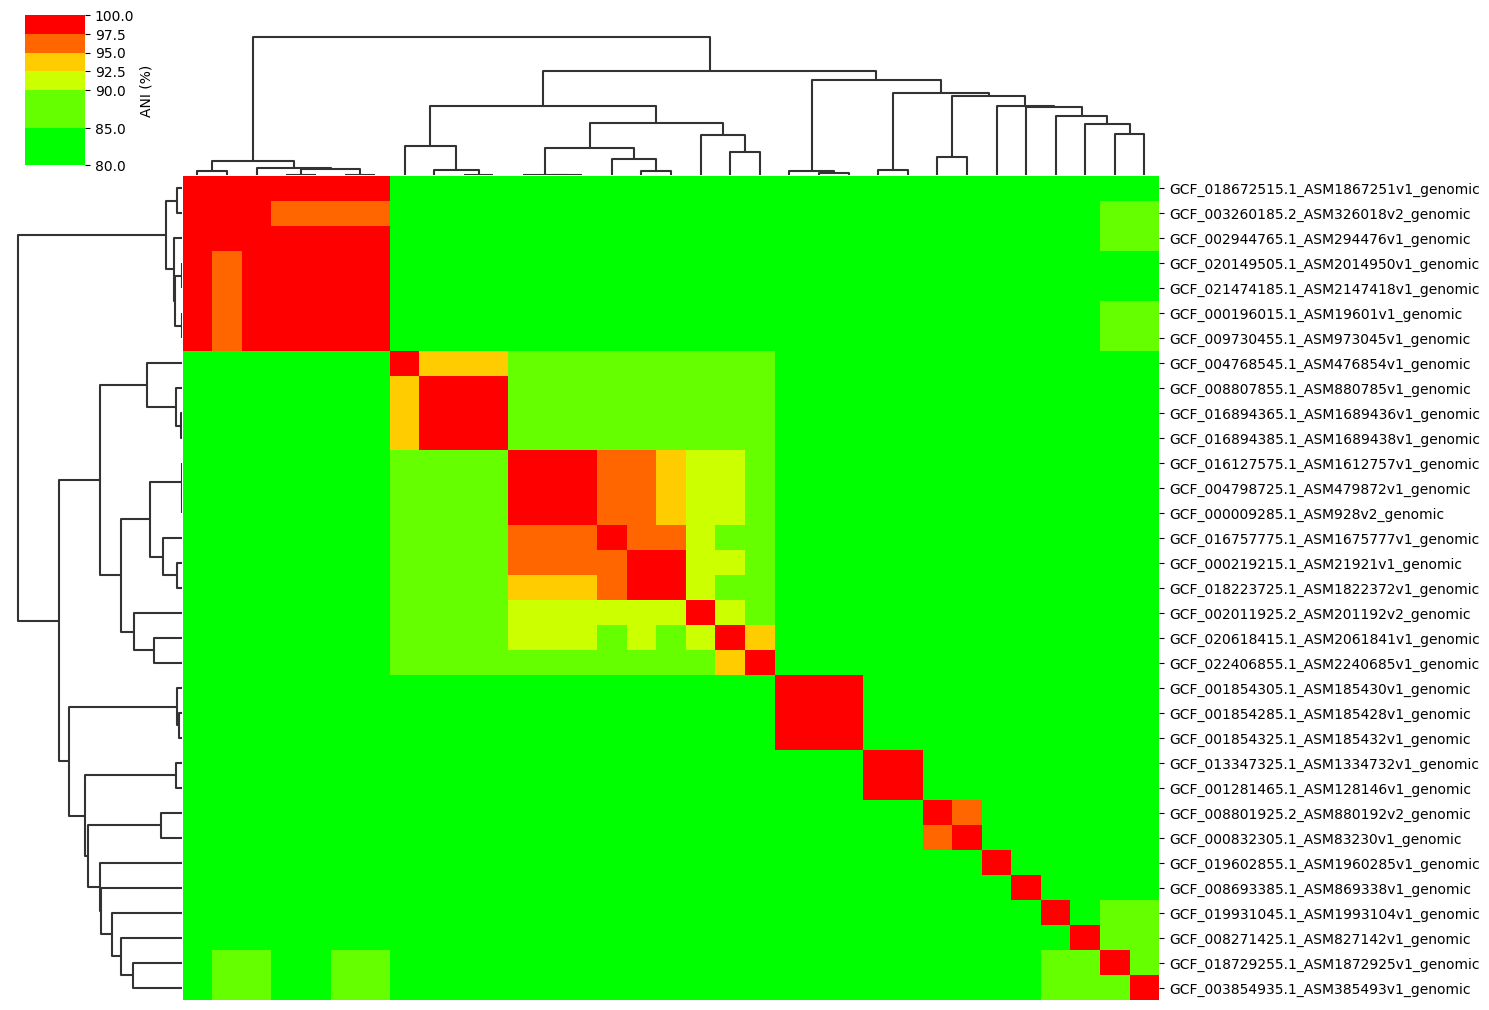
ANIclustermap is easy-to-use tool for drawing ANI(Average Nucleotide Identity) clustermap between all-vs-all microbial genomes. ANI between all-vs-all genomes are calculated by fastANI (or skani) and clustermap is drawn using seaborn.
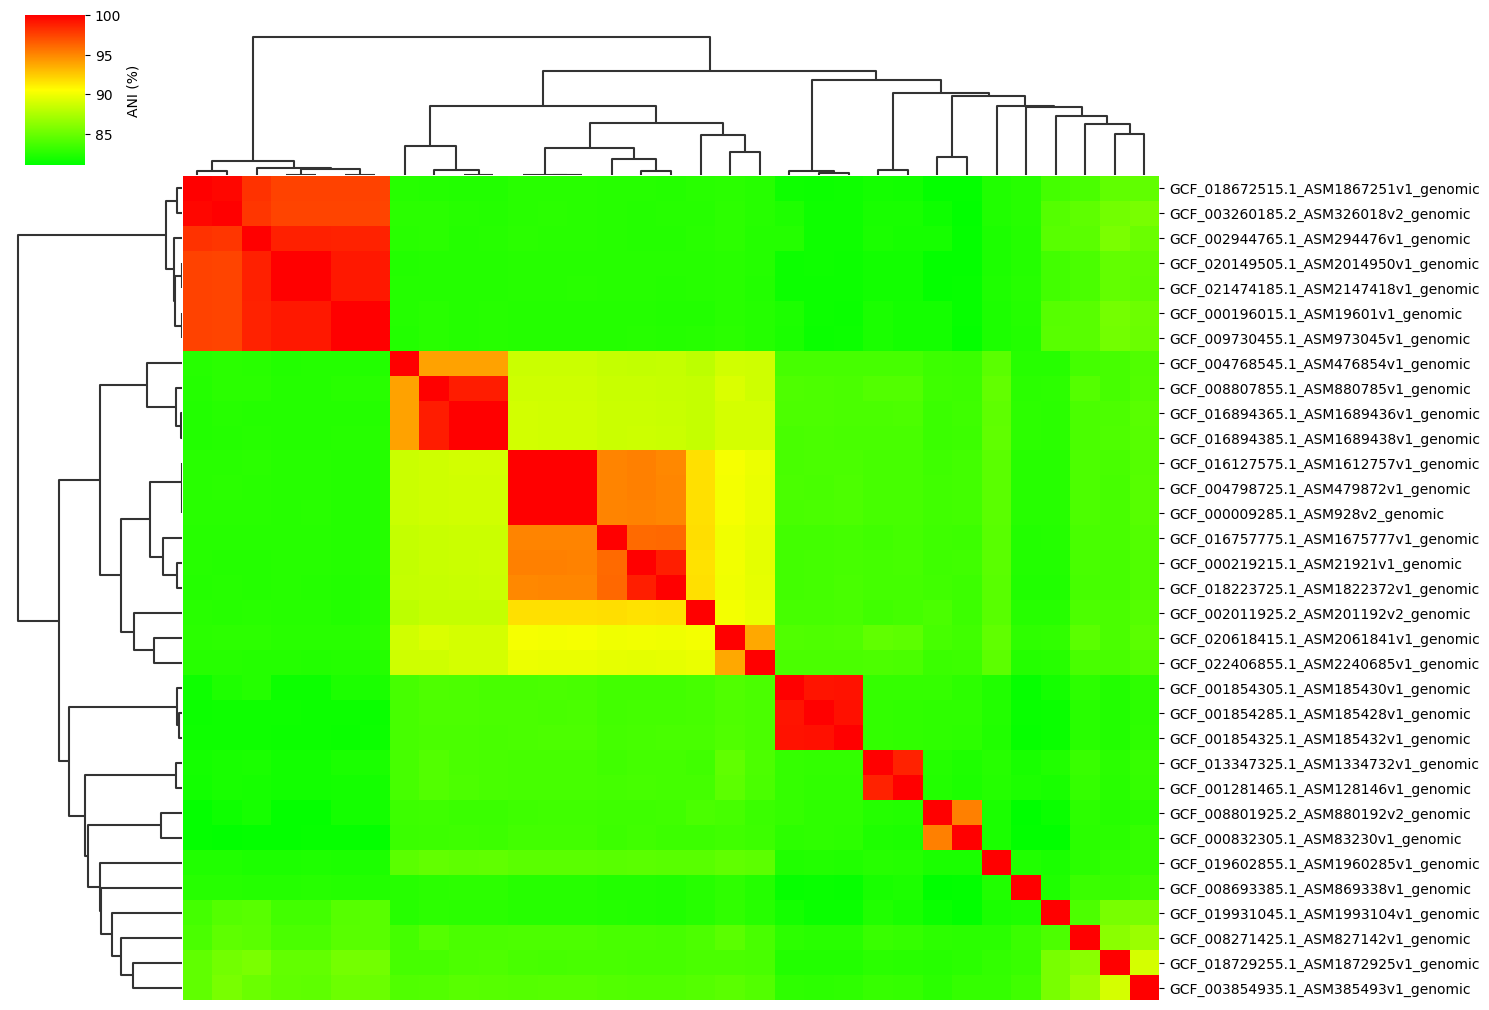
Fig1. ANI clustermap between all-vs-all 33 genomes.
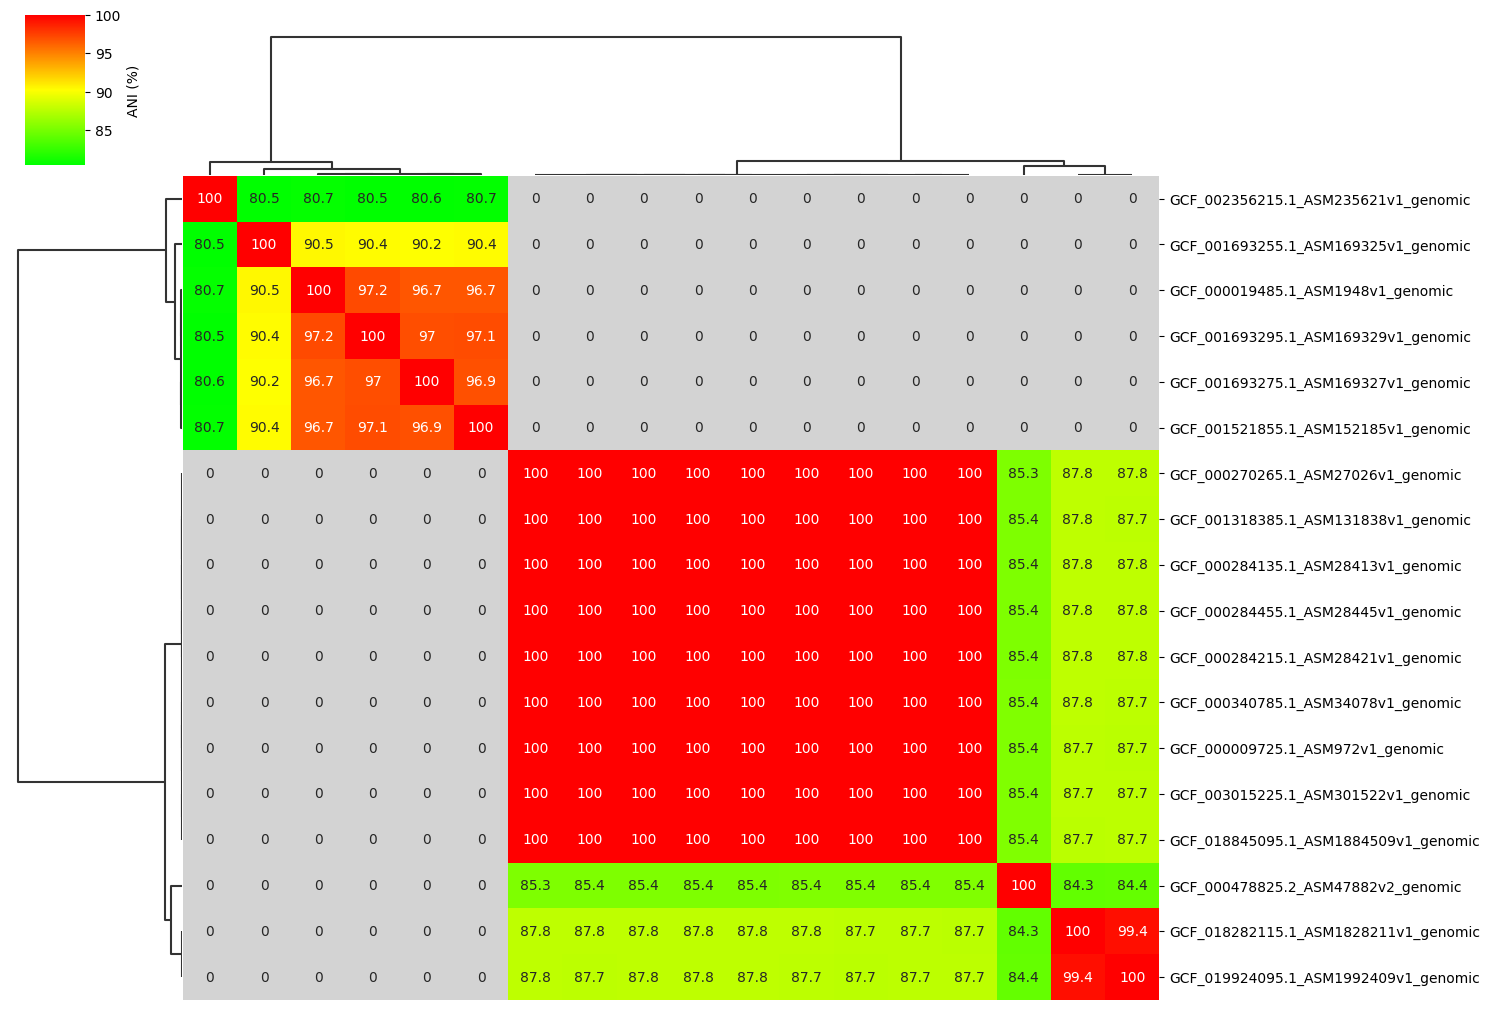
Fig2. ANI clustermap between all-vs-all 18 genomes. If no similarity detected by fastANI, filled in gray.
Installation
Python 3.9 or later is required for installation.
fastANI or skani is required to calculate ANI.
Install bioconda package:
conda install -c conda-forge -c bioconda aniclustermap
Install PyPI stable package:
pip install aniclustermap
Workflow
Description of ANIclustermap's automated workflow.
- Calculate ANI between all-vs-all microbial genomes by fastANI (or skani).
If no similarity detected by fastANI, NA is output. In that case, NA is replaced by 0.0.
If previous result available at the time of re-run, reuse previous result. - Clustering ANI matrix by scipy UPGMA method.
- Using clustered matrix, draw ANI clustermap by seaborn.
Usage
Basic Command
ANIclustermap -i [Genome fasta directory] -o [output directory]
Options
$ ANIclustermap --help

Usage: ANIclustermap [OPTIONS]

Draw ANI(Average Nucleotide Identity) clustermap

 Options
 *  --indir             -i        Input genome fasta directory (*.fa|*.fna[.gz]|*.fasta) [required]
 *  --outdir            -o        Output directory [required]
    --mode                        ANI calculation tool (fastani|skani) [default: fastani]
    --thread_num        -t        Thread number parameter [default: MaxThread - 1]
    --overwrite                   Overwrite previous ANI calculation result
    --fig_width                   Figure width [default: 10]
    --fig_height                  Figure height [default: 10]
    --dendrogram_ratio            Dendrogram ratio to figsize [default: 0.15]
    --cmap_colors                 cmap interpolation colors parameter [default: lime,yellow,red]
    --cmap_gamma                  cmap gamma parameter [default: 1.0]
    --cmap_ranges                 Range values (e.g. 80,90,95,100) for discrete cmap
    --cbar_pos                    Colorbar position [default: 0.02, 0.85, 0.04, 0.15]
    --annotation                  Show ANI value annotation
    --annotation_fmt              Annotation value format [default: .3g]
    --quiet                       No print log on screen
    --version           -v        Print version information
    --help              -h        Show this message and exit.
Example Command
7 genomes minimal dataset. Click here to download dataset.
ANIclustermap -i ./minimal_dataset/ -o ./ANIclustermap_result
Output Contents
ANIclustermap outputs 3 types of result files.
ANIclustermap.[png|svg](example1, example2)
ANI clustermap result figure.ANIclustermap_matrix.tsv(example)
Clustered all-vs-all ANI matrix.ANIclustermap_dendrogram.nwk(example)
Newick format clustering dendrogram.
Gallery
Example gallery of 33 genomes normal dataset.
If you want to try it for yourself, click here to donwload dataset.
Normal parameter:
ANIclustermap -i ./normal_dataset -o ./ANIclustermap_result01 \
              --fig_width 15

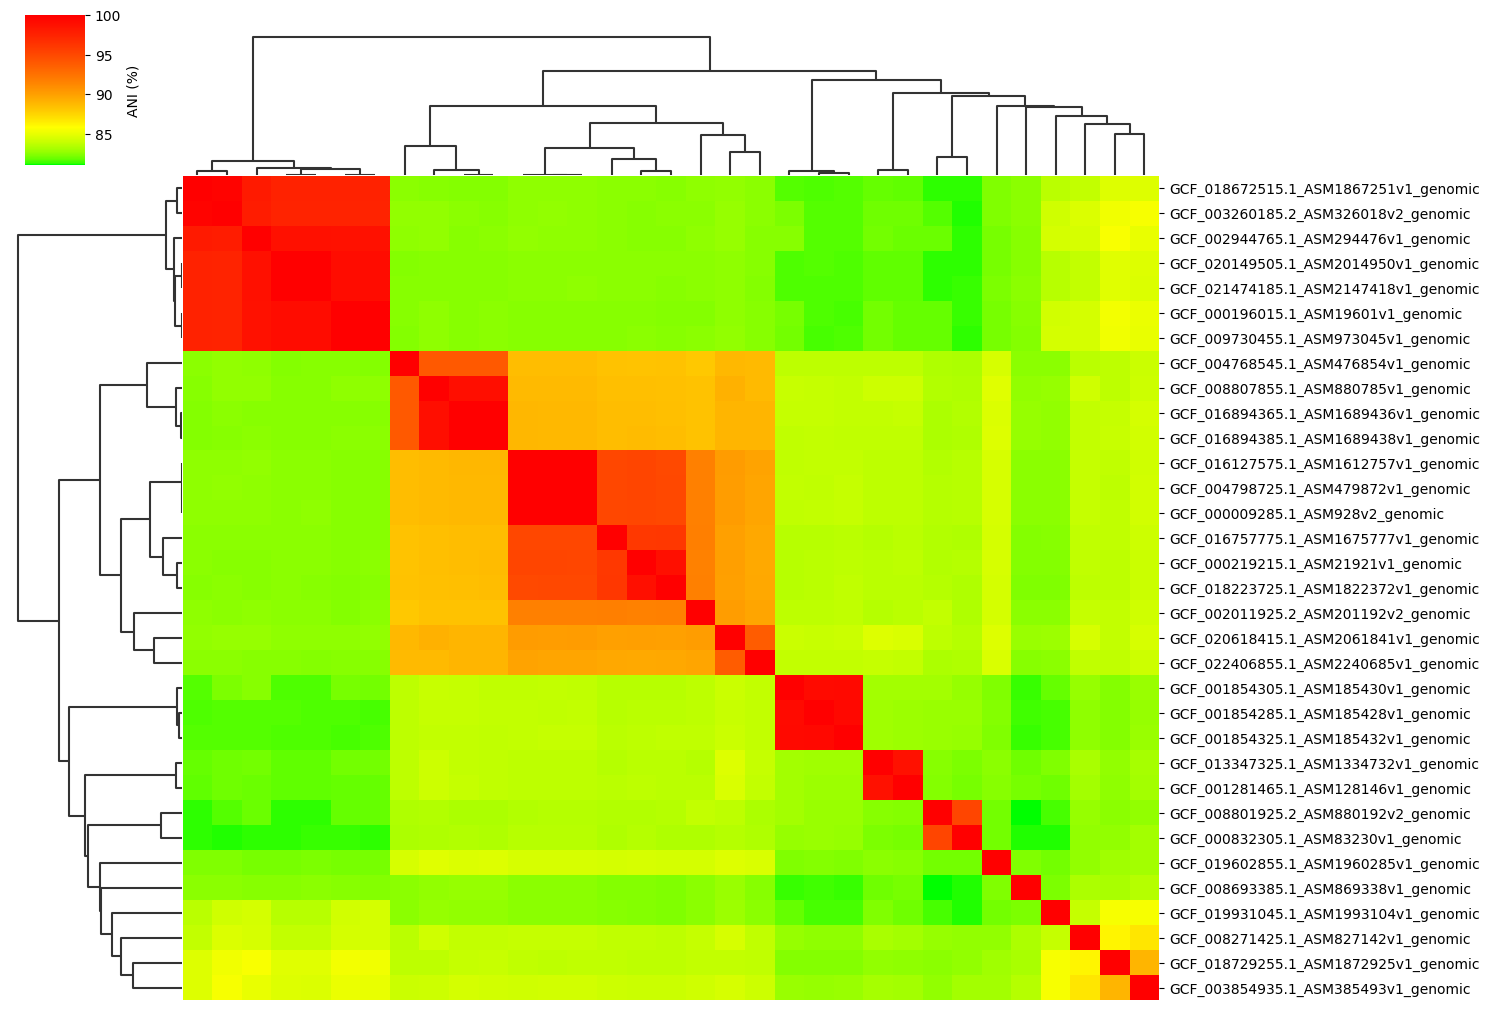
Change cmap_gamma parameter:
ANIclustermap -i ./normal_dataset -o ./ANIclustermap_result02 \
              --fig_width 15 --cmap_gamma 0.5
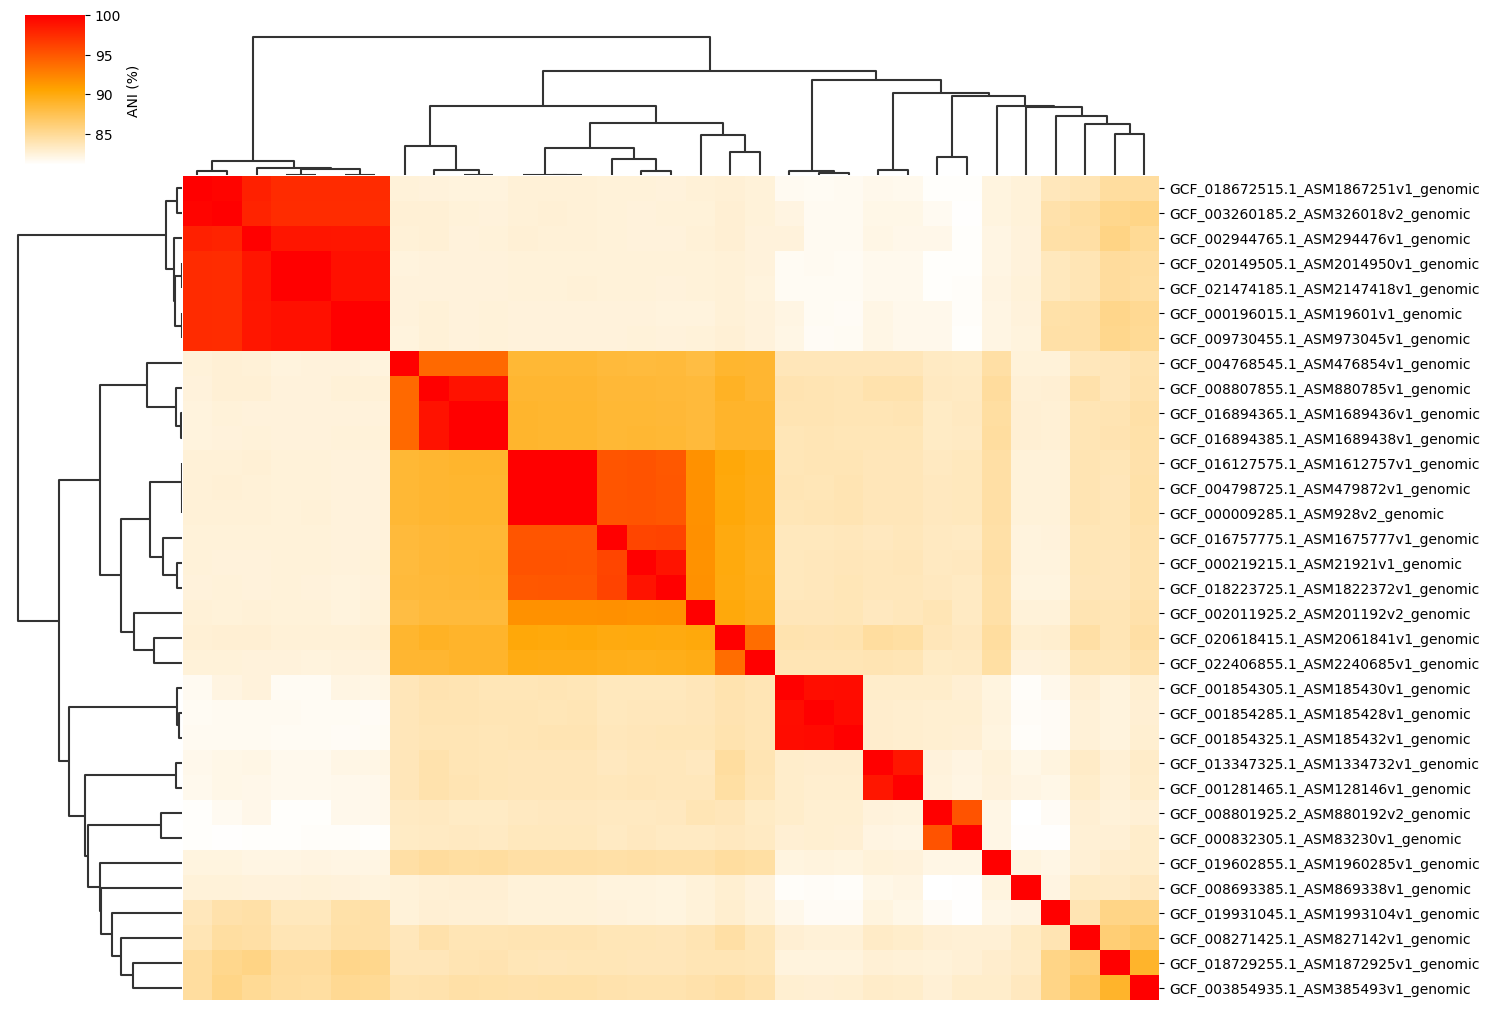
Change cmap_colors(=white,orange,red) paramter:
ANIclustermap -i ./normal_dataset -o ./ANIclustermap_result03 \
              --fig_width 15 --cmap_colors white,orange,red
Change cmap_ranges paramter:
ANIclustermap -i ./normal_dataset -o ./ANIclustermap_result04 \
              --fig_width 15 --cmap_ranges 80,85,90,92.5,95,97.5,100
See this issue for more details.
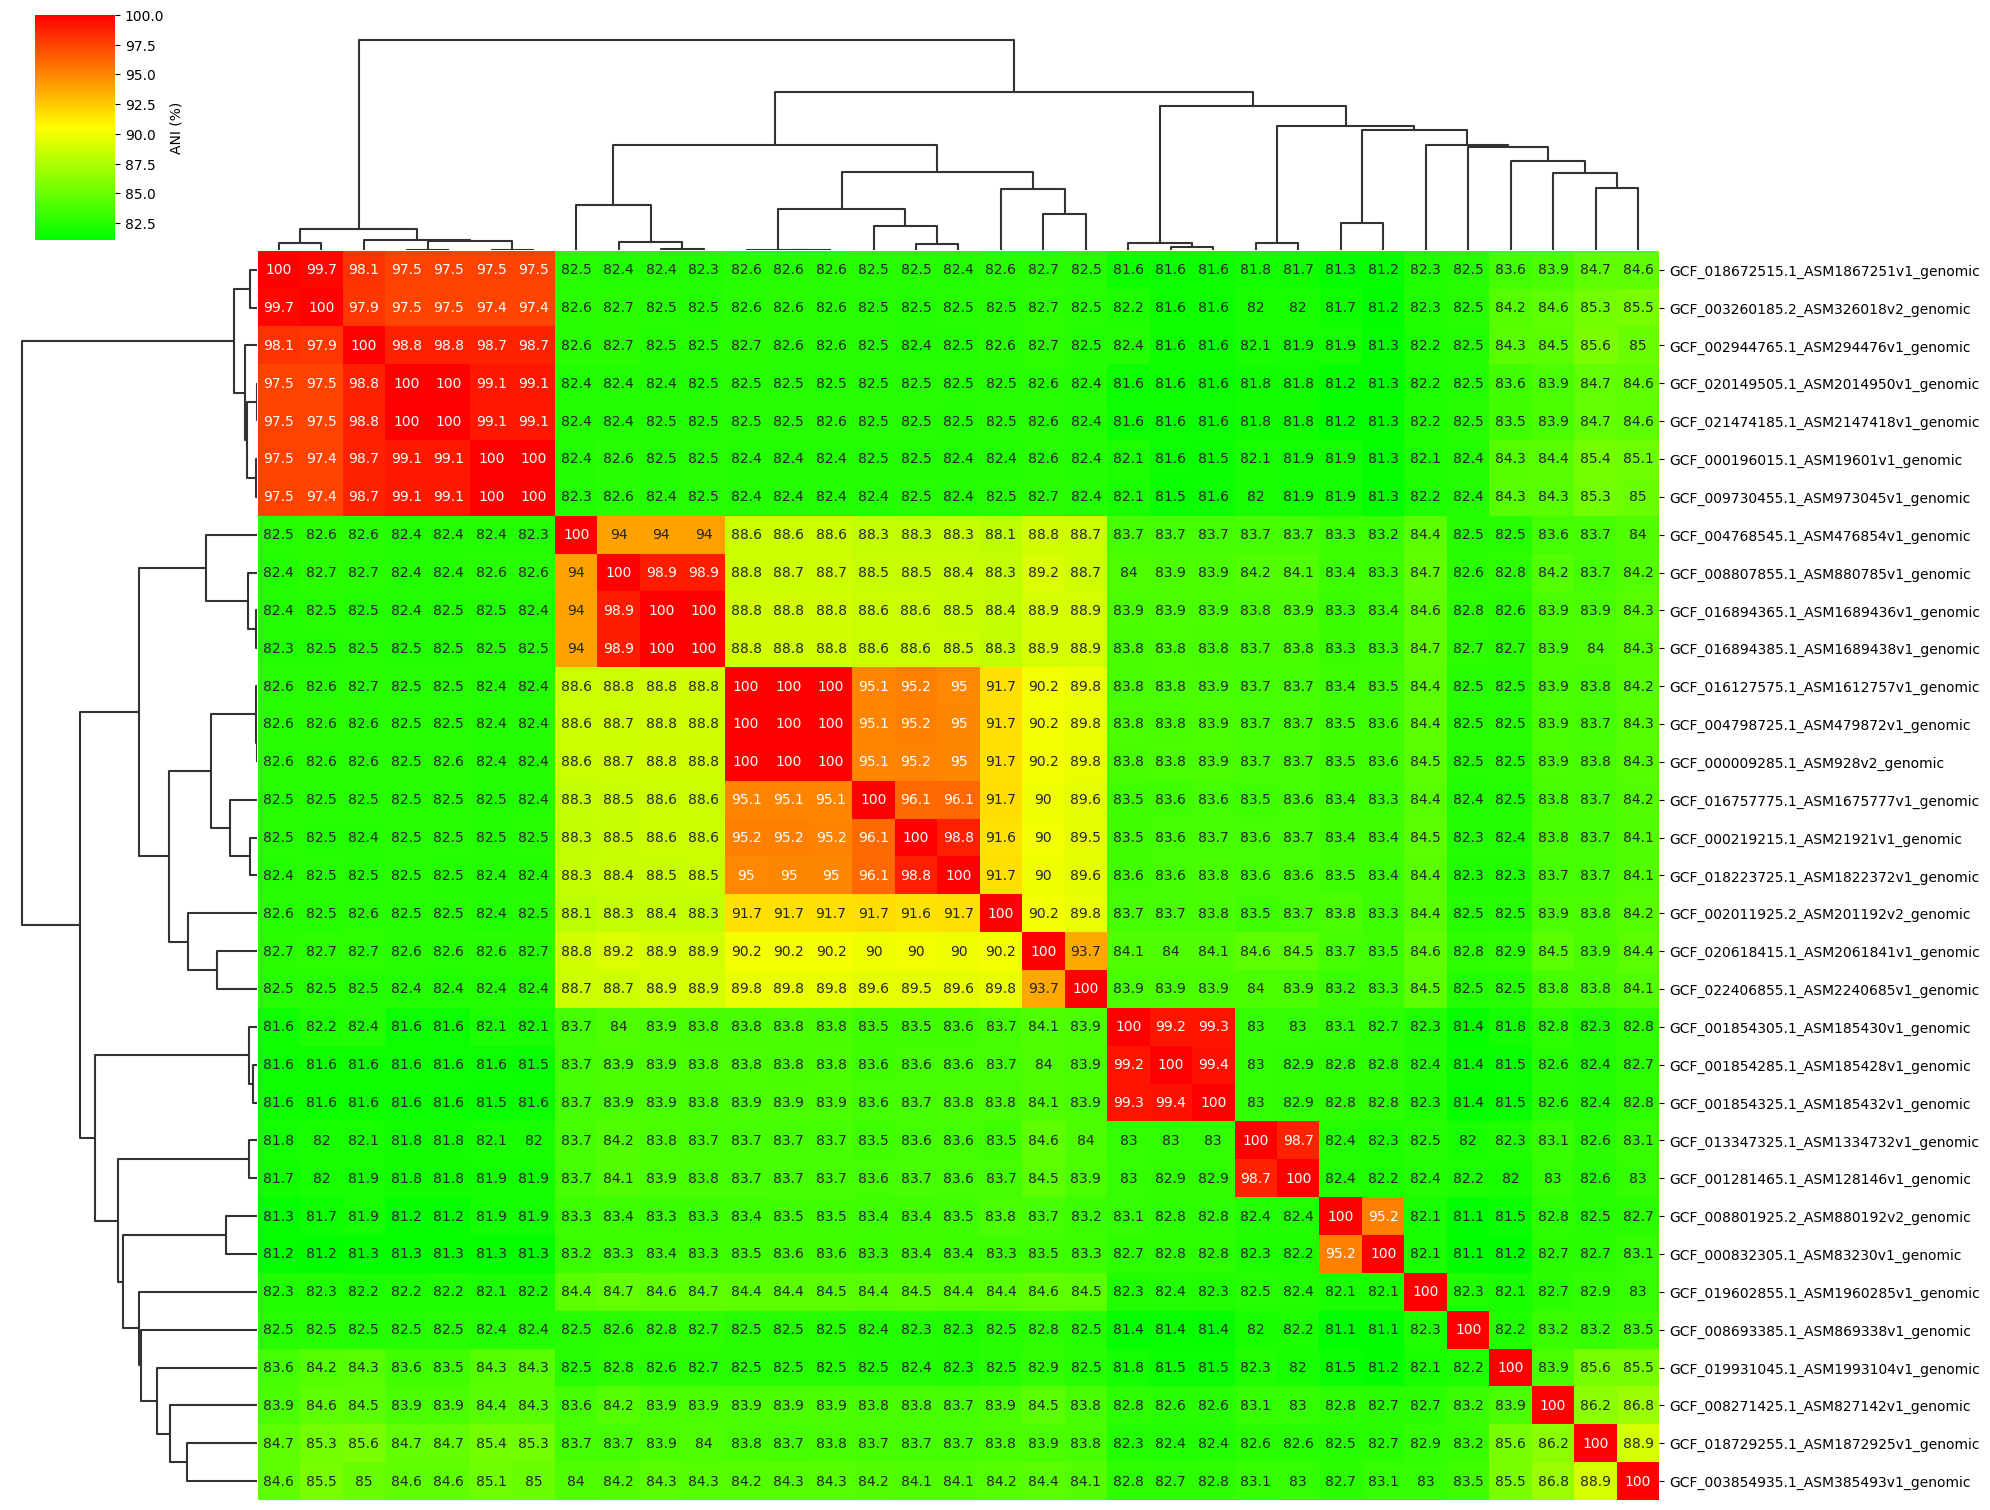
Add ANI value annotation parameter:
ANIclustermap -i ./normal_dataset -o ./ANIclustermap_result05 \
              --fig_width 20 --fig_height 15 --annotation
Owner
- Name: moshi
- Login: moshi4
- Kind: user
- Repositories: 13
- Profile: https://github.com/moshi4
Web Developer / Bioinformatics / GIS
GitHub Events
Total
- Create event: 2
- Commit comment event: 4
- Release event: 2
- Issues event: 2
- Watch event: 17
- Delete event: 1
- Issue comment event: 2
- Push event: 6
- Pull request event: 2
- Fork event: 1
Last Year
- Create event: 2
- Commit comment event: 4
- Release event: 2
- Issues event: 2
- Watch event: 17
- Delete event: 1
- Issue comment event: 2
- Push event: 6
- Pull request event: 2
- Fork event: 1
Issues and Pull Requests
Last synced: about 1 year ago
All Time
- Total issues: 17
- Total pull requests: 3
- Average time to close issues: 20 days
- Average time to close pull requests: 3 minutes
- Total issue authors: 11
- Total pull request authors: 1
- Average comments per issue: 2.47
- Average comments per pull request: 0.33
- Merged pull requests: 3
- Bot issues: 0
- Bot pull requests: 0
Past Year
- Issues: 5
- Pull requests: 2
- Average time to close issues: 3 days
- Average time to close pull requests: 3 minutes
- Issue authors: 4
- Pull request authors: 1
- Average comments per issue: 2.0
- Average comments per pull request: 0.5
- Merged pull requests: 2
- Bot issues: 0
- Bot pull requests: 0
Top Authors
Issue Authors
- Unaimend (2)
- vebaev (2)
- NantiaL (2)
- Nilad (2)
- emmannaemeka (1)
- Nyasita (1)
- H440775h (1)
- renrok (1)
- d4straub (1)
- lingvv (1)
- Juandemendieta (1)
Pull Request Authors
- moshi4 (5)