pycirclize
Circular visualization in Python (Circos Plot, Chord Diagram, Radar Chart)
Science Score: 44.0%
This score indicates how likely this project is to be science-related based on various indicators:
-
✓CITATION.cff file
Found CITATION.cff file -
✓codemeta.json file
Found codemeta.json file -
✓.zenodo.json file
Found .zenodo.json file -
○DOI references
-
○Academic publication links
-
○Committers with academic emails
-
○Institutional organization owner
-
○JOSS paper metadata
-
○Scientific vocabulary similarity
Low similarity (11.6%) to scientific vocabulary
Keywords
Repository
Circular visualization in Python (Circos Plot, Chord Diagram, Radar Chart)
Basic Info
- Host: GitHub
- Owner: moshi4
- License: mit
- Language: Python
- Default Branch: main
- Homepage: https://moshi4.github.io/pyCirclize/
- Size: 62.2 MB
Statistics
- Stars: 945
- Watchers: 10
- Forks: 51
- Open Issues: 4
- Releases: 24
Topics
Metadata Files
README.md
pyCirclize: Circular visualization in Python


![]()
Table of contents
Overview
pyCirclize is a circular visualization python package implemented based on matplotlib. This package is developed for the purpose of easily and beautifully plotting circular figure such as Circos Plot and Chord Diagram in Python. In addition, useful genome and phylogenetic tree visualization methods for the bioinformatics field are also implemented. pyCirclize was inspired by circlize and pyCircos. More detailed documentation is available here.
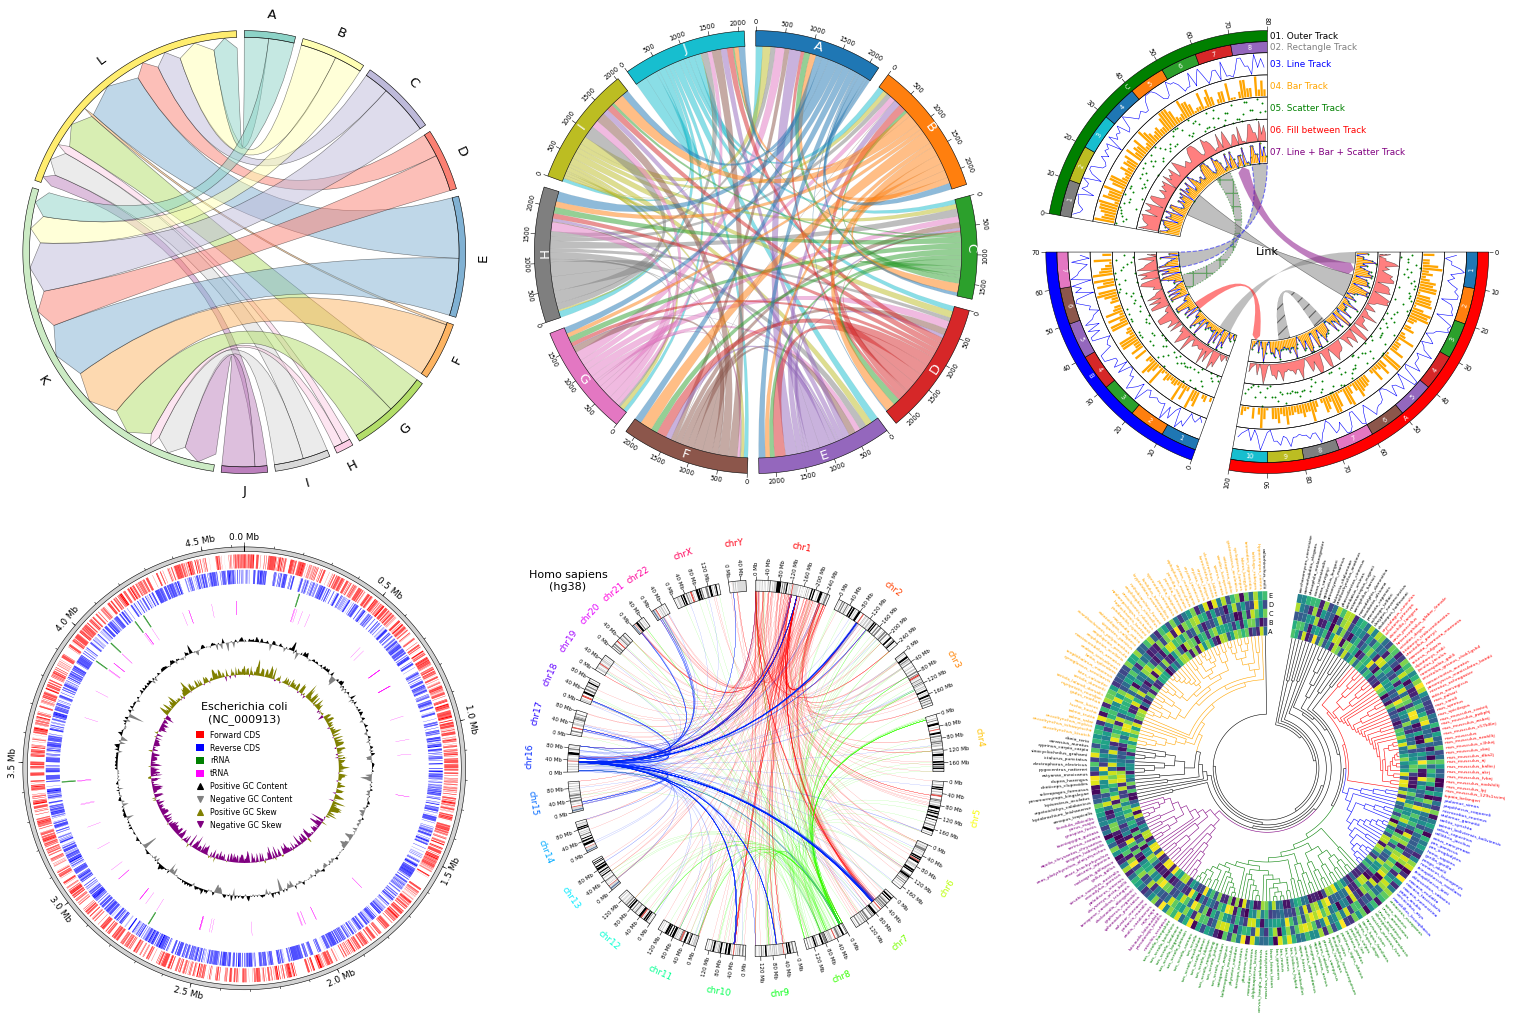
Fig.1 pyCirclize example plot gallery
Installation
Python 3.10 or later is required for installation.
Install PyPI package:
pip install pycirclize
Install conda-forge package:
conda install -c conda-forge pycirclize
API Usage
API usage is described in each of the following sections in the document.
- Getting Started
- Plot API Example
- Chord Diagram
- Radar Chart
- Circos Plot (Genomics)
- Comparative Genomics
- Phylogenetic Tree
- Plot Tips
Code Example
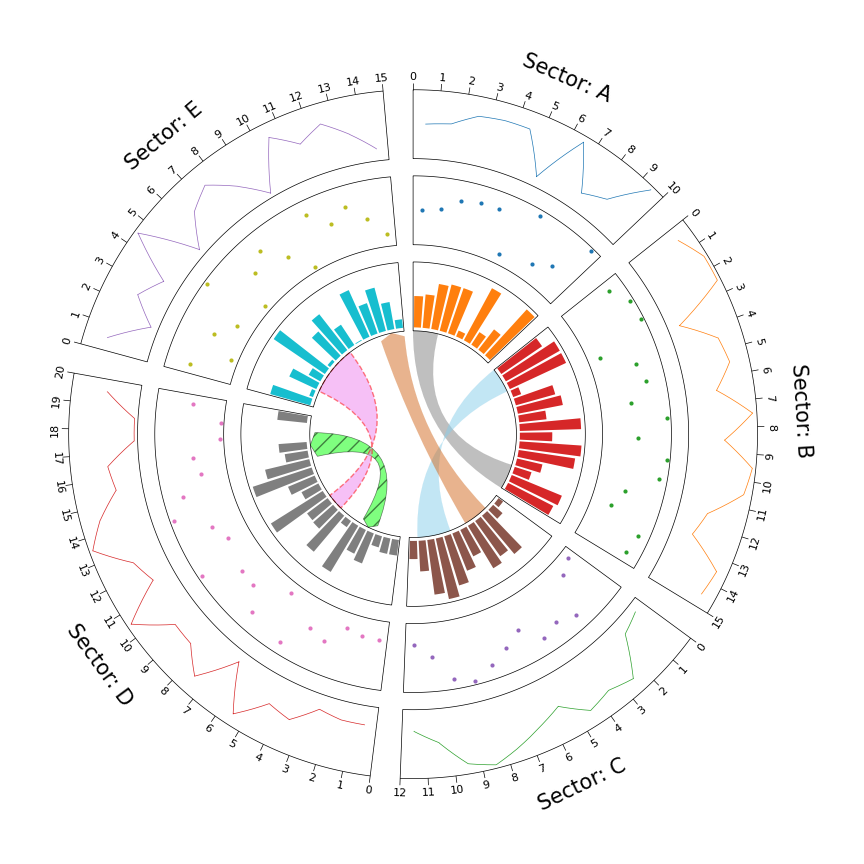
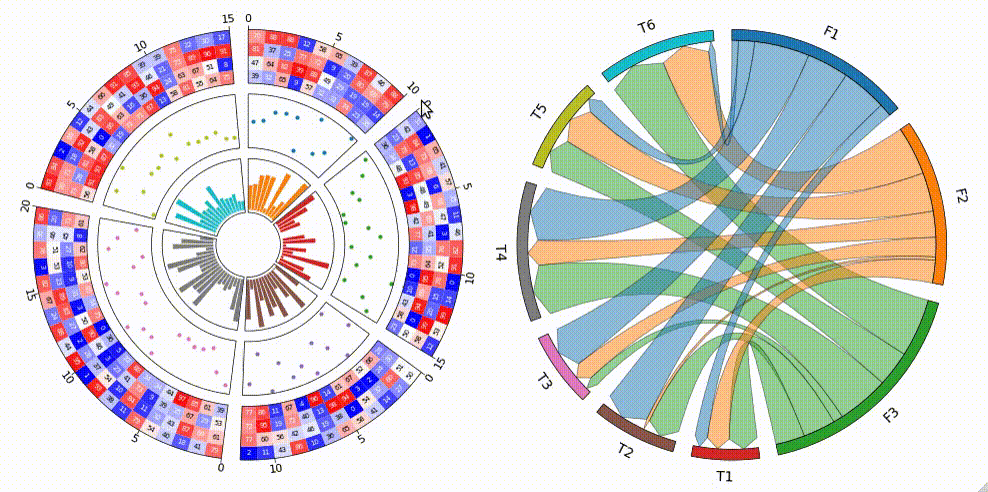
1. Circos Plot
```python from pycirclize import Circos import numpy as np np.random.seed(0)
Initialize Circos sectors
sectors = {"A": 10, "B": 15, "C": 12, "D": 20, "E": 15} circos = Circos(sectors, space=5)
for sector in circos.sectors: # Plot sector name sector.text(f"Sector: {sector.name}", r=110, size=15) # Create x positions & random y values x = np.arange(sector.start, sector.end) + 0.5 y = np.random.randint(0, 100, len(x)) # Plot lines track1 = sector.addtrack((80, 100), rpadratio=0.1) track1.xticksbyinterval(interval=1) track1.axis() track1.line(x, y) # Plot points track2 = sector.addtrack((55, 75), rpadratio=0.1) track2.axis() track2.scatter(x, y) # Plot bars track3 = sector.addtrack((30, 50), rpad_ratio=0.1) track3.axis() track3.bar(x, y)
Plot links
circos.link(("A", 0, 3), ("B", 15, 12)) circos.link(("B", 0, 3), ("C", 7, 11), color="skyblue") circos.link(("C", 2, 5), ("E", 15, 12), color="chocolate", direction=1) circos.link(("D", 3, 5), ("D", 18, 15), color="lime", ec="black", lw=0.5, hatch="//", direction=2) circos.link(("D", 8, 10), ("E", 2, 8), color="violet", ec="red", lw=1.0, ls="dashed")
circos.savefig("example01.png") ```
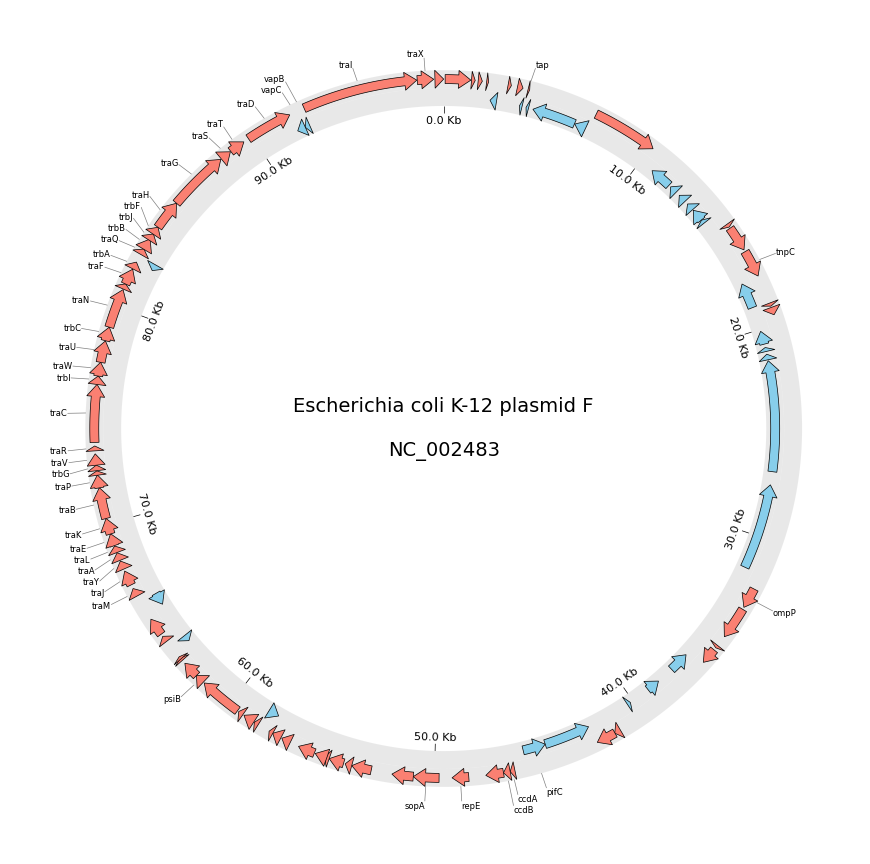
2. Circos Plot (Genomics)
```python from pycirclize import Circos from pycirclize.utils import fetchgenbankby_accid from pycirclize.parser import Genbank
Download NC_002483 E.coli plasmid genbank
gbkfetchdata = fetchgenbankbyaccid("NC002483") gbk = Genbank(gbkfetchdata)
Initialize Circos instance with genome size
sectors = gbk.get_seqid2size() space = 0 if len(sectors) == 1 else 2 circos = Circos(sectors, space=space) circos.text(f"Escherichia coli K-12 plasmid F\n\n{gbk.name}", size=14)
seqid2features = gbk.getseqid2features(featuretype="CDS") for sector in circos.sectors: # Setup track for features plot fcdstrack = sector.addtrack((95, 100)) fcdstrack.axis(fc="lightgrey", ec="none", alpha=0.5) rcdstrack = sector.addtrack((90, 95)) rcdstrack.axis(fc="lightgrey", ec="none", alpha=0.5) # Plot forward/reverse strand CDS features = seqid2features[sector.name] for feature in features: if feature.location.strand == 1: fcdstrack.genomicfeatures(feature, plotstyle="arrow", fc="salmon", lw=0.5) else: rcdstrack.genomicfeatures(feature, plotstyle="arrow", fc="skyblue", lw=0.5)
# Plot 'gene' qualifier label if exists
labels, label_pos_list = [], []
for feature in features:
    start = int(feature.location.start)
    end = int(feature.location.end)
    label_pos = (start + end) / 2
    gene_name = feature.qualifiers.get("gene", [None])[0]
    if gene_name is not None:
        labels.append(gene_name)
        label_pos_list.append(label_pos)
        f_cds_track.annotate(label_pos, gene_name, label_size=6)

# Plot xticks (interval = 10 Kb)
r_cds_track.xticks_by_interval(
    10000, outer=False, label_formatter=lambda v: f"{v/1000:.1f} Kb"
)
circos.savefig("example02.png") ```
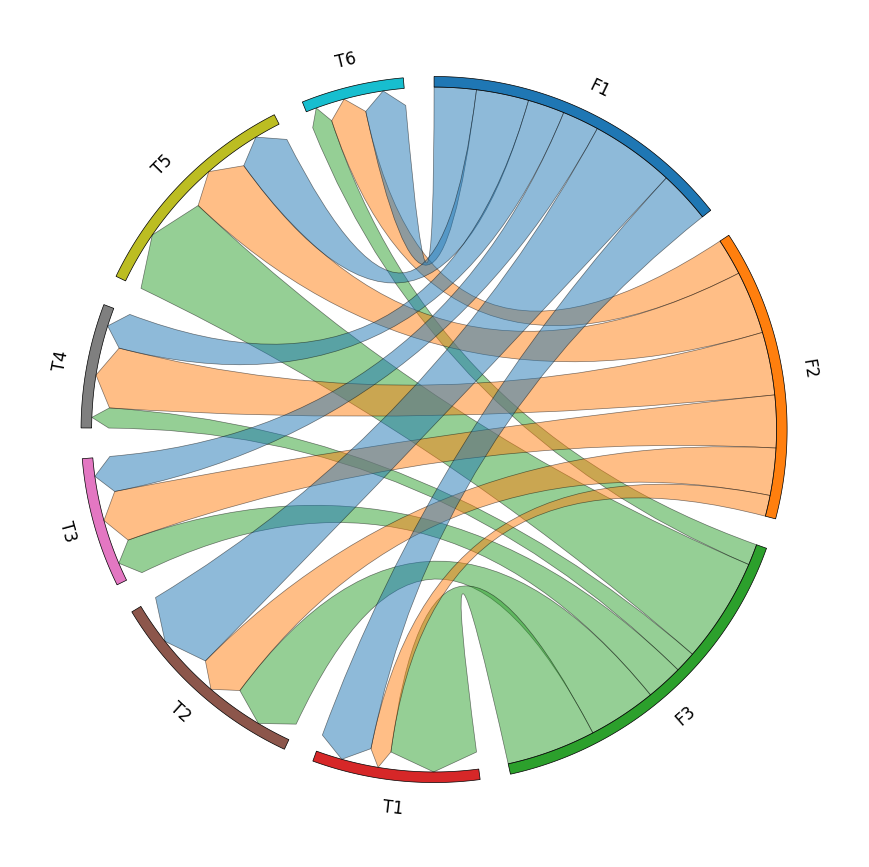
3. Chord Diagram
```python from pycirclize import Circos import pandas as pd
Create matrix dataframe (3 x 6)
rownames = ["F1", "F2", "F3"] colnames = ["T1", "T2", "T3", "T4", "T5", "T6"] matrixdata = [ [10, 16, 7, 7, 10, 8], [4, 9, 10, 12, 12, 7], [17, 13, 7, 4, 20, 4], ] matrixdf = pd.DataFrame(matrixdata, index=rownames, columns=col_names)
Initialize Circos instance for chord diagram plot
circos = Circos.chorddiagram( matrixdf, space=5, cmap="tab10", labelkws=dict(size=12), linkkws=dict(ec="black", lw=0.5, direction=1), )
circos.savefig("example03.png") ```
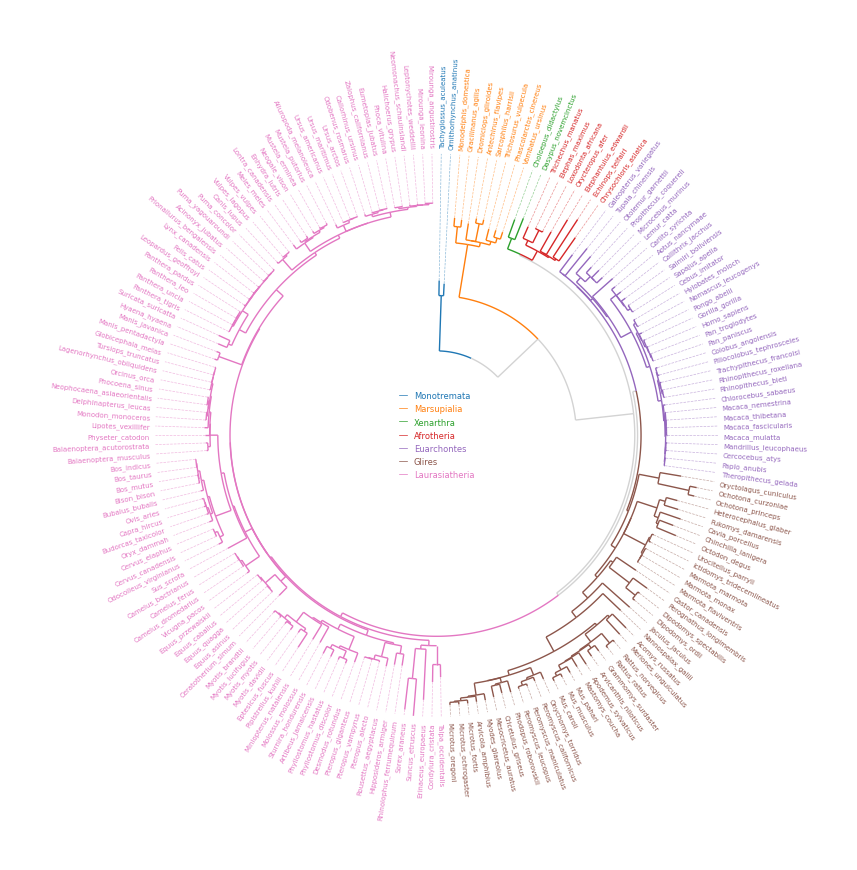
4. Phylogenetic Tree
```python from pycirclize import Circos from pycirclize.utils import loadexampletree_file, ColorCycler from matplotlib.lines import Line2D
Initialize Circos from phylogenetic tree
treefile = loadexampletreefile("largeexample.nwk") circos, tv = Circos.initializefromtree( treefile, rlim=(30, 100), leaflabelsize=5, linekws=dict(color="lightgrey", lw=1.0), )
Define group-species dict for tree annotation
In this example, set minimum species list to specify group's MRCA node
groupname2specieslist = dict( Monotremata=["Tachyglossusaculeatus", "Ornithorhynchusanatinus"], Marsupialia=["Monodelphisdomestica", "Vombatusursinus"], Xenarthra=["Choloepusdidactylus", "Dasypusnovemcinctus"], Afrotheria=["Trichechusmanatus", "Chrysochlorisasiatica"], Euarchontes=["Galeopterusvariegatus", "Theropithecusgelada"], Glires=["Oryctolaguscuniculus", "Microtusoregoni"], Laurasiatheria=["Talpaoccidentalis", "Miroungaleonina"], )
Set tree line color & label color
ColorCycler.setcmap("tab10") groupname2color = {name: ColorCycler() for name in groupname2specieslist.keys()} for groupname, specieslist in groupname2specieslist.items(): color = groupname2color[groupname] tv.setnodelineprops(specieslist, color=color, applylabelcolor=True)
Plot figure & set legend on center
fig = circos.plotfig() _ = circos.ax.legend( handles=[Line2D([], [], label=n, color=c) for n, c in groupname2color.items()], labelcolor=groupname2color.values(), fontsize=6, loc="center", bboxtoanchor=(0.5, 0.5), ) fig.savefig("example04.png") ```
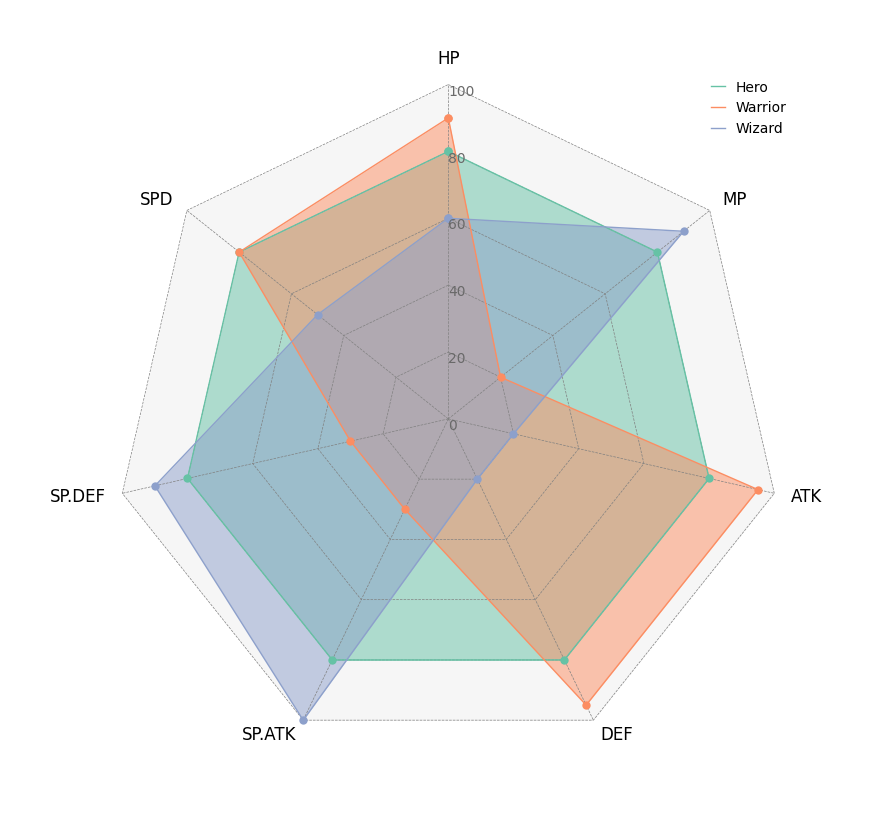
5. Radar Chart
```python from pycirclize import Circos import pandas as pd
Create RPG jobs parameter dataframe (3 jobs, 7 parameters)
df = pd.DataFrame( data=[ [80, 80, 80, 80, 80, 80, 80], [90, 20, 95, 95, 30, 30, 80], [60, 90, 20, 20, 100, 90, 50], ], index=["Hero", "Warrior", "Wizard"], columns=["HP", "MP", "ATK", "DEF", "SP.ATK", "SP.DEF", "SPD"], )
Initialize Circos instance for radar chart plot
circos = Circos.radarchart( df, vmax=100, markersize=6, gridintervalratio=0.2, )
Plot figure & set legend on upper right
fig = circos.plotfig() _ = circos.ax.legend(loc="upper right", fontsize=10) fig.savefig("example05.png") ```
Tooltip Option
pyCirclize supports tooltip display in jupyter using ipympl.
To enable tooltip, install pycirclize with ipympl and call circos.plotfig(tooltip=True) method.
Tooltip option is tested on jupyter notebooks in VScode and JupyterLab.
```shell pip install pycirclize[tooltip]
or
conda install -c conda-forge pycirclize ipympl ```
[!WARNING] Interactive tooltip plots require live python kernel. Be aware that tooltips are not always enabled in the notebook after plotting.
Star History
Owner
- Name: moshi
- Login: moshi4
- Kind: user
- Repositories: 13
- Profile: https://github.com/moshi4
Web Developer / Bioinformatics / GIS
Citation (CITATION.cff)
cff-version: 1.2.0
message: If you use this software, please cite it as below.
authors:
  - family-names: Shimoyama
    given-names: Yuki
title: "pyCirclize: Circular visualization in Python"
date-released: 2022-12-20
url: https://github.com/moshi4/pyCirclize
GitHub Events
Total
- Create event: 9
- Commit comment event: 5
- Release event: 4
- Issues event: 30
- Watch event: 171
- Delete event: 5
- Issue comment event: 25
- Push event: 14
- Pull request event: 11
- Fork event: 11
Last Year
- Create event: 9
- Commit comment event: 5
- Release event: 4
- Issues event: 30
- Watch event: 171
- Delete event: 5
- Issue comment event: 25
- Push event: 14
- Pull request event: 11
- Fork event: 11
Issues and Pull Requests
Last synced: 10 months ago
All Time
- Total issues: 61
- Total pull requests: 27
- Average time to close issues: 3 days
- Average time to close pull requests: about 8 hours
- Total issue authors: 47
- Total pull request authors: 3
- Average comments per issue: 2.36
- Average comments per pull request: 0.07
- Merged pull requests: 23
- Bot issues: 0
- Bot pull requests: 0
Past Year
- Issues: 18
- Pull requests: 10
- Average time to close issues: 2 days
- Average time to close pull requests: 2 minutes
- Issue authors: 15
- Pull request authors: 2
- Average comments per issue: 1.22
- Average comments per pull request: 0.0
- Merged pull requests: 7
- Bot issues: 0
- Bot pull requests: 0
Top Authors
Issue Authors
- gbouras13 (3)
- dnjst (3)
- johnnytam100 (3)
- LFelipe-B (2)
- Thallam-Prashanth (2)
- erinyoung (2)
- jishnu-lab (2)
- Zymeth0211 (2)
- aspitaleri (2)
- santiagolopezg (1)
- naturepoker (1)
- ryvan1021 (1)
- hschult (1)
- kjrathore (1)
- amjass12 (1)
Pull Request Authors
- moshi4 (29)
- mirodriguezgal (2)
- acarafat (1)
Top Labels
Issue Labels
Pull Request Labels
Packages
- Total packages: 3
-
Total downloads:
- pypi 10,054 last-month
-
Total dependent packages: 7
(may contain duplicates) -
Total dependent repositories: 1
(may contain duplicates) - Total versions: 78
- Total maintainers: 1
proxy.golang.org: github.com/moshi4/pycirclize
- Documentation: https://pkg.go.dev/github.com/moshi4/pycirclize#section-documentation
- License: mit
-
Latest release: v1.10.0
published 11 months ago
Rankings
proxy.golang.org: github.com/moshi4/pyCirclize
- Documentation: https://pkg.go.dev/github.com/moshi4/pyCirclize#section-documentation
- License: mit
-
Latest release: v1.10.0
published 11 months ago
Rankings
pypi.org: pycirclize
Circular visualization in Python
- Documentation: https://pycirclize.readthedocs.io/
- License: mit
-
Latest release: 1.10.0
published 11 months ago
Rankings
Maintainers (1)
Dependencies
- actions/checkout v3 composite
- actions/setup-python v4 composite
- actions/checkout v3 composite
- actions/setup-python v4 composite
- actions/checkout v3 composite
- actions/setup-python v4 composite
- 115 dependencies
- black ^22.10.0 develop
- flake8 ^4.0.1 develop
- ipykernel ^6.13.0 develop
- mkdocs ^1.2 develop
- mkdocs-jupyter ^0.21.0 develop
- mkdocs-material ^8.2 develop
- mkdocstrings ^0.19.0 develop
- pydocstyle ^6.1.1 develop
- pytest ^7.1.2 develop
- pytest-cov ^4.0.0 develop
- biopython ^1.79
- matplotlib ^3.5.2
- numpy ^1.21.1
- pandas ^1.3.5
- python ^3.8