karyopyploter
Package to mimic the functionality of KaryoploteR, but in Python.
Science Score: 36.0%
This score indicates how likely this project is to be science-related based on various indicators:
-
○CITATION.cff file
-
✓codemeta.json file
Found codemeta.json file -
✓.zenodo.json file
Found .zenodo.json file -
○DOI references
-
✓Academic publication links
Links to: zenodo.org -
○Academic email domains
-
○Institutional organization owner
-
○JOSS paper metadata
-
○Scientific vocabulary similarity
Low similarity (9.7%) to scientific vocabulary
Repository
Package to mimic the functionality of KaryoploteR, but in Python.
Basic Info
- Host: GitHub
- Owner: VasLem
- License: bsd-3-clause
- Language: Python
- Default Branch: main
- Size: 3.74 MB
Statistics
- Stars: 1
- Watchers: 0
- Forks: 1
- Open Issues: 0
- Releases: 3
Metadata Files
README.md
karyopyploter
![]()


Table of Contents
Acknowledgements
This project was based on the work by @Adoni5 and his repository pyryotype. It was made to provide similar functionality to what is being offered by KaryoploteR package, but in a more pythonic style, using Matplotlib as the basis, and giving the user full liberty to plot anything they want.
Installation
console
    pip install karyopyploter
Example usage
```python from karyopyploter import ( GENOME, plotideogram, makeideogramgrid, makegenomegrid, annotateideogram, addideogramcoordinates, reset_coordinates, zoom, ) from matplotlib import pyplot as plt from itertools import chain from pathlib import Path
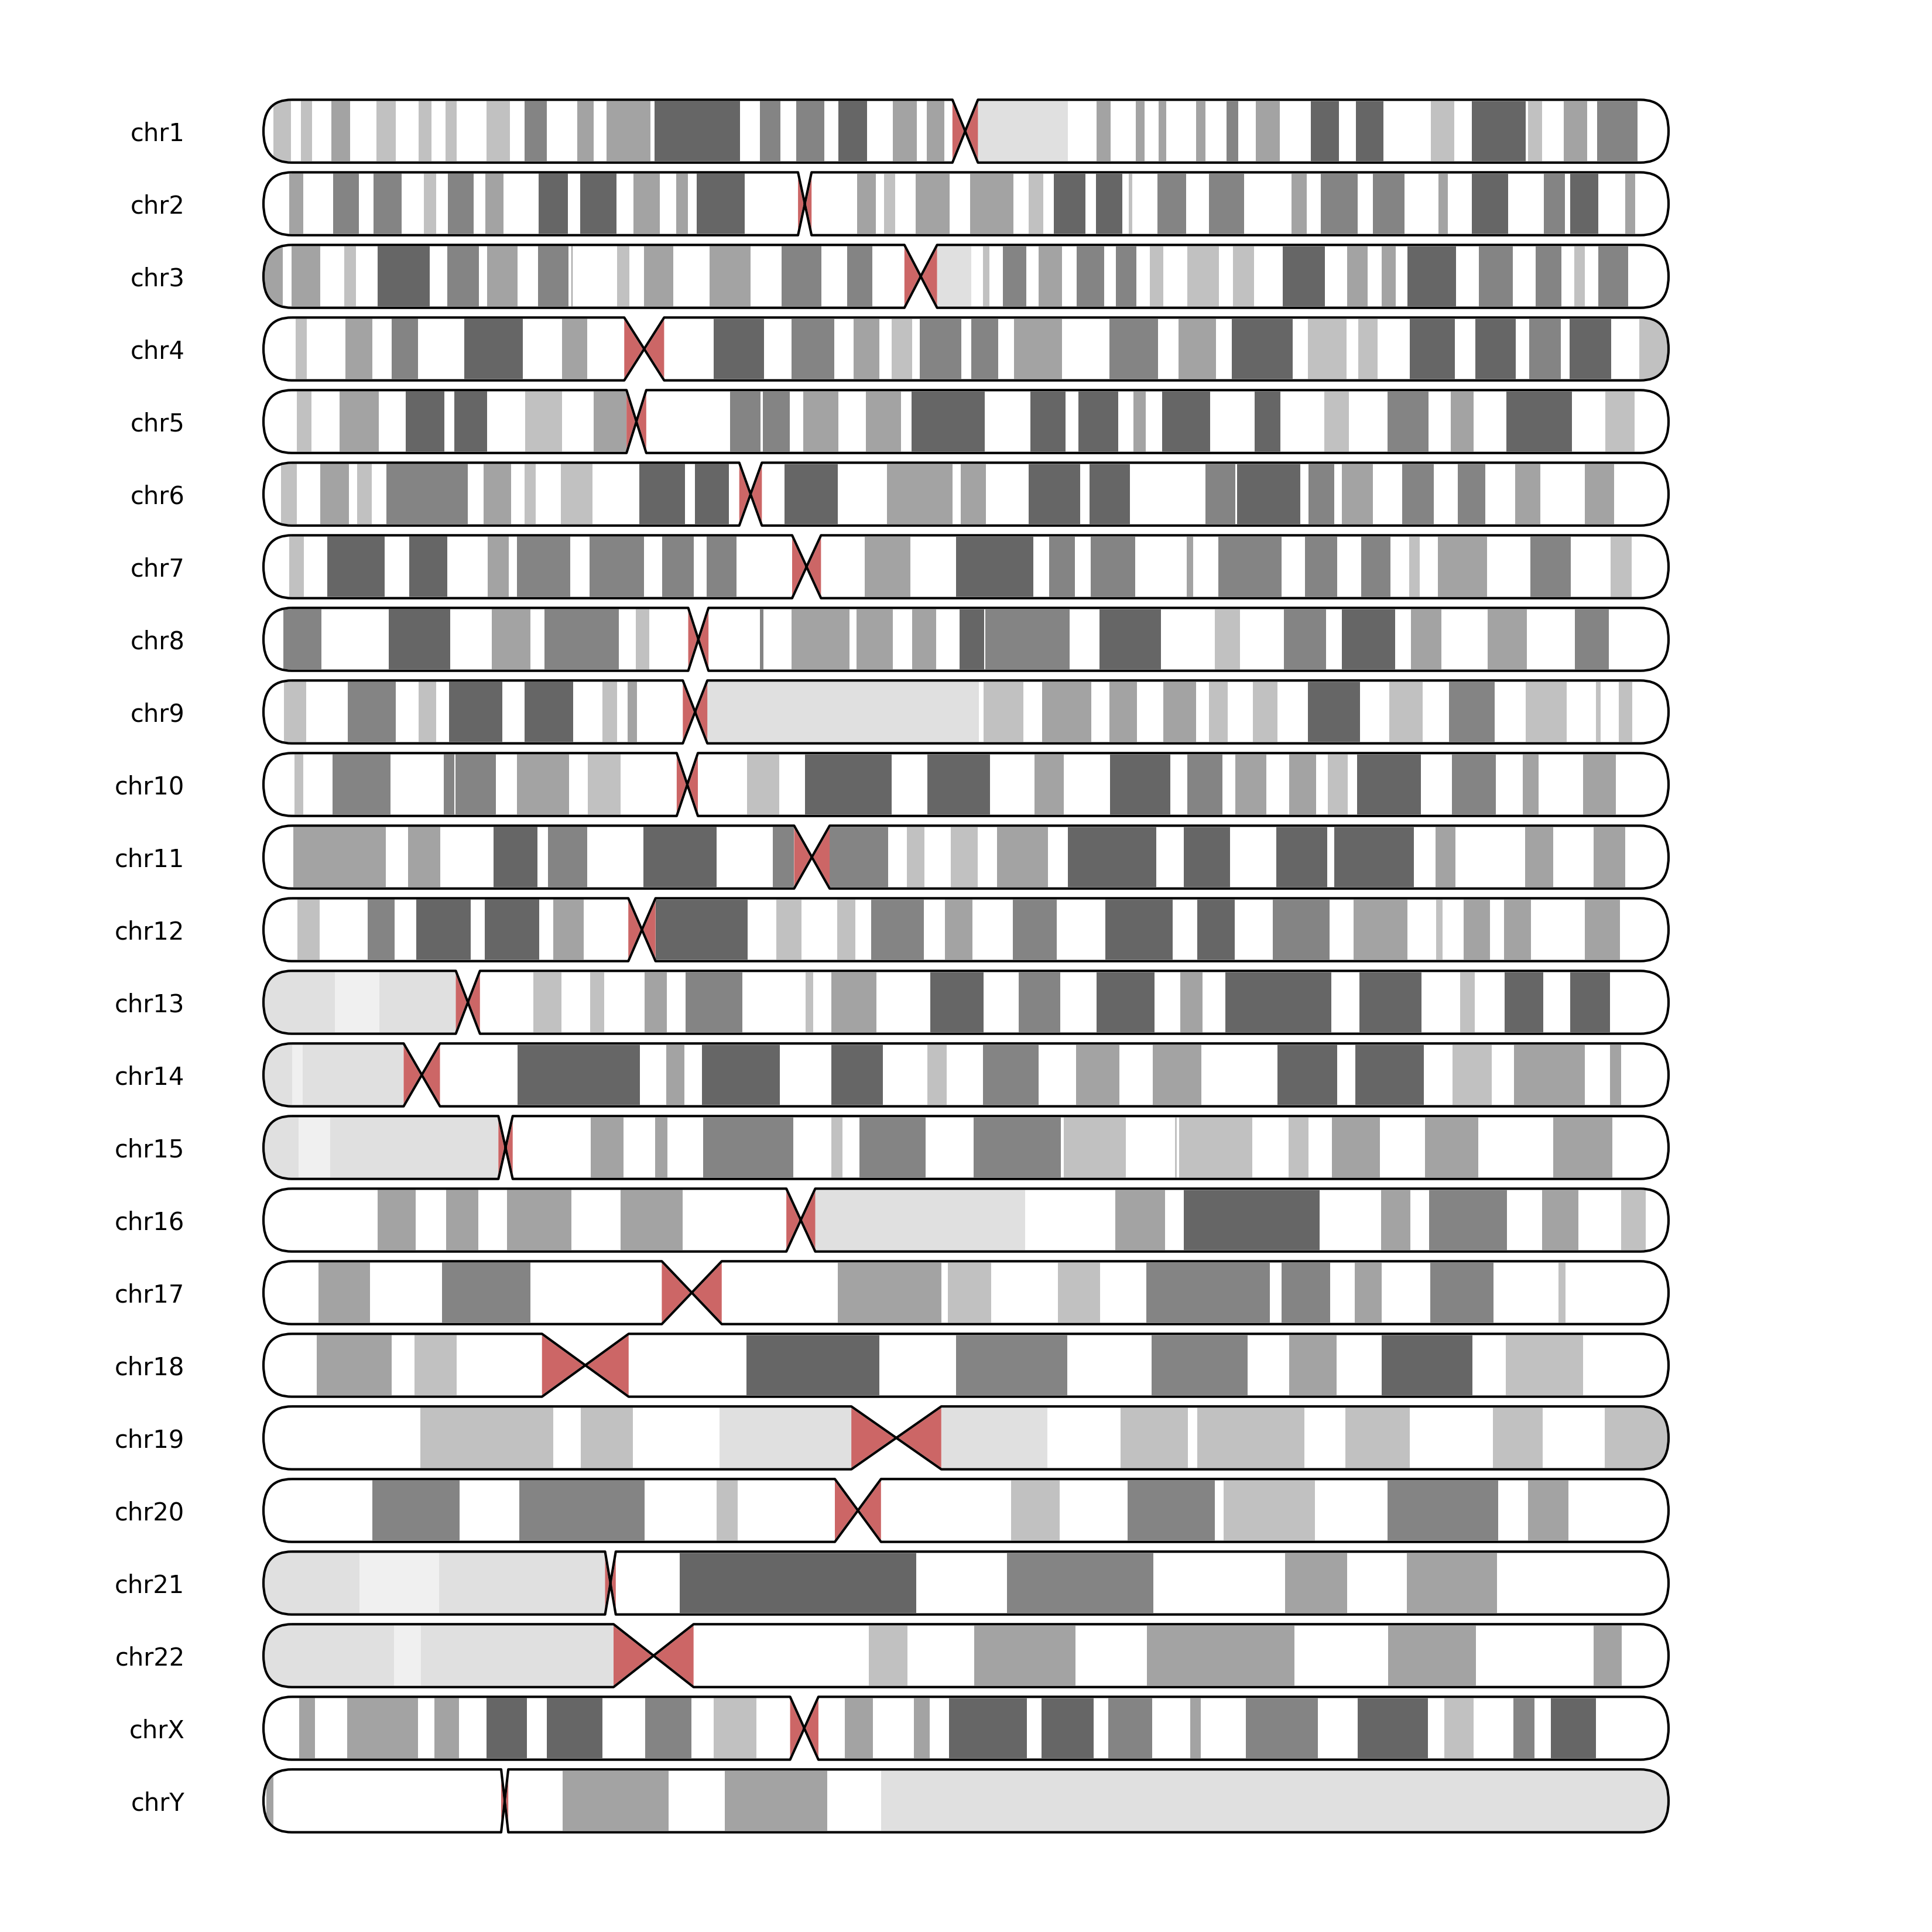
OUTDIR = Path(file).parent.parent / "exampleoutputs" / "readmeexample" OUTDIR.mkdir(parents=True, existok=True) genome = GENOME.CHM13 fig, axes = plt.subplots( ncols=1, nrows=22, figsize=(11, 11), facecolor="white", ) for ax, contigname in zip(axes, [f"chr{i}" for i in chain(range(1, 23), "XY")]): chromosome = contigname plotideogram(ax, target=chromosome, genome=genome, label=contig_name)
similar to:
fig = plt.figure(figsize=(11, 11), facecolor="white")
fig, , ideogramaxes = makeideogramgrid(
target=[f"chr{contigname}" for contigname in chain(range(1, 23), "XY")],
numsubplots=0,
genome=genome,
fig=fig,
)
fig.savefig(TESTDIR / "ideogram_grid1.png", dpi=300)
Will output:
python
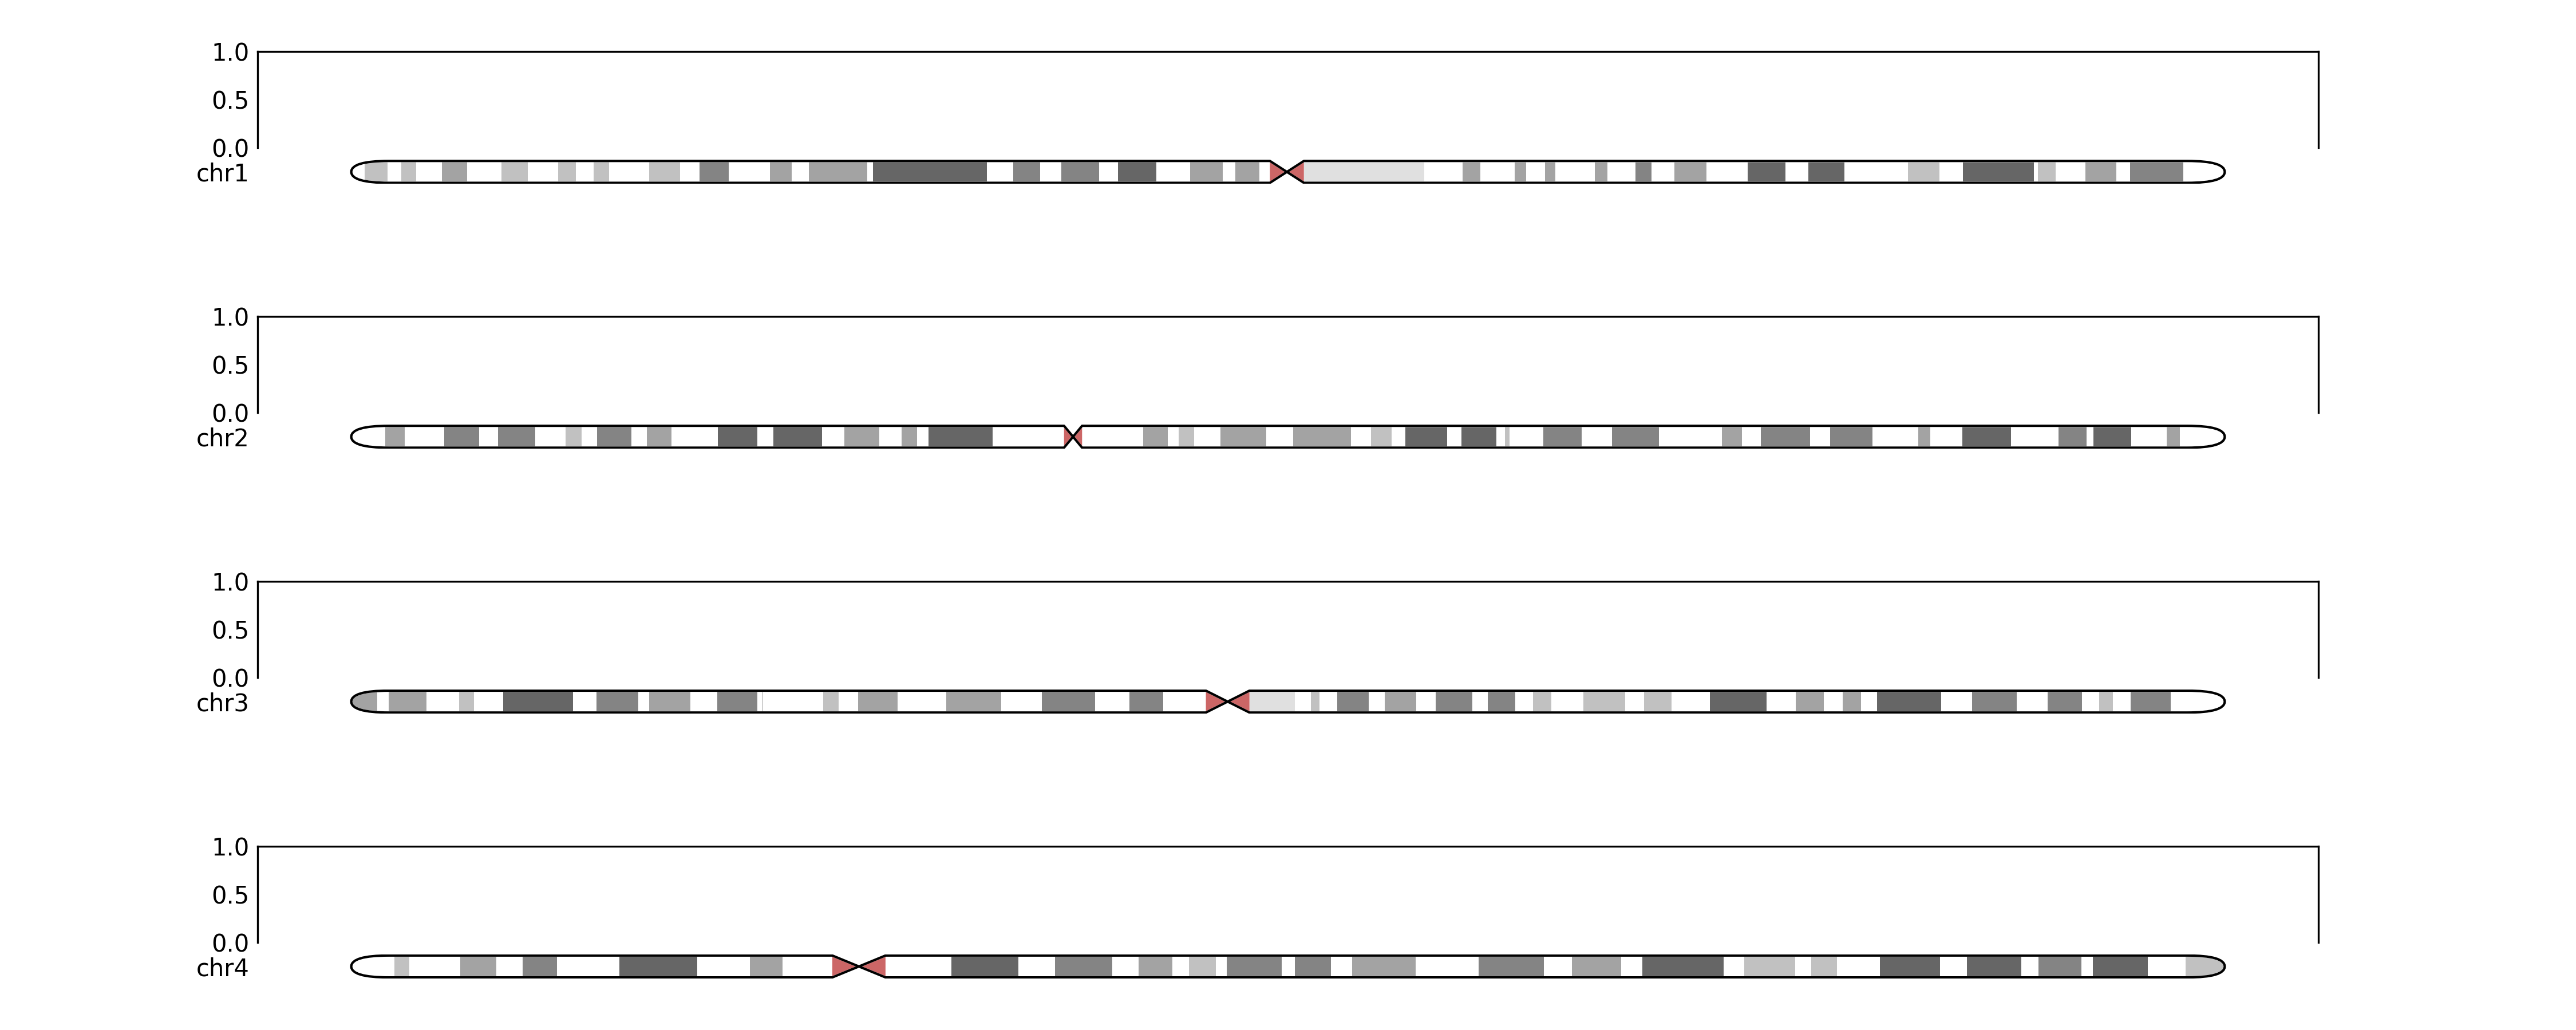
and with a subplots grid
fig, ax, ideogramaxes = makeideogramgrid(
subplotwidth=15,
gridparams=dict(hspace=1),
ideogramfactor=0.3,
target=[f"chr{contigname}" for contigname in chain(range(1, 5))],
numsubplots=1,
genome=genome,
)
fig.savefig(TESTDIR / "ideogram_grid2.png", dpi=300)
Will output:
python
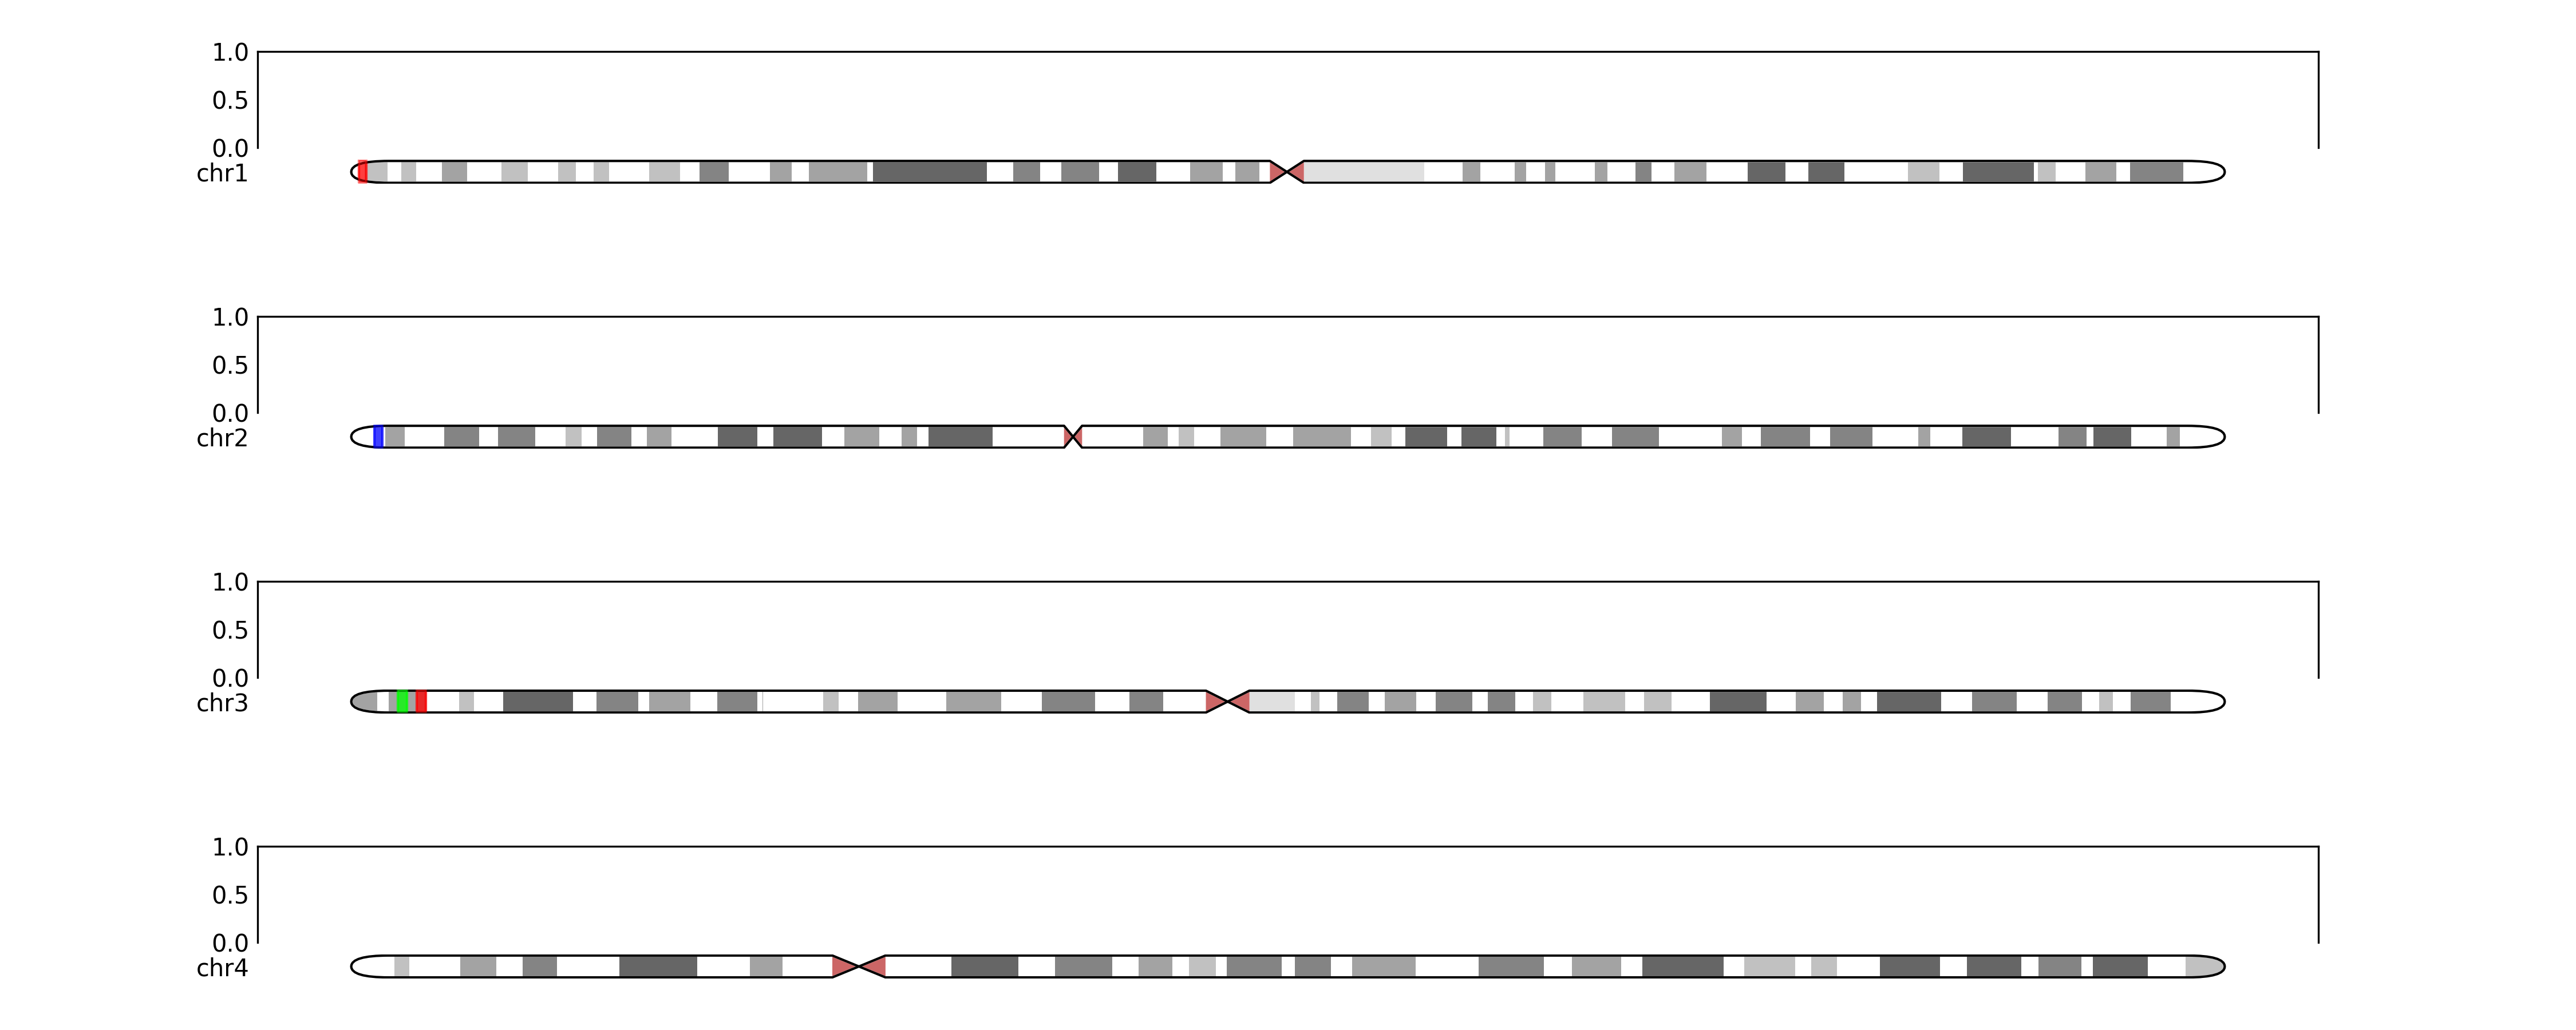
and with some regions annotated
regions = {'chr1':[(1000000,2000000, "red")], 'chr2':[(3000000, 4000000, 'blue')], 'chr3':[(5000000,6000000, (0,1,0)), (7000000,8000000, (1,0,0))]}
for chr in regions:
annotateideogram(ideogramaxes[chr], regions=regions[chr], genome=genome)
fig.savefig(TESTDIR / "ideogramgrid3.png", dpi=300)
Will output:
python
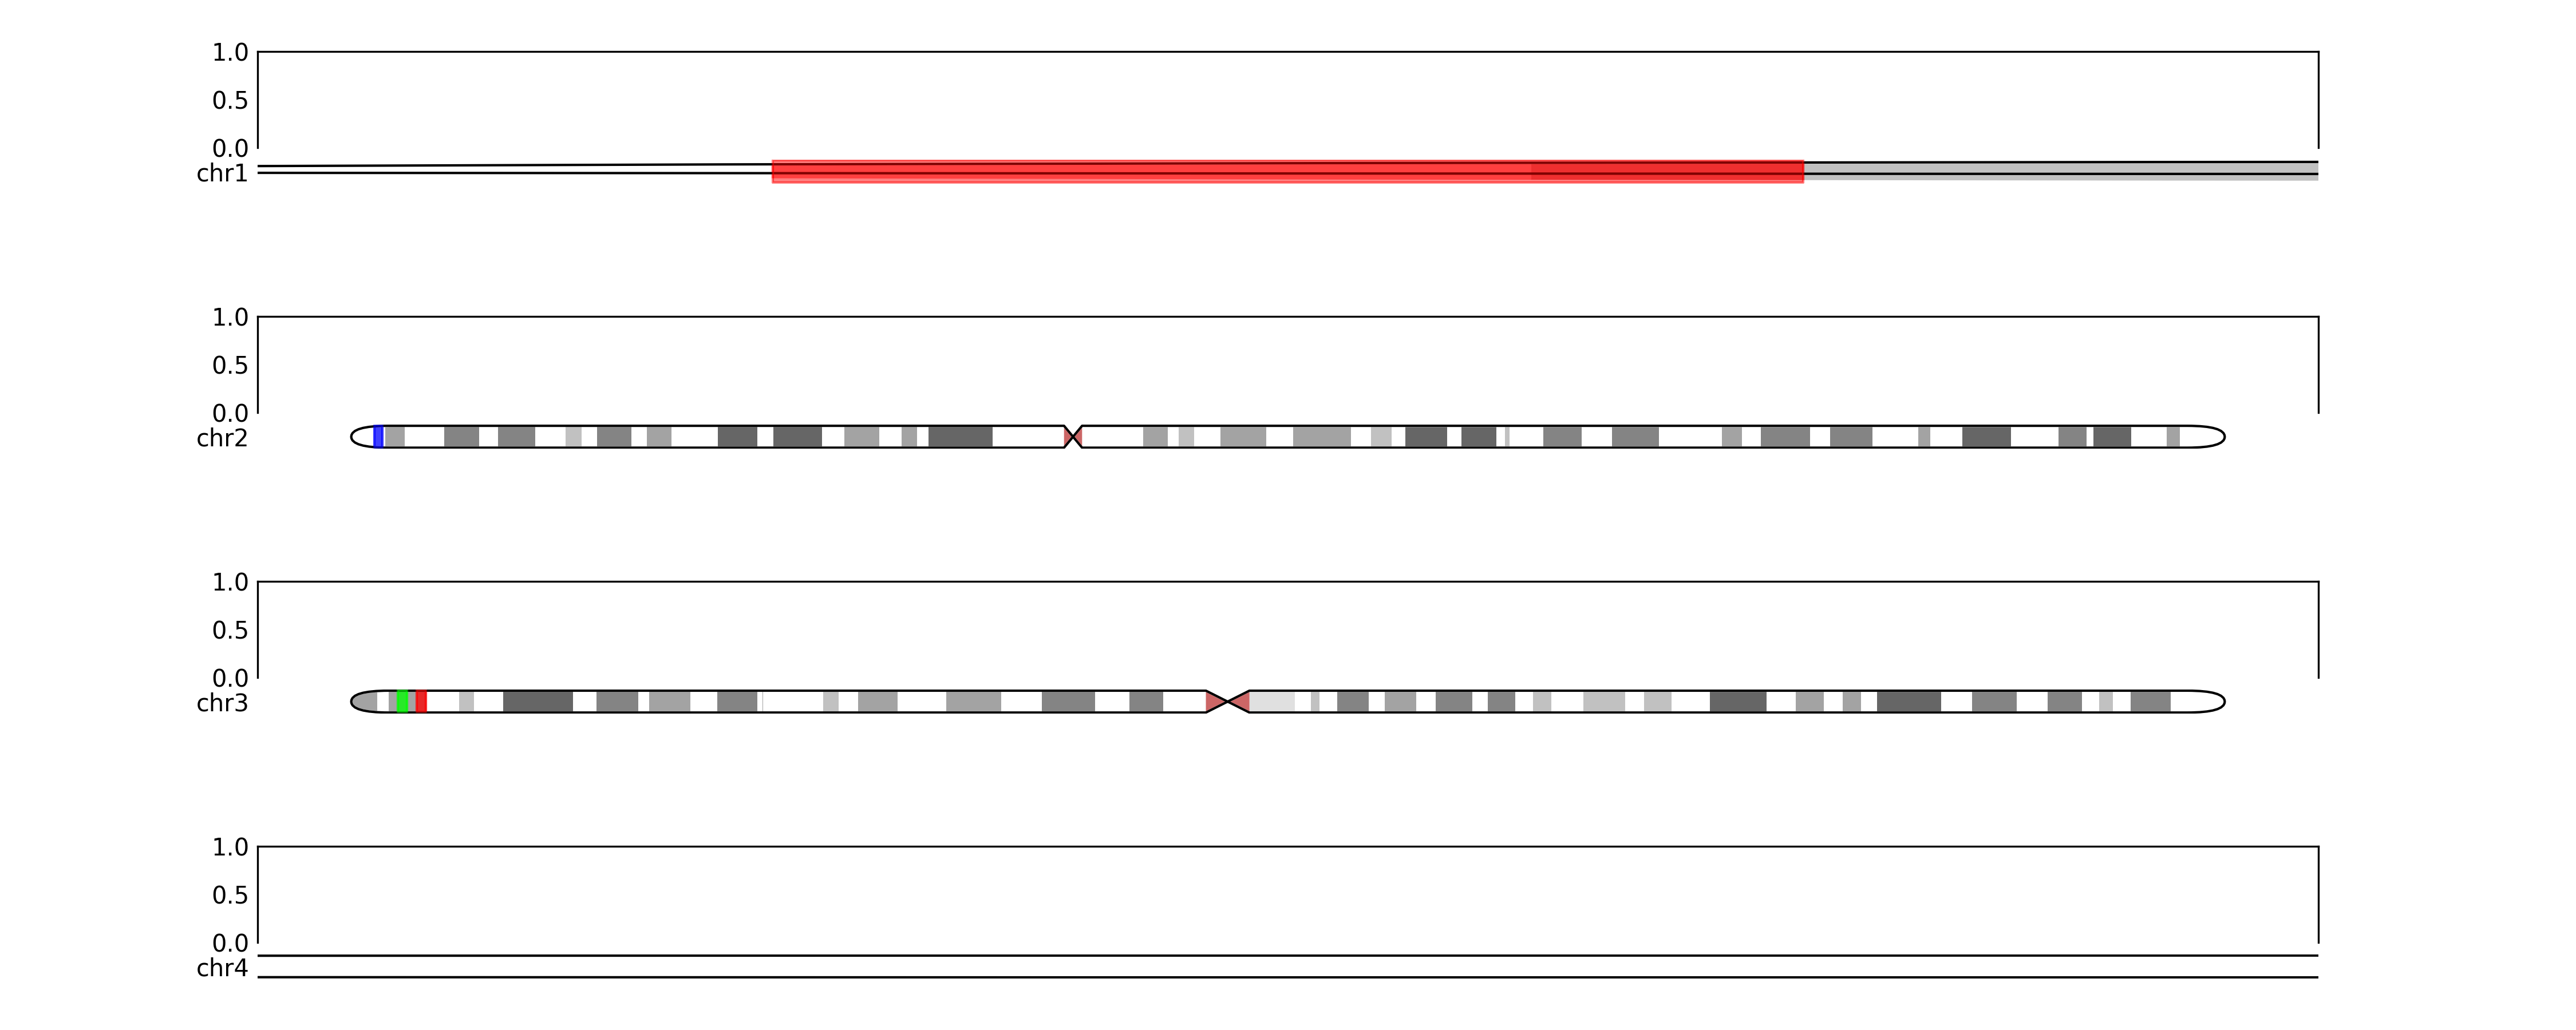
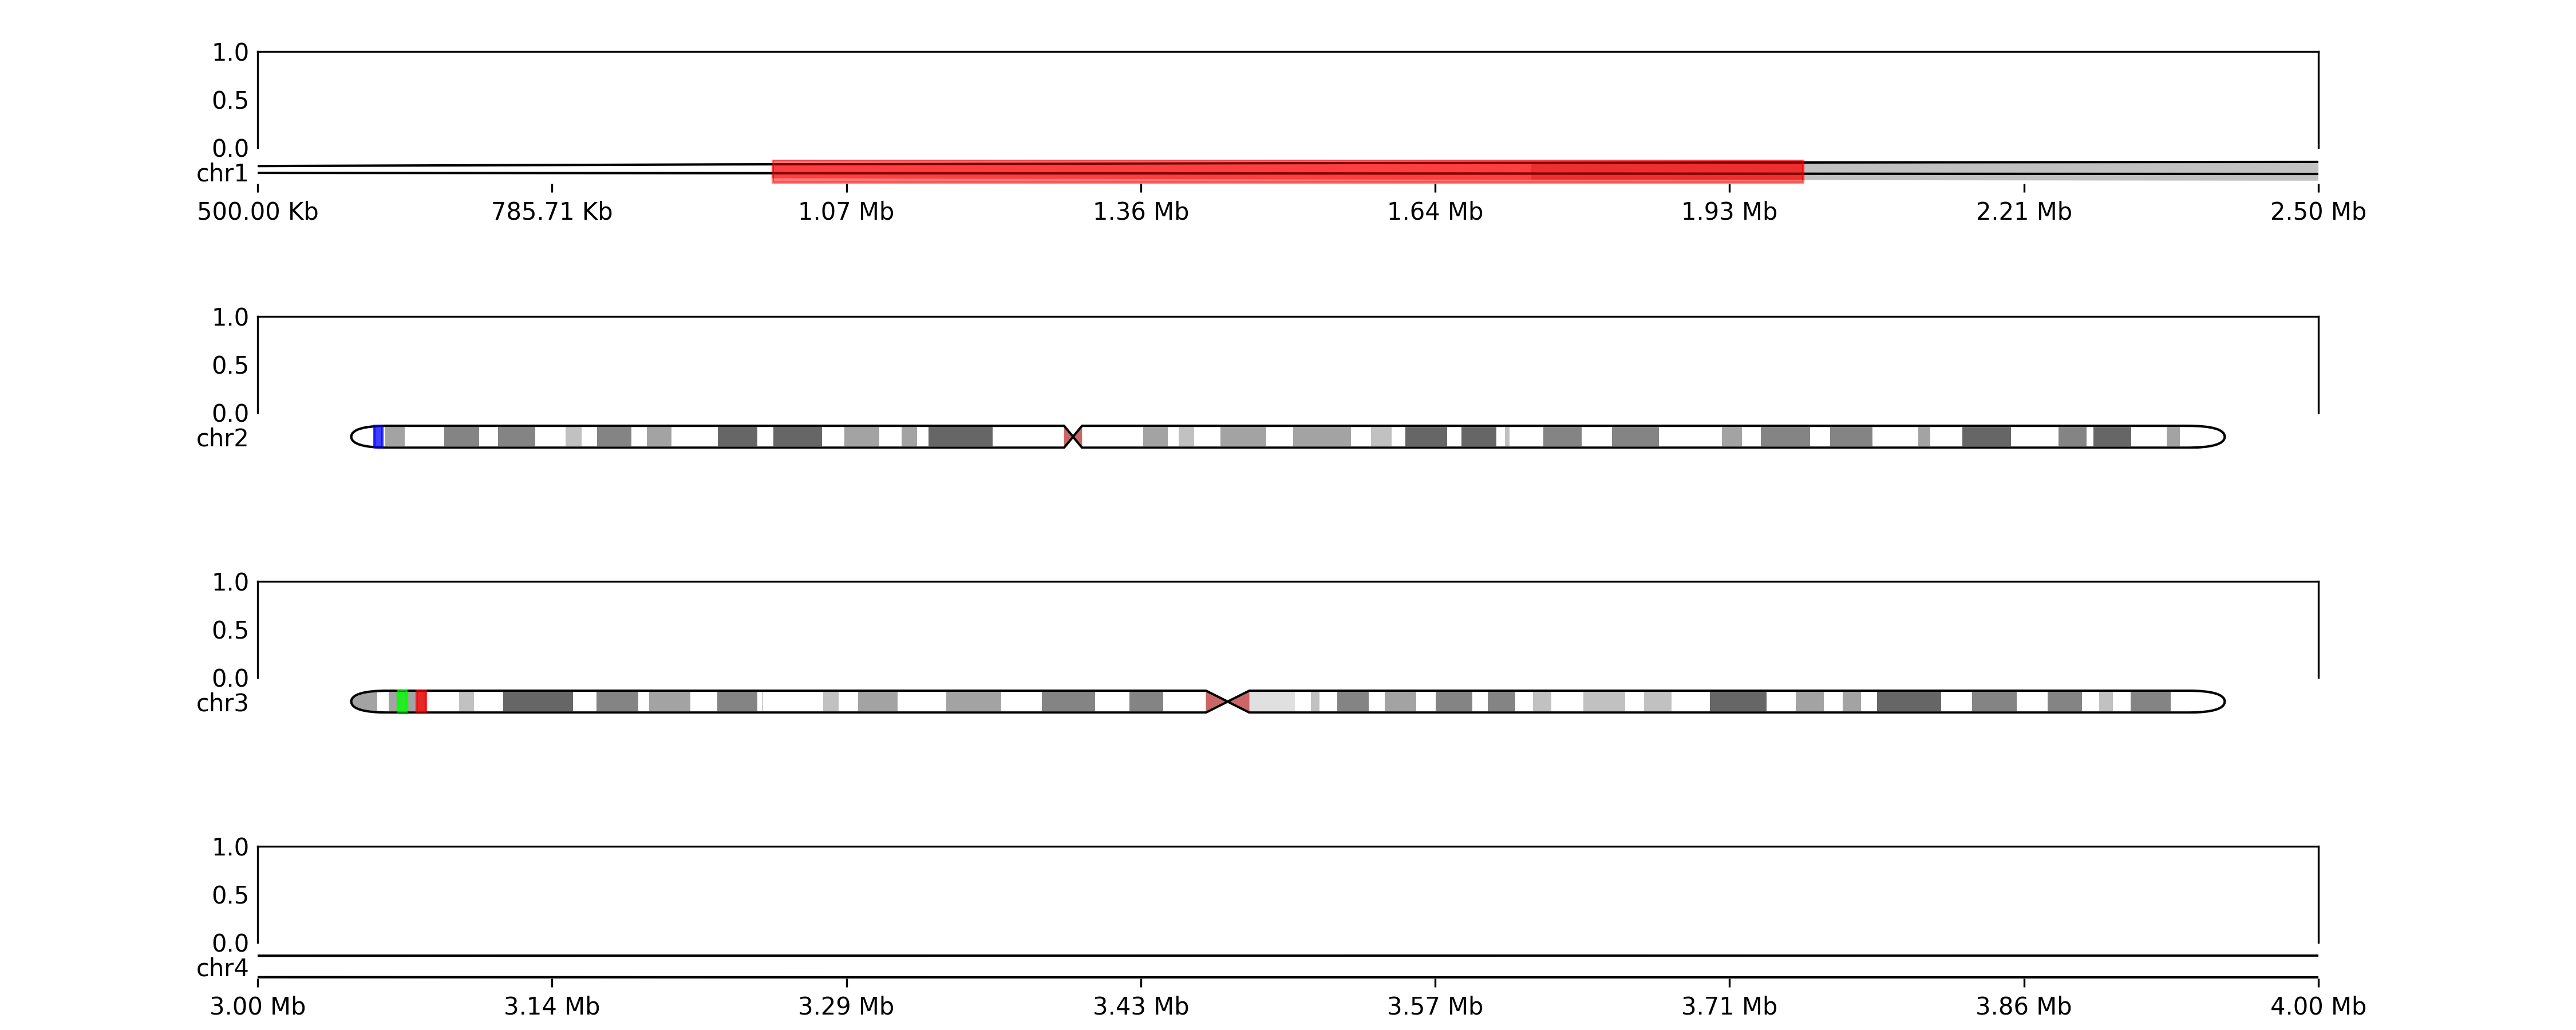
maybe we want to zoom in on specific regions
zoomregions = {'chr1': (500000, 2500000), 'chr4': (3000000, 4000000)}
for chr in zoomregions:
zoom(ideogramaxes[chr], start=zoomregions[chr][0], stop=zoomregions[chr][1])
fig.savefig(OUTDIR / "ideogram_grid4.png", dpi=300)
Will output:
or we want to show coordinates
for chr in zoomregions:
addideogramcoordinates(ideogramaxes[chr])
resetcoordinates(ax[chr], ideogramaxes[chr])
fig.savefig(TESTDIR / "ideogramgrid5.png", dpi=300)
```
Will output:
TODOs
- Investigate the creation of circos plots, by polar transformation.
- Provide more detailed documentation, as some features are not described
License
karyopyploter is distributed under the terms of the BSD-3-Clause license. Feel free to use in both academic and commercial applications, and please consider to cite the software in your work.
Cytoband data
- HG38
- HG19
- CHM13
Owner
- Name: Vassilis Lemonidis
- Login: VasLem
- Kind: user
- Location: Leuven, Belgium
- Company: KU Leuven
- Website: https://alterinspired.wordpress.com/
- Repositories: 1
- Profile: https://github.com/VasLem
Computer Vision and Machine Learning Engineer, MSc in Bioinformatics
GitHub Events
Total
- Release event: 7
- Watch event: 2
- Delete event: 5
- Push event: 21
- Pull request event: 1
- Fork event: 1
- Create event: 9
Last Year
- Release event: 7
- Watch event: 2
- Delete event: 5
- Push event: 21
- Pull request event: 1
- Fork event: 1
- Create event: 9
Issues and Pull Requests
Last synced: 6 months ago
All Time
- Total issues: 0
- Total pull requests: 2
- Average time to close issues: N/A
- Average time to close pull requests: 5 minutes
- Total issue authors: 0
- Total pull request authors: 1
- Average comments per issue: 0
- Average comments per pull request: 0.0
- Merged pull requests: 2
- Bot issues: 0
- Bot pull requests: 0
Past Year
- Issues: 0
- Pull requests: 2
- Average time to close issues: N/A
- Average time to close pull requests: 5 minutes
- Issue authors: 0
- Pull request authors: 1
- Average comments per issue: 0
- Average comments per pull request: 0.0
- Merged pull requests: 2
- Bot issues: 0
- Bot pull requests: 0
Top Authors
Issue Authors
Pull Request Authors
- VasLem (2)
Top Labels
Issue Labels
Pull Request Labels
Packages
- Total packages: 1
-
Total downloads:
- pypi 27 last-month
- Total dependent packages: 0
- Total dependent repositories: 0
- Total versions: 4
- Total maintainers: 1
pypi.org: karyopyploter
Package to mimic the functionality of KaryoploteR, but in Python.
- Documentation: https://github.com/vaslem/karyopyploter#readme
- License: MIT License
-
Latest release: 0.2.0
published 9 months ago
Rankings
Maintainers (1)
Dependencies
- matplotlib >=3.0.0
- numpy >=2.0.0
- pandas >=2.0.0
- typeguard >=4.0.0