cyclistic
Science Score: 18.0%
This score indicates how likely this project is to be science-related based on various indicators:
-
✓CITATION.cff file
Found CITATION.cff file -
○codemeta.json file
-
○.zenodo.json file
-
○DOI references
-
○Academic publication links
-
○Academic email domains
-
○Institutional organization owner
-
○JOSS paper metadata
-
○Scientific vocabulary similarity
Low similarity (6.9%) to scientific vocabulary
Repository
Basic Info
- Host: GitHub
- Owner: stvceyvd
- Language: R
- Default Branch: main
- Size: 90.8 KB
Statistics
- Stars: 0
- Watchers: 1
- Forks: 0
- Open Issues: 0
- Releases: 0
Metadata Files
README.md
Case Study - How Does a Bike-Share Navigate Speedy Success?
Introduction
In this case study, I will be following the steps of data analysis taught in the Google Data Analytics Professional Certificate course -- ask, prepare, process, analyze, share, and act -- as a junior data analyst in the marketing analyst team for a fictional bike-share company, Cyclistic.
About Cyclistic
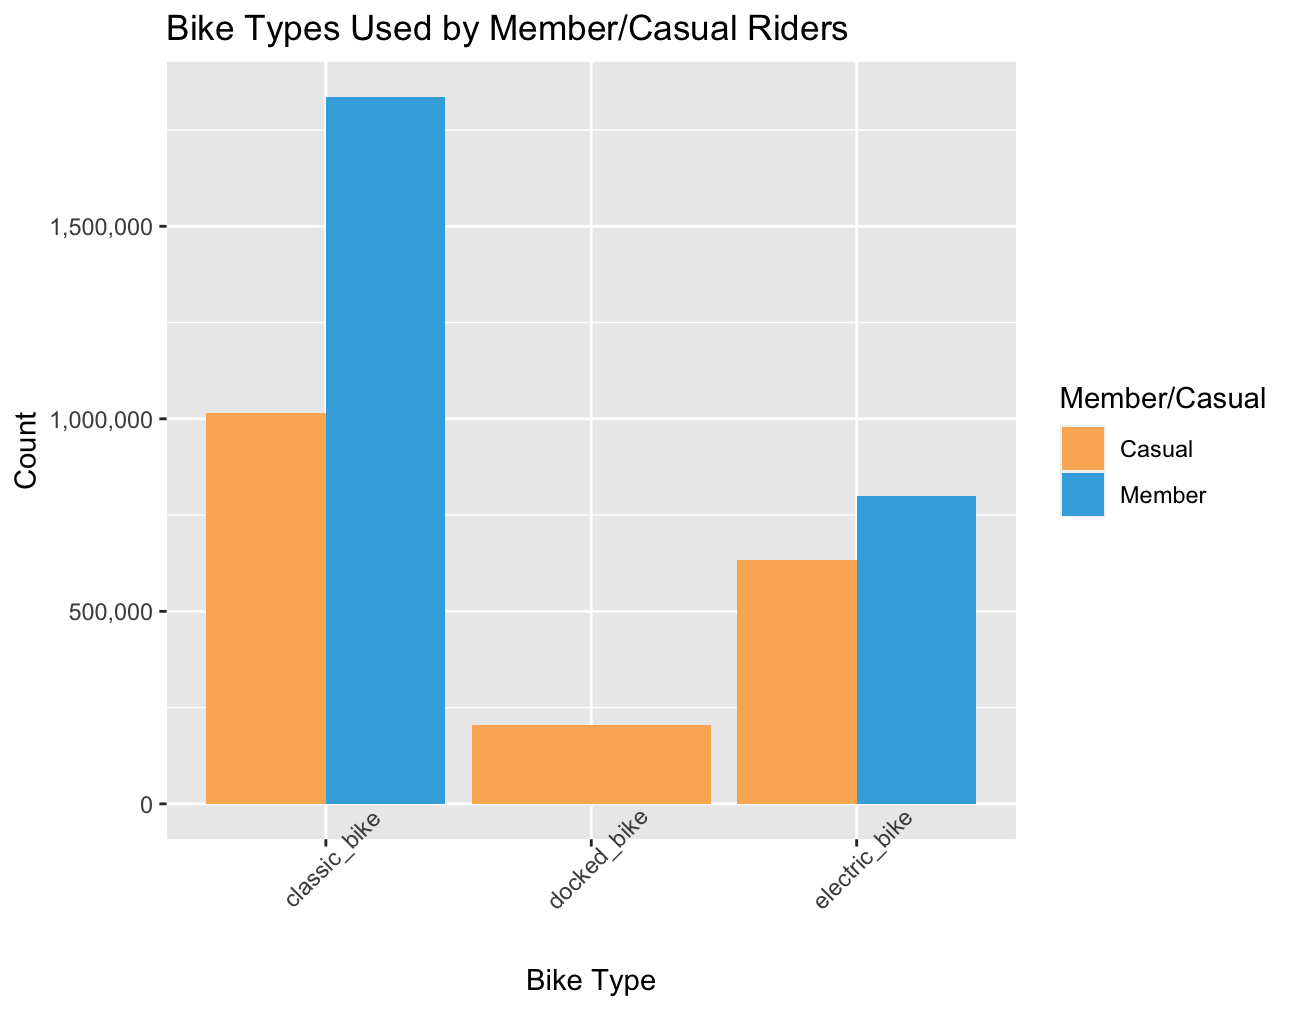
Based in Chicago, Cyclistic is a bike-share program that features more than 5,800 bicycles and 600 docking stations. Cyclistic sets itself apart by offering reclining bikes, hand tricycles, and cargo bikes, making bike-share more inclusive to people with disabilities and riders who can’t use a standard two-wheeled bike. The majority of riders opt for traditional bikes; about 8% of riders use the assistive options. Cyclistic users are more likely to ride for leisure, but about 30% use them to commute to work each day.
Until now, Cyclistic’s marketing strategy relied on building general awareness and appealing to broad consumer segments. One approach that helped make these things possible was the flexibility of its pricing plans: single-ride passes, full-day passes, and annual memberships. Customers who purchase single-ride or full-day passes are referred to as casual riders. Customers who purchase annual memberships are Cyclistic members.
Cyclistic’s finance analysts have concluded that annual members are much more profitable than casual riders. Although the pricing flexibility helps Cyclistic attract more customers, Moreno believes that maximizing the number of annual members will be key to future growth. Rather than creating a marketing campaign that targets all-new customers, Moreno believes there is a very good chance to convert casual riders into members. She notes that casual riders are already aware of the Cyclistic program and have chosen Cyclistic for their mobility needs.
Scenario
The director of marketing, Lily Moreno, believes the company’s future success depends on maximizing the number of annual memberships. Therefore, the team needss to understand how casual riders and annual members use Cyclistic bikes differently. From these insights, we will design a new marketing strategy to convert casual riders into annual members.
Business Task
Analyze Cyclistic historical bike trip data to identify trends and better understand the differences between casual riders and annual riders, and apply these insights into new design marketing strategies.
Primary Stakeholders
Lily Moreno: The director of marketing and your manager. Moreno is responsible for the development of campaigns and initiatives to promote the bike-share program. These may include email, social media, and other channels.
Cyclistic executive team: The notoriously detail-oriented executive team will decide whether to approve the recommended marketing program.
Secondary Stakeholders
- Cyclistic Marketing Analytics Team: A team of data analysts who are responsible for collecting, analyzing, and reporting data that helps guide Cyclistic marketing strategy. You joined this team six months ago and have been busy learning about Cyclistic’s mission and business goals — as well as how you, as a junior data analyst, can help Cyclistic achieve them.
About the Data
Provided by Google, the datasource used for this case study can be found here, made available by Motivate International Inc. under this license.
Limitations Using the ROCCC approach learned during the course, I will address any limitations within the data set. - Reliability: There is a total of 4,487,941 bike trips to be analyzed in this case study. This is a large dataset that will provide more accurate values that will better represent the bike trips in Chicago during the period of investigation. - Original: The data has been collected by the city of Chicago's ("City") Divvy bicycle sharing service, powered by Lyft, indicating there is a direct relationship between the entity and users. Additionally, it is made available by Motivate International Inc. under an agreement license. - Comprehensive: Dataset contains the variables (start/end time, station ids, rideable type, etc.) that are necessary to understand how casual and member riders use bikesharing services differently. - Current: The data is reflects current trends, as the datasource is periodically updated. For my analysis, I have also decided to use the most recent collected data to ensure its relevancy. - Cited: The data was collected by Lyft Bikes and Scoots, LLC ("Bikeshare"), which operates the City of Chicago's Divvy Bicycle Sharing service. This data has been permitted to be available to the public, by the city and under a Data License Agreement, making it a reliable source of data.
Overall, this data set does meet the ROCCC standard and is recommendeded to make business decisions.
For my analysis, I've decided to focus on the data from the past year (Sept 2021 - August 2022), using 12 CSV files from the link shared above.
Data Processing
For this case study, I used entirely R Studio to process, clean, transform, analyze, and visualize the data. I began the clean process by checking for: empty rows, duplicates, misleading records, N/A values, and any inconsistencies. View my changelog here.
Data Visualizations
Insights:
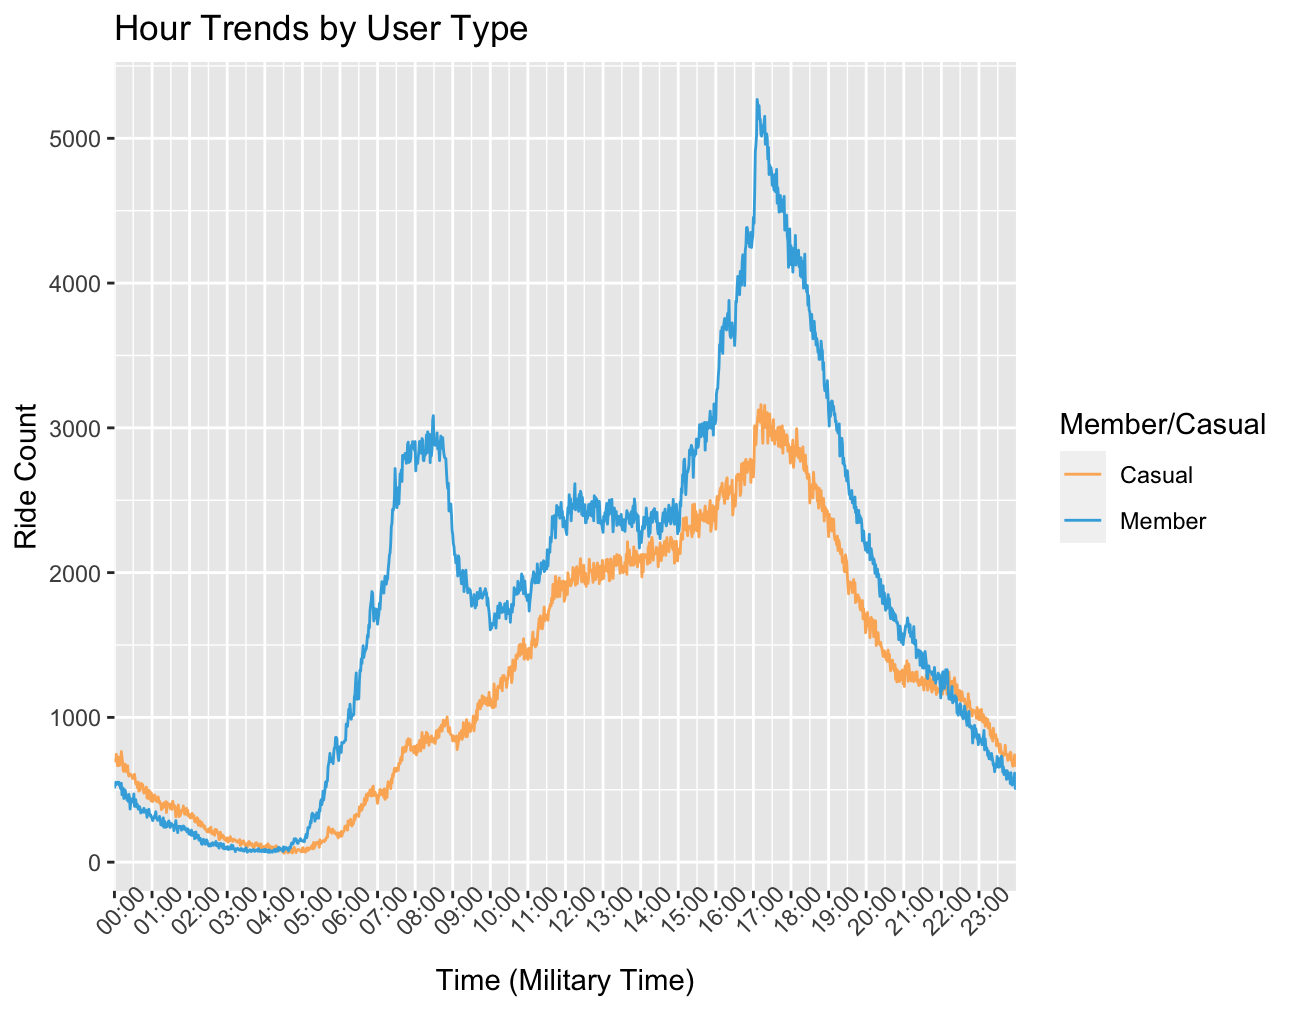
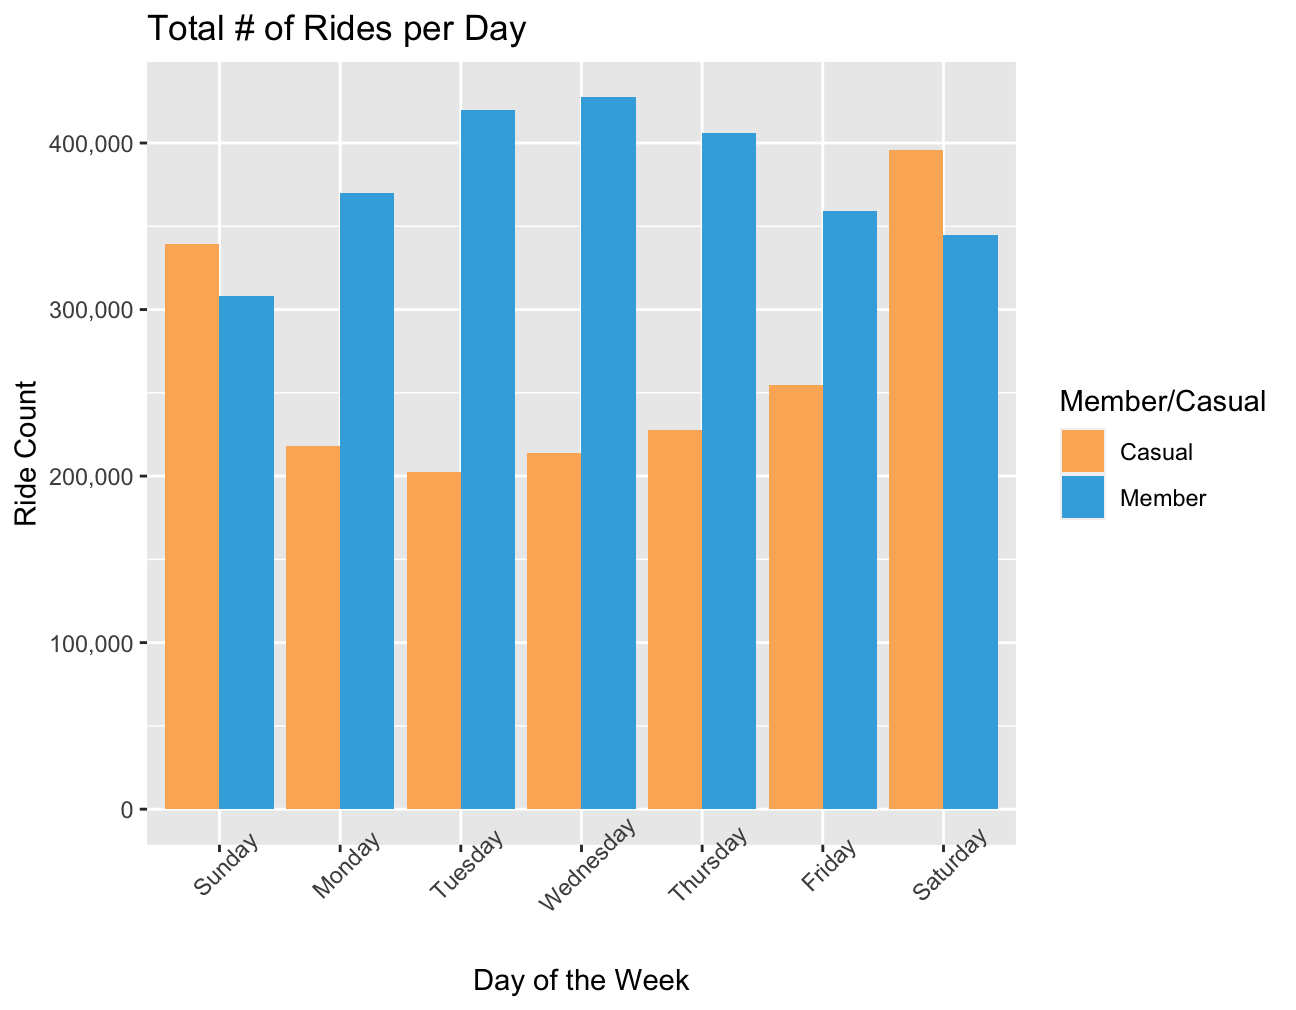
- Members ride more on weekdays (mainly for commutes during rush hour) and casual riders ride more on the weekends (mainly for leisure).
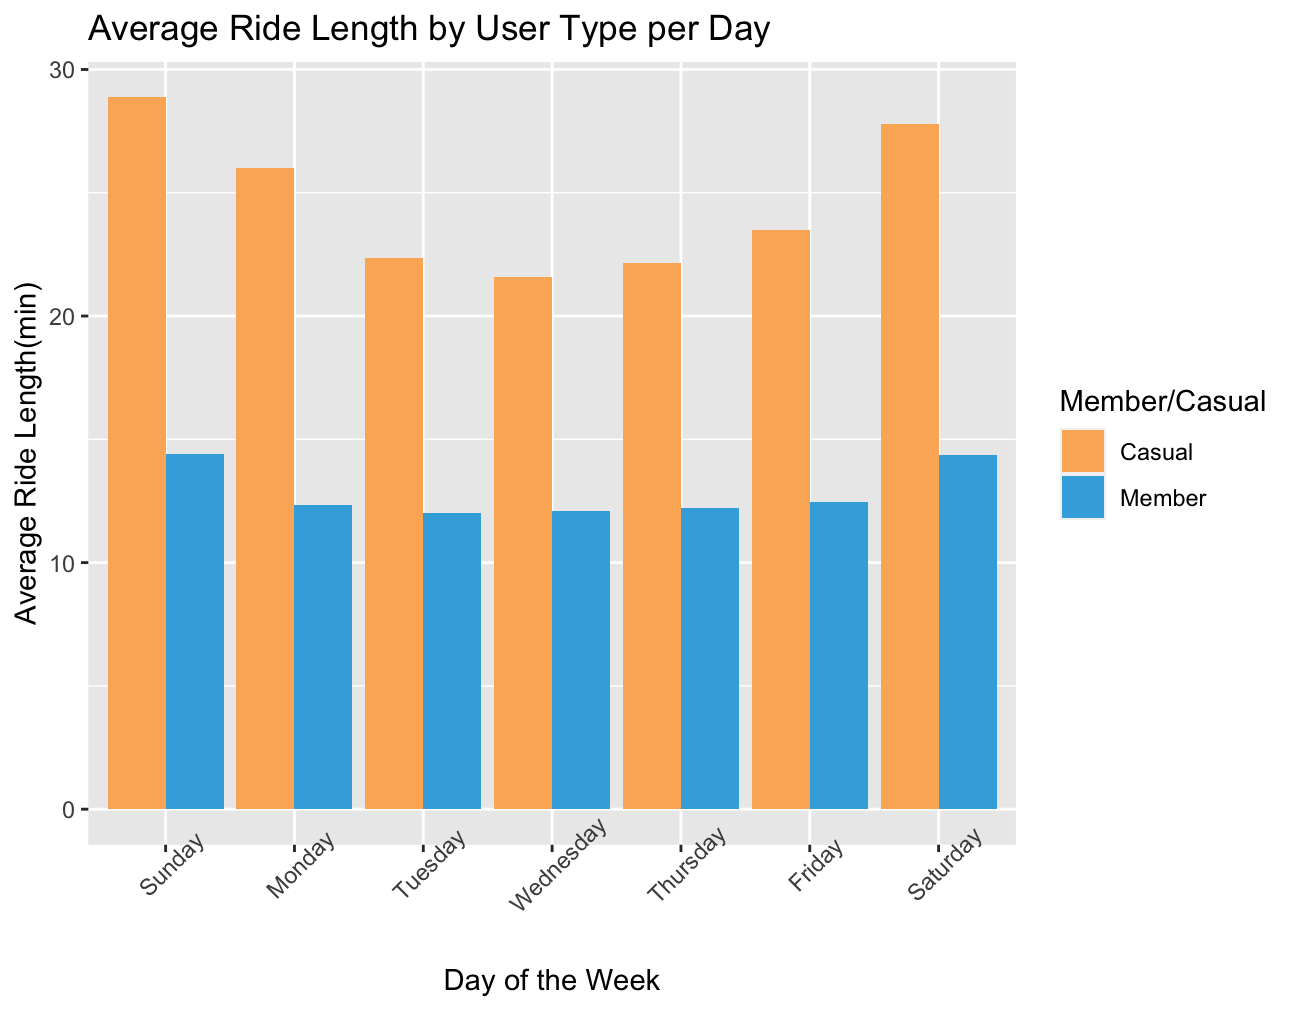
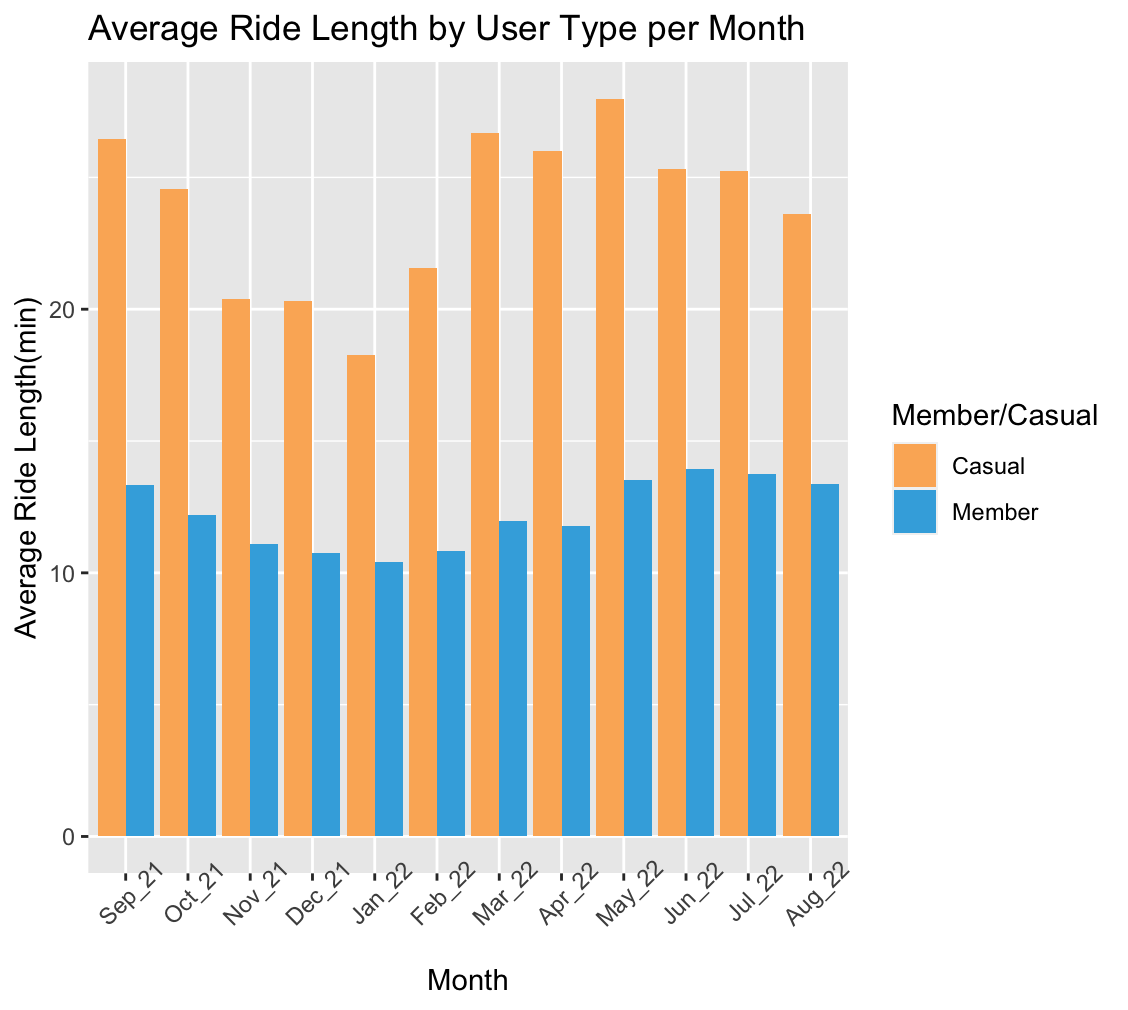
- Although members ride more overall (higher ride count), casual riders travel nearly 50% longer in terms of duration compared to member riders.
- For both casual and member riders, travel peak time is around 4:30-6:30 PM. However, we see that there are more casual rides around that time.
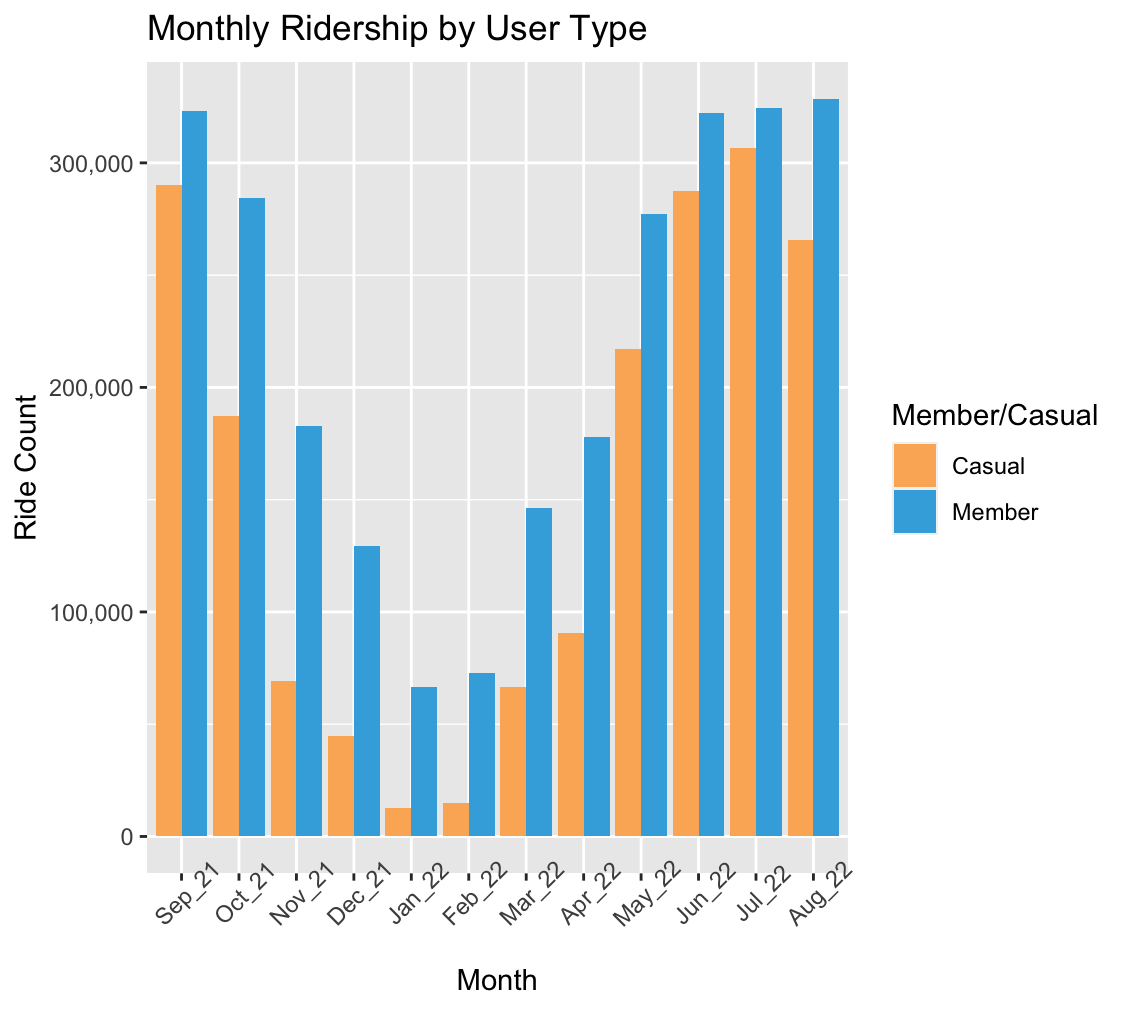
- Bike-sharing service is more popular in the warmer season/months (April-October) than in the colder season/months (November-March).
Recommendations:
- Run a promotion/sale for annual memberships at the beginning of the surge (April) to entice casual members to upgrade their plan for the summer.
- Increase the price for single-ride and full-day passes on the weekends when there are more casual riders traveling. Doing this will encourage casual riders to upgrade their membership plan in order to save and avoid the high cost.
- Offer discounts on fares (during peak hour) as an incentive if user upgrades to annual membership.
Citation (Citations.md)
Sources:

Motivate International Inc. "divvy-tripdata" Amazon Web Services, https://divvy-tripdata.s3.amazonaws.com/index.html.