citation-graph-python
Auto-generation of Citation Graph of References in Python
Science Score: 18.0%
This score indicates how likely this project is to be science-related based on various indicators:
-
✓CITATION.cff file
Found CITATION.cff file -
○codemeta.json file
-
○.zenodo.json file
-
○DOI references
-
○Academic publication links
-
○Academic email domains
-
○Institutional organization owner
-
○JOSS paper metadata
-
○Scientific vocabulary similarity
Low similarity (13.3%) to scientific vocabulary
Repository
Auto-generation of Citation Graph of References in Python
Basic Info
- Host: GitHub
- Owner: lanstonchu
- Language: TeX
- Default Branch: master
- Homepage: https://lanstonchu.wordpress.com/2019/09/22/automatic-generation-of-academic-citation-graph-python-version/
- Size: 9.13 MB
Statistics
- Stars: 29
- Watchers: 1
- Forks: 2
- Open Issues: 0
- Releases: 0
Metadata Files
README.md
Project Title: Automatic Generation of Academic Citation Graph (Python Version)
Also on: WordPress
Source Code and Data: Original Wolfram Language version, Python version and Java version
This Python tool will automatically generate a citation graph of a given set of papers. This is a Python version of a similar tool that I previously created in Wolfram Language.
Procedures:
- Download Chrome Driver at here with respect to your Chrome version and OS (the current versions stored in my Github repository are for Chrome version v77 and v83 (default in code), and are for Windows only)
- Select papers from your references management software (e.g. Mendeley) and export to .bib file.
- Run Citation_Tree.py to draw citation graph. Examples:
- Command lines example 1: run
python Citation_Tree.py --chrome --driver-path .//chromedriver_win32_v83.exe .//My_Collection_DAG.bib - Command lines example 2 (headless): run
python Citation_Tree.py --headless --driver-path .//chromedriver_win32_v83.exe .//My_Collection_DAG.bib - Spyder example 1: put
--chrome --driver-path .//chromedriver_win32_v83.exe .//My_Collection_DAG.bibin Run -> Configuration per file -> Command line options - Spyder example 2 (headless): put
--headless --driver-path .//chromedriver_win32_v83.exe .//My_Collection_DAG.bibin Run -> Configuration per file -> Command line options
- Command lines example 1: run
Notes:
- This Python version can only draw DAG. If you got an error because your network is not DAG, please remove some papers in your .bib file.
- If your Chrome driver doesn't work, please confirm you are using the correct driver version.
- If the graph doesn't look good, you may want to change figsize and rerun the "last 3 lines only" to save time
- Or you may re-run starting from the line "posi={}"
- In my code, I set the desired distance between vertices to be 0.7, and I will loop through all vertices for 1.4*x times, where x is the number of vertices. You may want to adjust these parameters according to your own requirement in graph quality and run time.
- Some references quoted by the paper may not be contained in the database (i.e. Astrophysics Data System of Harvard), but basically it's fine. And in some rare cases, the number of references of a specific paper may exceed 25 in the database, and in those case my program will only extract the first 25 references.
Details:
In certain fields of academic studies (e.g. Deep Learning), academic papers are released in a much faster speed than people in the field read them (although it is certainly true in all fields). As researchers, we know that we want to know how the papers fit into the whole academic conversation, so it would be nice if we can automatically generate an academic paper citation graph, and immediately tell which one cites which.
I created a tool for you homo academicus to automatically create the said citation graph for any paper. This should be helpful for researchers to catch up on the trend of a rapidly changing field.
First, if you are using Mendeley (or any other Reference Management Software), export your papers as a .bib file which should include the arXiv ID and issue year information. Then, use Python to run the code. It will take you to the Astrophysics Data System of Harvard and find out the list of reference for each paper. Finally, a citation graph will be drawn with the help of Python.
See the below example. Here, I’ve selected a list of papers in Mendeley about adversarial examples (published in the past five years), and I want to know how they are related to each other (“citationally”).
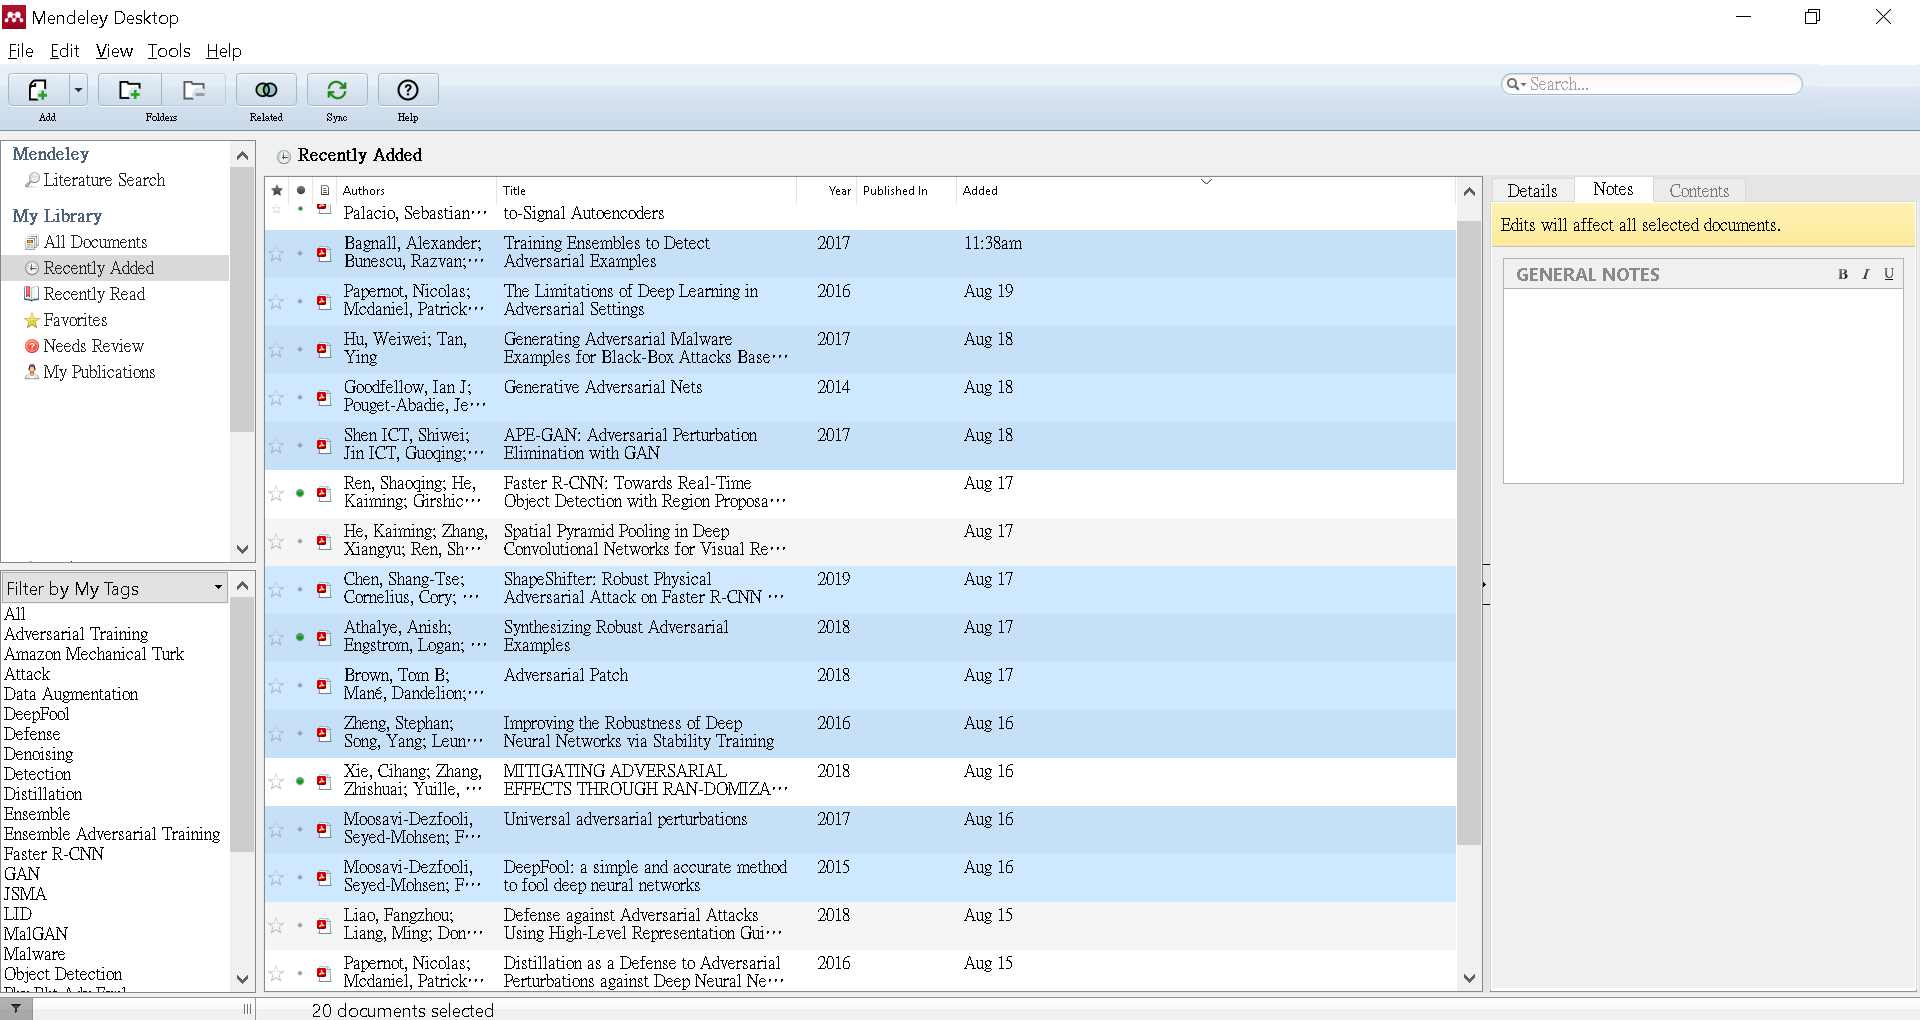
Click File->Export and then save the papers’ metadata as MyCollectionDAG.bib.
Download Chrome Driver at here with respect to your Chrome version (the current version in my Github repository are for Chrome version v77 and v83 (default in code) only)
Run the code Citation_Tree.py. This is the end product:

You can see that Transferability in Machine Learning: from Phenomena to Black-Box Attacks using Adversarial Samples (Papernot et. al. 2016) and Explaining and harnessing adversarial examples (Goodfellow et. al. 2014) are the most influential nodes among those selected papers (i.e. most cited).
If you want to add more information (say author) to the vertex labels, you can modify the second to last column of dataallpapers (i.e. vrtnamemulti_lines) to do that. You just need to change a few lines so I am not going to be verbose here.
Enjoy.
Owner
- Name: Lanston Chu
- Login: lanstonchu
- Kind: user
- Company: University of Wisconsin-Madison
- Website: https://lanstonchu.wordpress.com
- Repositories: 2
- Profile: https://github.com/lanstonchu
Graduate student in Computer Science department. Research areas: machine learning & deep learning. Email: echo hrjopkjtdqacirehbtki | tr a-t @.g-ua-c
Citation (Citation_Tree.py)
# to be done:-

# 1. also get "next page"
# 2. avoid empty data error

# download Chrome Driver at https://chromedriver.chromium.org/downloads
# make sure the driver you used w.r.t your Chrome version

import bibtexparser
from selenium import webdriver
import time
import re
import argparse

# for drawing graphs
import pandas as pd
import numpy as np
import networkx as nx
import matplotlib.pyplot as plt
import random

def search_by_head_tail(longText,head,tail):
    # this function will search for the first head matching the result
    # and then the first tail after the first head
	# e.g. search_by_head_tail("<id>123</id>", "<id>", "</id>") outputs "123"

    posi_start=longText.find(head)
    posi_end=longText.find(tail,posi_start)
    length_head=len(head)
    phase_extracted=longText[(posi_start+length_head):posi_end]

    return phase_extracted

def cut_string(str,max_length):
    str_slices=str.split()

    l_total=0
    str_total=''
    for word in str_slices:
        l=len(word)
        if l_total+1+l<=max_length:
            if str_total=='': #initial position
                str_total=word
            else:
                str_total=str_total+' '+word
            l_total=l_total+1+l
        else:
            str_total=str_total+'\n'+word
            l_total=l

    return str_total

def sort_dict(data_papers,column_i):
    # this function will sort the papers by years

    #x[1] refers to value of x, while x[0] is the key.
    data_papers_sorted_list=sorted(data_papers.items(), key=lambda x: x[1][column_i])

    # convert the list back into the dictionary
    data_papers_sorted={}
    for paper in data_papers_sorted_list:
        data_papers_sorted[paper[0]]=paper[1]

    return data_papers_sorted

def vertices_less_dense(posi):
    # this function makes the vertices less dense in graph

    coord=np.array(list(posi.values()))
    # distance matrix times 100 so that they won't be selected as the min value
    distance_vrt=np.ones((num_vertices,num_vertices))*100

    # calculate distance
    for i in range(num_vertices-1):
        for j in range(i+1,num_vertices):
            distance_vrt[i,j]=np.linalg.norm(coord[i]-coord[j])
            # distance_vrt[j,i]=distance_vrt[i,j]

    idx_min = np.argmin(distance_vrt, axis=1)

    # range from num-1,...,0 (ignore num-1 since that don't contain useful info)
    for i in range(num_vertices-1):

        # in a sorted DAG, for every pair of vertices,
        # one vert is at the "up-side", while one is at the "down side"
        i_up=i
        i_down=idx_min[i]

        # drive vertice of i_down away from the cloest point
        dist_desired=0.7
        dist_now=np.linalg.norm(coord[i_up]-coord[i_down])
        shift_factor=(dist_desired-dist_now)*1
        coord[i_up]=coord[i_up]+(coord[i_up]-coord[i_down])*shift_factor

    posi_new={}
    i=0
    for x in posi:
        posi_new[x]=coord[i]
        i+=1

    return posi_new

parser = argparse.ArgumentParser()

parser.prog = "Citation-Tree"
parser.description = "Creates a reference graph from a BibTex bibliography." + \
        "Note that the bibliography cannot contain cyclical references."
parser.epilog = "Example usage: python Citation-Tree.py My_Collection_DAG.bib"

parser.add_argument('bibfile', help="Path to the bibliograpy")
parser.add_argument("--headless", action='store_true', help="Run in headless mode")
# Bibtexparser normally ignores these by default, but this flag inverts that.
parser.add_argument("--ignore_nonstandard_types", action='store_true',
        help="Ignore non-standard BibTex entries")

drivers = parser.add_mutually_exclusive_group()
drivers.add_argument("--chrome", dest="webdriver", action="store_const",
        const="chrome", default="chrome", help="Use ChromeDriver (default)")
drivers.add_argument("--firefox", dest="webdriver", action="store_const",
        const="firefox", help="Use GeckoDriver")
drivers.add_argument("--phantomjs", dest="webdriver", action="store_const",
        const="phantomjs", help="Use GhostDriver")

parser.add_argument('--driver-path', help="Path to webdriver binary")

args = parser.parse_args()

# sometimes we used /abs/, sometimes we used /#abs/. Depending on situation
linkPrefix = "https://ui.adsabs.harvard.edu/#abs/"
absLinkSuffix = "/abstract"
refLinkSuffix = "/references"

with open(args.bibfile, encoding='utf8') as bibtex_file:
    parser = bibtexparser.bparser.BibTexParser(
        ignore_nonstandard_types=args.ignore_nonstandard_types
    )
    bib_database = bibtexparser.load(bibtex_file, parser)

papers=bib_database.entries
num_papers=len(papers)

driver_kwargs = {}

if args.webdriver == 'chrome':
    driver_kwargs['options'] = webdriver.ChromeOptions()
    driver = webdriver.Chrome
elif args.webdriver == 'firefox':
    driver_kwargs['options'] = webdriver.FirefoxOptions()
    driver = webdriver.Firefox
elif args.webdriver == 'phantomjs':
    driver = webdriver.PhantomJS
else:
    raise ValueError("args.webdriver contains an unknown driver type")

if args.driver_path:
    driver_kwargs['executable_path'] = args.driver_path
if args.headless and 'options' in driver_kwargs:
    driver_kwargs['options'].add_argument('--headless')
    driver_kwargs['options'].add_argument('--disable-gpu')

driver = driver(**driver_kwargs)

# surf Google as an initialization to keep time for later parts consistent
driver.get("https://www.google.com/")
time.sleep(3)

##### Section: Get paper's data #####

print("###    Section 1: Web scraping    ###")

data_all_papers={}
j=0
for paper in papers:

    j+=1
    print("Paper: "+str(j)+" of "+str(num_papers))

    if not 'arxivid' in list(paper.keys()):
        print(f'Entry "{ paper["ID"] }" has no arxivId present, skipping...')
        continue

    arXivID_before=paper['arxivid']

    if 'author' in list(paper.keys()):
        author=paper['author']
    else:
        author=''

    if 'year' in list(paper.keys()):
        year=paper['year']
    else:
        year=''

    # remove version number, which would not be used in the url
    vPosi=arXivID_before.find('v')
    if vPosi==-1:
        arXivID=arXivID_before
    else:
        arXivID=arXivID_before[0:vPosi]

    # get Bibcode and title of the paper
    absLink = linkPrefix + arXivID + absLinkSuffix
    driver.get(absLink)
    time.sleep(3)

    pageSourceAbs=driver.page_source

    bibCode=search_by_head_tail(pageSourceAbs,"bibcode=","\"") # bibCode as the key of data

    title=search_by_head_tail(pageSourceAbs,"<title>","</title>")

    # use Chrome to check Reference page
    refLink = linkPrefix + arXivID + refLinkSuffix

    # get reference info
    driver.get(refLink)
    time.sleep(3)

    # get source code
    pageSourceRef=driver.page_source

    num_Ref=search_by_head_tail(pageSourceRef,"References\n","</span>\n")
    num_Ref=search_by_head_tail(num_Ref,"(",")")
    print("Refrences: ("+str(num_Ref)+")")

    # find the position of papers' titles
    positions=[m.start() for m in re.finditer("h3 class", pageSourceRef)]
    num_papers_one_page = len(positions)
    positions.insert(0,0)

    list_children=[]
    for i in range(num_papers_one_page):
        posi_start=positions[i]
        posi_end=positions[i+1]
        posi_a_start=pageSourceRef.rfind("<a href=\"#", posi_start, posi_end)
        posi_a_end=pageSourceRef.rfind("\" class=\"", posi_start, posi_end)
        link_partial=pageSourceRef[(posi_a_start+10):posi_a_end]
        bibCode_child_i=link_partial[(link_partial.find('abs/')+4):link_partial.find('/abstract')]
        list_children.append(bibCode_child_i)

    vrt_name_one_line = title + ' - ' + author + ' - ' + year
    vrt_name_multi_lines=cut_string(vrt_name_one_line,25)

    # keep vrt_name_multi_lines,list_children to be the last two entries!!!
    one_paper_data=[author,year,title,arXivID,num_Ref, \
                    vrt_name_multi_lines,list_children]
    data_all_papers[bibCode]=one_paper_data

driver.close()

print("###    Section 2: Draw Graph    ###")

##### Section: remove non selected children; create data frame #####

# sort papers by years; 1 means the "2nd column" of one_paper_data
data_all_papers=sort_dict(data_all_papers,1)

bibCode_all_papers=list(data_all_papers.keys())

from_all_papers=[]
to_all_papers=[]
for bibCode_one_paper, data_one_paper in data_all_papers.items():
    list_children=data_one_paper[-1]
    list_children_remained=[x for x in list_children if x in bibCode_all_papers]
    data_one_paper[-1]=list_children_remained
    data_all_papers[bibCode_one_paper]=data_one_paper

    # create data frame
    num_child=len(list_children_remained)

    vrt_name_children_remained=[]
    for bibCode_child_i in list_children_remained:
        vrt_name_multi_lines=data_all_papers[bibCode_child_i][-2]
        vrt_name_children_remained.append(vrt_name_multi_lines)

    vrt_name_one_paper=data_all_papers[bibCode_one_paper][-2]

    from_one_paper=vrt_name_children_remained # the older paper
    to_one_paper=[vrt_name_one_paper]*num_child # the newer paper

    # concatenate the lists
    from_all_papers=from_all_papers+from_one_paper
    to_all_papers=to_all_papers+to_one_paper

##### Section: Draw Graph #####

# Build a dataframe with 4 connections
df = pd.DataFrame({ 'from':from_all_papers, 'to':to_all_papers})

# Build your graph
G=nx.from_pandas_edgelist(df, 'from', 'to', create_using=nx.DiGraph())

# determine vertices' coordinate
if not nx.is_directed_acyclic_graph(G):
    raise TypeError('Cannot to a graph that is not a DAG')

vertices_sorted=list(nx.topological_sort(G))

num_vertices=len(vertices_sorted)

posi={}
for i in range(num_vertices):
    vrt_name=vertices_sorted[i]
    posi_vert=-i/num_vertices
    posi_hori=random.random()
    posi[vrt_name]=np.array([posi_hori,posi_vert])

# make the vertices less dense
posi_new = vertices_less_dense(posi)

# logic similar to the EM algorithm to get a "good graph"
for i in range(round(num_vertices*1.4)):
    posi_new = vertices_less_dense(posi_new)

# if the graph doesn't look good, change figsize and rerun the last 3 lines
plt.figure(1,figsize=(18,18))
nx.draw(G,pos=posi_new,with_labels=True, node_size=150, arrows=True)
plt.show()
GitHub Events
Total
- Watch event: 1
Last Year
- Watch event: 1