lostruct-py
Science Score: 41.0%
This score indicates how likely this project is to be science-related based on various indicators:
-
✓CITATION.cff file
Found CITATION.cff file -
○codemeta.json file
-
○.zenodo.json file
-
✓DOI references
Found 8 DOI reference(s) in README -
✓Academic publication links
Links to: zenodo.org -
○Committers with academic emails
-
○Institutional organization owner
-
○JOSS paper metadata
-
○Scientific vocabulary similarity
Low similarity (17.4%) to scientific vocabulary
Repository
Basic Info
- Host: GitHub
- Owner: jguhlin
- License: mit
- Language: Jupyter Notebook
- Default Branch: master
- Size: 1.15 MB
Statistics
- Stars: 8
- Watchers: 3
- Forks: 2
- Open Issues: 7
- Releases: 3
Metadata Files
README.md
lostruct-py
This is a reimplementation of lostruct from the original code: lostruct, by Joseph Guhlin with assistance by Peter Ralph.


Demonstration
Please see the Example Notebook
Installation
Lostruct-py is available on PyPi
pip install lostruct is the easiest way to get started.
Usage
Input Files
Inputs should be a set of markers in BCF or VCF format. Both should be indexed as appropriate (see: bcftools index). Filtering before running this analysis is strongly suggested (Allele frequency, SNPs only, missingness, etc).
Citing
If you use this version, plesae cite it via Zenodo DOI: 10.5281/zenodo.3997106
as well as the original paper describing the method:
Li, Han, and Peter Ralph. "Local PCA shows how the effect of population structure differs along the genome." Genetics 211.1 (2019): 289-304.
CyVCF2
This project also uses cyvcf2 for fast VCF processing and should be cited:
Brent S Pedersen, Aaron R Quinlan, cyvcf2: fast, flexible variant analysis with Python, Bioinformatics, Volume 33, Issue 12, 15 June 2017, Pages 1867–1869, https://doi.org/10.1093/bioinformatics/btx057
Changes from Lostruct R package
Please note numpy and R are different when it comes to row-major vs. column-major. Essentially, many things in the python version will be transposed from R.
Requirements
Python >= 3.6 (may work with older versions). Developed on Python 3.8.5
- numba
- numpy
- cyvcf2
CyVCF2 requires zlib-dev, libbz2-dev, libcurl-dev, liblzma-dev; numa requires libllvm.
These may be installed with conda or pip, e.g. by running pip install -r requirements.txt.
Changes
See CHANGES.MD for the full list.
0.0.5 (pending)
- Smallest circle
- Better in-built JAX support
0.0.4
- Package name changed to lostruct
- Parallelization of getpcdists
- Implementation of fastmath parameter for getpcdists
Tests
Tests were derived from the Medicago HapMap data. The python package and the R package have high correlation of values. If values begin to deviate, theese tests will now fail.
To run tests simply do:
pip install pytest
pytest --benchmark-disable tests/test_fns.py
The tests furthermore require unittest and scikit-bio (and pytest to run them this way).
Benchmarks
To run tests with benchmarks, install the following:
pip install pytest-benchmark
Then run `pytest
TOX
Tox allows you run tests with multiple versions of the python interpreter in venvs. It is best to use pyenv to install multiple versions python to run before submitting pull requests to be certain tests complete successfully across all versions.
To run tests via tox: ``` pip install tox
```
Correlation Data
To test correlation of results between the R and Python versions we used data from the Medicago HapMap project, specifically SNPs for sister taxa chromsome 1, processed, and run with LoStruct R.
Data
bcftools annotate chr1-filtered-set-2014Apr15.bcf -x INFO,FORMAT | bcftools view -a -i 'F_MISSING<=0.2' | bcftools view -q 0.05 -q 0.95 -m2 -M2 -a -Oz -o chr1-filtered.vcf.gz
Lostruct Processing
Rscript run_lostruct.R -t SNP -s 95 -k 10 -m 10 -i data/
Run 21 Aug 2020, using lostruct R git hash: 444b8c64bebdf7cdd0323e7735ccadddfc1c8989
This generates the mds_coords.tsv that is used in the correlation comparison. Additionally, the existing tests cover correlation.
To test the weight generation, a random sample of weights was created and used. Output was moved to lostruct-results/weights_mds_coords.csv and generated with the randomweights.txt found in `testdata/random_weights.txt`.
./run_lostruct.R -i data -t snp -s 95 -k 10 -m 10 -w random_weights.txt
FAQ / Notes
Future
Currently the end-user is expected to save the outputs. But would be good to save it in a similar way to lostruct R-code. Please open an issue if you need this.
Feature Completeness with R implementation
We are not yet feature complete with the R implementation. If something is needed please check for existing issues and comment about your need.
PCA, MDS, PCoA
PCoA returns the same results as lostruct's MDS implementation (cmdscale). In the example Jupyter notebook you can see the correlation is R =~ 0.998. Some examples of other methods of clustering / looking at differences are included in the notebook.
Speed and Memory
NUMBA and CyVCF2 are used for speeding up processes, and the software becomes multithreaded by default. The Sparse library is used to reduce memory requirements. parse_vcf function is multithreaded. Distance calculation is not.
tl;dr of below
Below two options are offered, fastmath for getpcdists function, and method="fsvd" for pcoa. When using both you will see a performance increase and memory requirement decrease. Accuracy should decrease, but the absolute correlation we see with our test dataset remains ~0.998. Be aware when using fsvd the sign of the correlation may change.
JAX
Jax is an open-source library.... optional support in lostruct. Allows for processing on GPU and TPU (untested here, so far). See JAX. You can enable it in the function getpcdists by setting jax=True. This results in XX% speedup. Fastmath (below) and JAX are both supported, although JAX outperforms fastmath.
Fastmath
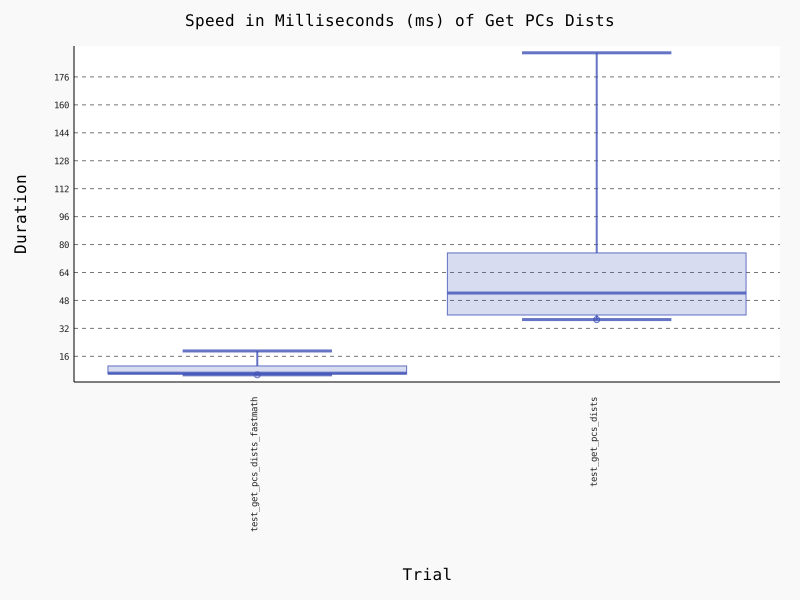
Additionally, a mode implemented Numba's "fastmath" is available. For the function getpcdists set fastmath=True. This results in a ~8% speed boost with very little change in the final output (correlation to R code output remains >= 0.995). This was benchmarked on the Medicago data used in the jupyter notebook using timeit, with 100 repeats with fastmath=False and Fastmath=True.
get_pc_dists(result, fastmath=True)
The difference with fastmath=True and leaving it off can be seen here. Note: Downloading the file will allow you to see more detailed information, as some javascript is contained in the SVG but disabled on GitHub.
If you need to limit thread usage, please see Numba's guide
Very Large Datasets
The R implementation handles very large datasets in less memory. The problem arises with the PCoA function. A metric MDS using sklearn may work. Another alternative would be to export the data and run cmdscale in R directly.
The sklearn MDS function differs from the scikit-bio function, here we focus on the scikit-bio version.
There are two options in python for this as well:
pcoa(method="fsvd", ...)
Which reduces memory and increases speed, at the cost of some accuracy.
pcoa(inplace=True, ...)
Centers a distance matrix in-place, further reducing memory requirements.
pcoa(number_of_dimensions=10)
Returns only the first 10 dimensions (configurable) of the scaling. This has no real effect if method is default or manuially set to "eigh" as the eigenvalues and eigenvectors are all calculated, so all are calculated and this becomes a truncation.
You can see the difference between method="fsvd" and method="eigh" (default) here. These are tested with a minimum of 50 rounds. Note: Downloading the file will allow you to see more detailed information, as some javascript is contained in the SVG but disabled on GitHub.

Using all three techniques, correlation is maintained although the sign may change.
mds = pcoa(pc_dists, method="fsvd", inplace=True, number_of_dimensions=10)
np.corrcoef(mds.samples["PC1"], mds_coords['MDS1'].to_numpy())[0][1]
-0.9978147088087447
For more information please see the applicable documentation as well as the relevant changelog. A Zenodo entry is also available on this topic.
References
Additional citations can be found in CITATIONS (UMAP, PHATE, Medicago HapMap).
Miscellaneous Notes
We are using the code formatter BLACK. Also, code coverage is actually 100% but numba JIT'd code is not properly counted. As long as all tests complete everything is working.
Owner
- Name: Joseph Guhlin
- Login: jguhlin
- Kind: user
- Location: Dunedin, New Zealand
- Website: http://www.josephguhlin.com/
- Repositories: 82
- Profile: https://github.com/jguhlin
Plant Genomicist and Bioinformatician interested in structural variation and pangenomics.
Citation (CITATIONS.md)
# Original lostruct
```
Li, Han, and Peter Ralph. "Local PCA shows how the effect of population structure differs along the genome." Genetics 211.1 (2019): 289-304.
```
# CyVCF2
Brent S Pedersen, Aaron R Quinlan, cyvcf2: fast, flexible variant analysis with Python, Bioinformatics, Volume 33, Issue 12, 15 June 2017, Pages 1867–1869, https://doi.org/10.1093/bioinformatics/btx057

https://github.com/brentp/cyvcf2

# Medicago Example Data
Guhlin, J., Peng, Z., Farmer., A, et al.
[Medicago HapMap 4.0 Downloads](http://www.medicagohapmap.org/downloads/Mt40/Mt4.0_HapMap_README.pdf)

# UMAP
McInnes, L, Healy, J, UMAP: Uniform Manifold Approximation and Projection for Dimension Reduction, ArXiv e-prints 1802.03426, 2018

# PHATE
Moon, van Dijk, Wang, Gigante et al. **Visualizing Transitions and Structure for Biological Data Exploration**. 2019. *Nature Biotechnology*.
GitHub Events
Total
- Watch event: 1
Last Year
- Watch event: 1
Committers
Last synced: over 3 years ago
All Time
- Total Commits: 76
- Total Committers: 3
- Avg Commits per committer: 25.333
- Development Distribution Score (DDS): 0.079
Top Committers
| Name | Commits | |
|---|---|---|
| jguhlin | j****n@g****m | 70 |
| peter | p****p@g****m | 4 |
| Alexis Simon | a****n@n****g | 2 |
Committer Domains (Top 20 + Academic)
Issues and Pull Requests
Last synced: 11 months ago
All Time
- Total issues: 8
- Total pull requests: 3
- Average time to close issues: 1 day
- Average time to close pull requests: about 5 hours
- Total issue authors: 3
- Total pull request authors: 2
- Average comments per issue: 2.88
- Average comments per pull request: 0.67
- Merged pull requests: 3
- Bot issues: 0
- Bot pull requests: 0
Past Year
- Issues: 0
- Pull requests: 0
- Average time to close issues: N/A
- Average time to close pull requests: N/A
- Issue authors: 0
- Pull request authors: 0
- Average comments per issue: 0
- Average comments per pull request: 0
- Merged pull requests: 0
- Bot issues: 0
- Bot pull requests: 0
Top Authors
Issue Authors
- jguhlin (5)
- petrelharp (2)
- ltalignani (1)
Pull Request Authors
- petrelharp (2)
- alxsimon (1)
Top Labels
Issue Labels
Pull Request Labels
Packages
- Total packages: 2
-
Total downloads:
- pypi 17 last-month
-
Total dependent packages: 0
(may contain duplicates) -
Total dependent repositories: 2
(may contain duplicates) - Total versions: 3
- Total maintainers: 2
pypi.org: lostruct
Re-implementation of lostruct in Python, used to compare local population structure across populations.
- Homepage: https://github.com/jguhlin/lostruct-py
- Documentation: https://lostruct.readthedocs.io/
- License: Python Software Foundation License
-
Latest release: 0.0.4
published almost 6 years ago
Rankings
Maintainers (2)
pypi.org: lostruct-py
Re-implementation of lostruct in Python, used to compare local population structure across populations.
- Homepage: https://github.com/jguhlin/lostruct-py
- Documentation: https://lostruct-py.readthedocs.io/
- License: Python Software Foundation License
-
Latest release: 0.0.3
published almost 6 years ago
Rankings
Maintainers (1)
Dependencies
- cyvcf2 >=0.20.4
- numba >=0.51.0
- numpy >=1.19.1
- scikit-bio >=0.5.6
- scikit-learn >=0.23.2
- sparse >=0.11.0
- cyvcf2 *
- numba *
- numpy *
- sparse *