Science Score: 49.0%
This score indicates how likely this project is to be science-related based on various indicators:
-
○CITATION.cff file
-
✓codemeta.json file
Found codemeta.json file -
✓.zenodo.json file
Found .zenodo.json file -
✓DOI references
Found 3 DOI reference(s) in README -
✓Academic publication links
Links to: zenodo.org -
○Committers with academic emails
-
○Institutional organization owner
-
○JOSS paper metadata
-
○Scientific vocabulary similarity
Low similarity (13.0%) to scientific vocabulary
Keywords
Keywords from Contributors
Repository
Publication-ready figures made easy
Basic Info
- Host: GitHub
- Owner: braniii
- License: bsd-3-clause
- Language: Python
- Default Branch: main
- Homepage: https://braniii.github.io/prettypyplot/
- Size: 10.9 MB
Statistics
- Stars: 8
- Watchers: 2
- Forks: 3
- Open Issues: 1
- Releases: 4
Topics
Metadata Files
README.md


prettypyplot
The documentation including an gallery can be found here.
This is a wrapper package for matplotlib to achieve more easily pretty figures. If you are looking for something complete, this project is nothing for you but maybe seaborn. The main aspect of this project is to help me syncing my rcParams files and to stop copy-pasting so much code.
The aim of this project is to simplify the generation of some simple pre-defined figures. Almost all code is inspired or taken from the matplotlib gallery. If you are a power user or interested in generating complex figures, this packages is not ment for you and you should better take a look in the matplotlib gallery directly.
This project is in an alpha stage, hence it is neither stable nor ready for production.
CAUTION: Starting from version 1.0.0 (which is far in the future) API-breaking changes will be made only in major releases. Until then, it can be changed in every minor release (see changelog).
Features
The most notable features are:
- Tested with matplotlib
3.3-3.10 - figsize specifies size of canvas. So labels, ticks or colorbars are not counted.
- Nice top-aligned outter legends
- New colors
Usage
This package uses an syntax very close to matplotlib. Hence, it should be straight forward to use it. Instead of calling a function on the axes itself, one needs to pass here the axes as an argument (args or kwargs).
Installation
python
python3 -m pip install --upgrade prettypyplot
or
python
conda install -c conda-forge prettypyplot
or for the latest dev version
python
python3 -m pip install git+https://github.com/braniii/prettypyplot.git
Usage
```python import matplotlib.pyplot as plt import prettypyplot as pplt
pplt.use_style() fig, ax = plt.subplots() ... pplt.plot(ax=ax, x, y) pplt.savefig(output) ```
Known Bugs
plt.subplots_adjust()does not work withpplt.savefig(use_canvas_size=True)If you find one, please open an issue.pplt.savefig(use_canvas_size=True)is not compatible with a grid of subplots
Known Workarounds
The method pyplot.subplots_adjust() is not compatible with the option
use_canvas_size in prettypyplot.plot.savefig,
use instead:
```python
this doesn't work, use instead gridspec
fig.subplots_adjust(hspace=0)
use this instead
fig, axs = plt.subplots(..., gridspec_kw={'hspace': 0.000}) ```
Comparison to matplotlib
matplotlib.pyplot.plot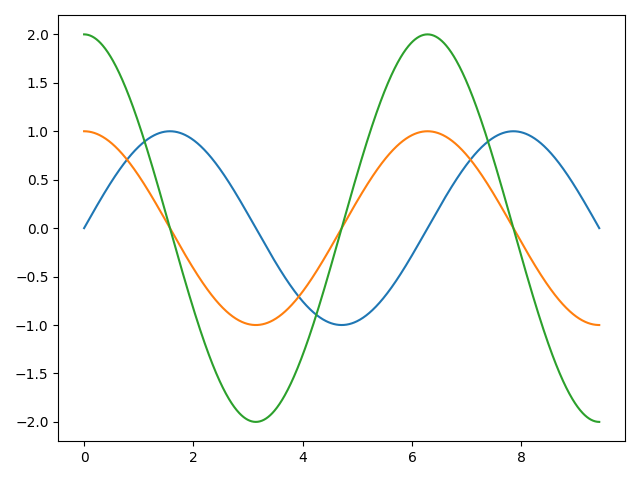
|
prettypyplot.plot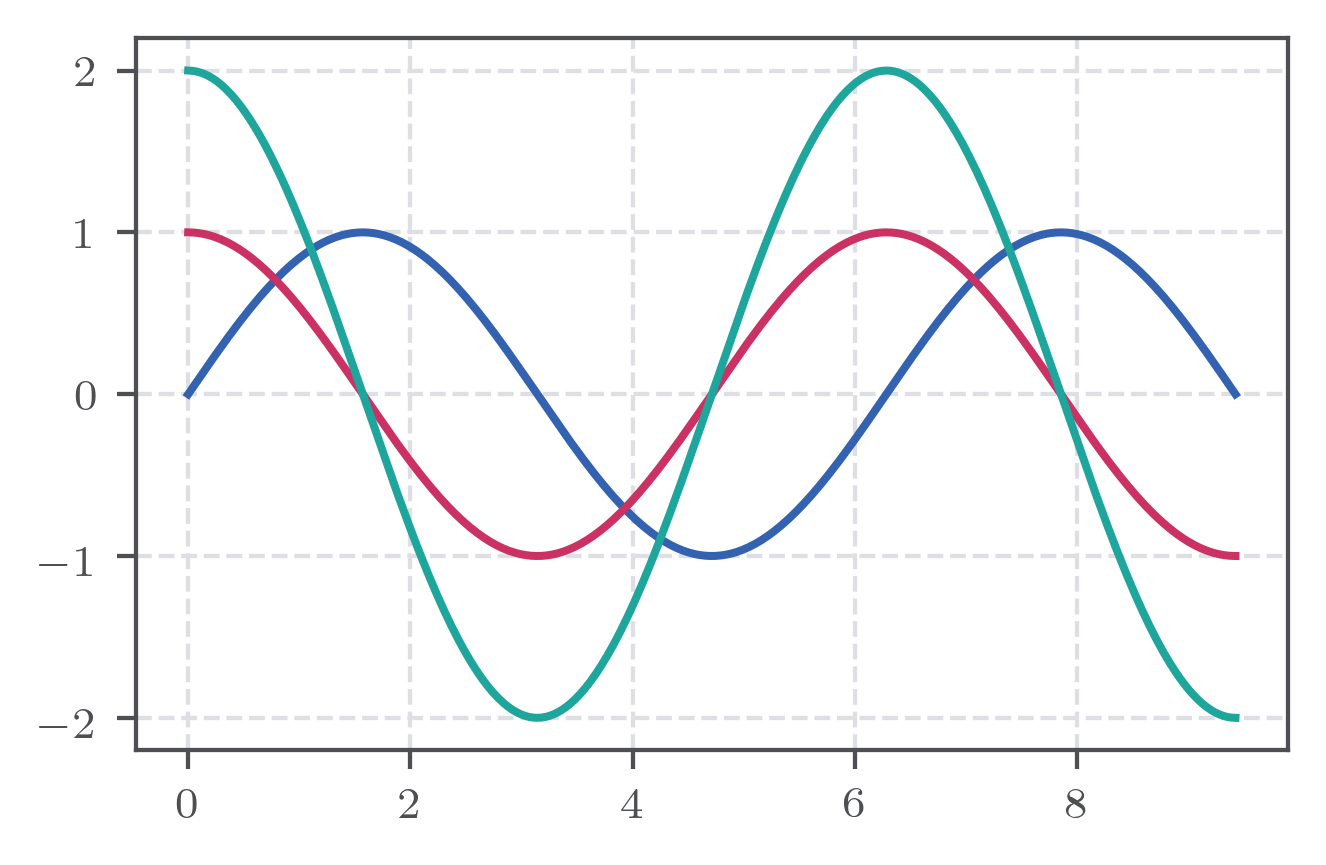
|
matplotlib.pyplot.legend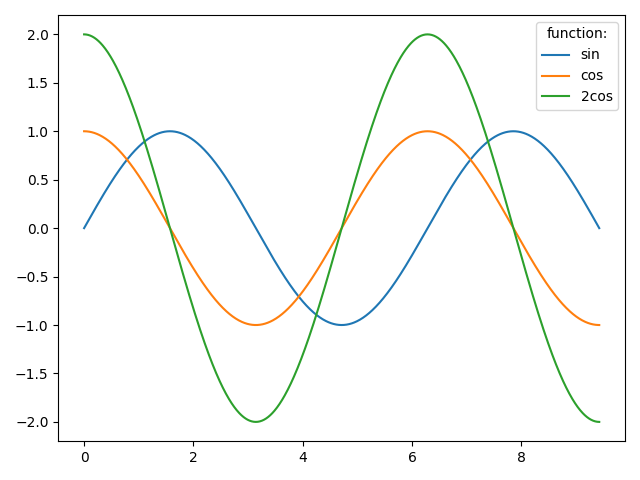
|
prettypyplot.legend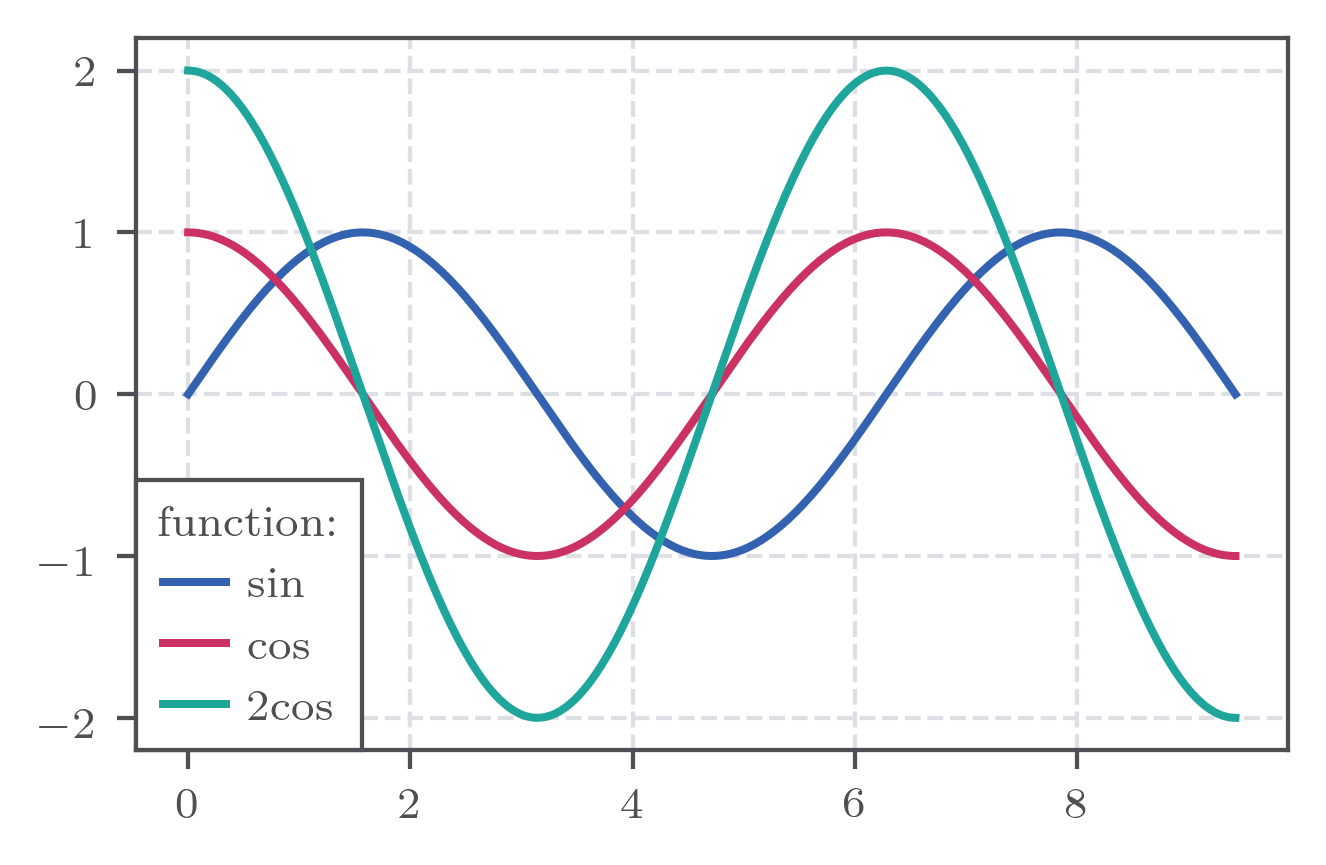
|
matplotlib.pyplot.imshow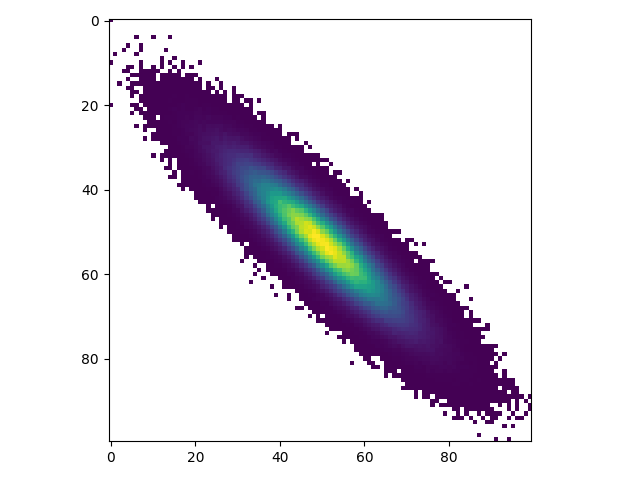
|
prettypyplot.imshow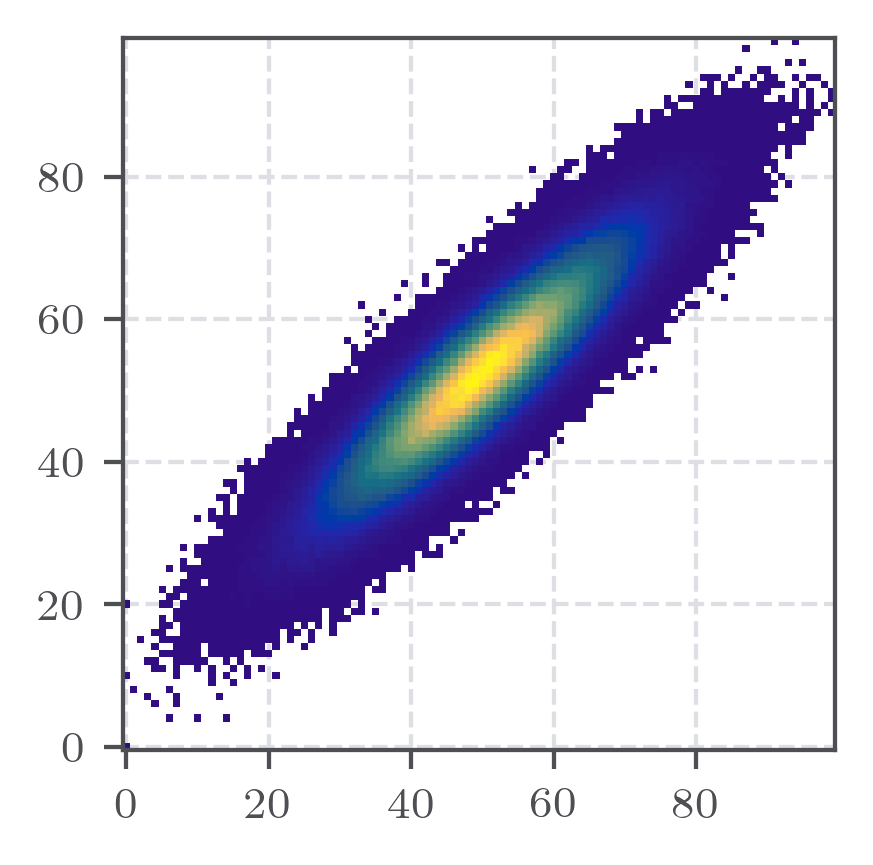
|
matplotlib.pyplot.colorbar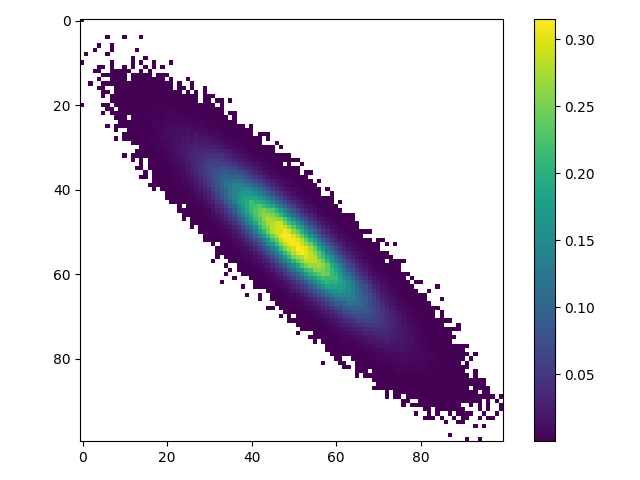
|
prettypyplot.colorbar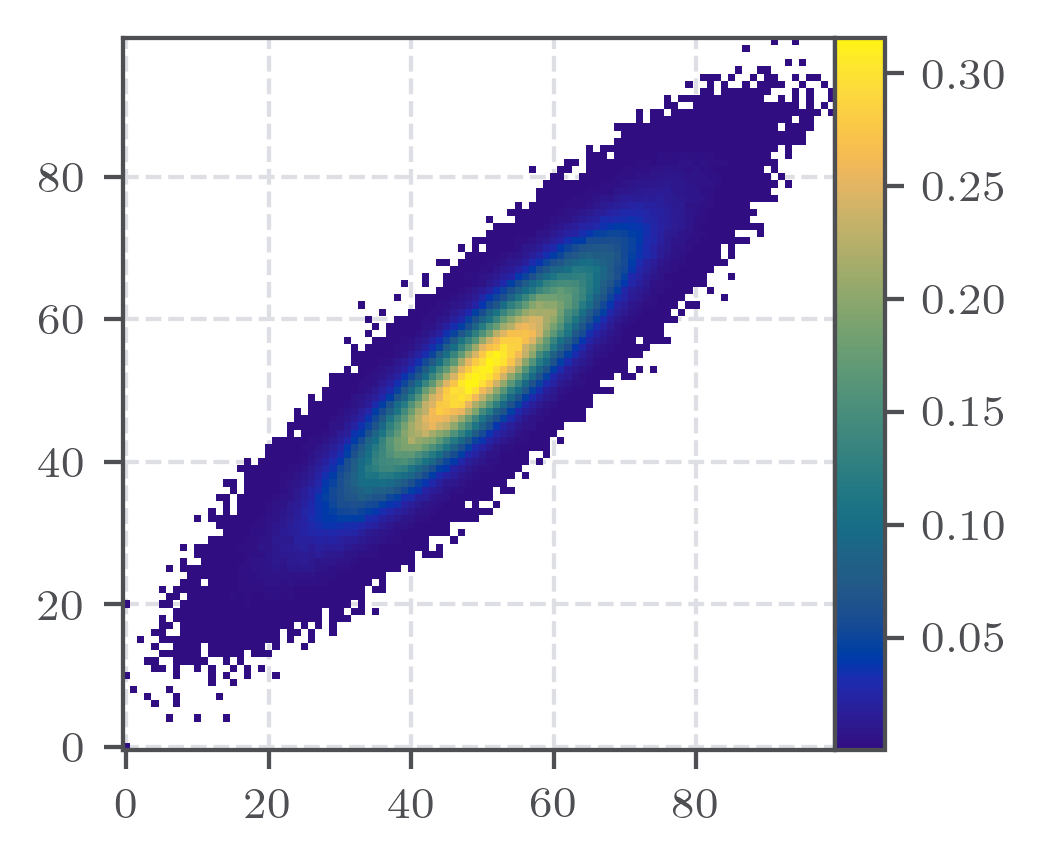
|
Roadmap:
The following list is sorted from near future to hopefully ever.
- [x] add pytest
- [x] add search functionality in doc
- [x] refactoring code to improve readabilty
- [x] add package to conda_forge
- [x] add gallery page
- [x] improve
plt.suplots()behaviour together withpplt.savefig() - [ ] add more colorpalettes
- [ ] add countour line plot
- [ ] add axes_grid examples
- [ ] setup widths and scaling factors for beamer and poster mode
- [ ] tweak all function to enable
STYLE='minimal' - [ ] implement tufte style
Building Documentation:
The doc is based on mkdocs and can be created by ```bash
installing all dependencies
python -m pip install -e .[docs]
serve interactively
python -m mkdocs serve ```
Similar Projects
Citing Prettypyplot
If you want to cite prettypyplot in scientific work please use:
Prettypyplot: publication ready matplotlib figures made simple
D. Nagel, 2022. Zenodo: 10.5281/zenodo.7278312
Credits:
In alphabetical order:
Owner
- Name: Daniel Nagel
- Login: braniii
- Kind: user
- Location: Freiburg, Germany
- Website: braniii.github.io
- Repositories: 3
- Profile: https://github.com/braniii
GitHub Events
Total
- Watch event: 2
- Delete event: 11
- Issue comment event: 3
- Push event: 30
- Pull request event: 27
- Create event: 14
Last Year
- Watch event: 2
- Delete event: 11
- Issue comment event: 3
- Push event: 30
- Pull request event: 27
- Create event: 14
Committers
Last synced: 12 months ago
Top Committers
| Name | Commits | |
|---|---|---|
| braniii | d****l@p****m | 359 |
| dependabot[bot] | 4****] | 8 |
| Georg Diez | 5****o | 3 |
| taenzel | 6****l | 1 |
| Patrick Binder | p****l@p****m | 1 |
Issues and Pull Requests
Last synced: 10 months ago
All Time
- Total issues: 3
- Total pull requests: 31
- Average time to close issues: 4 months
- Average time to close pull requests: 6 days
- Total issue authors: 3
- Total pull request authors: 4
- Average comments per issue: 0.33
- Average comments per pull request: 0.45
- Merged pull requests: 22
- Bot issues: 0
- Bot pull requests: 17
Past Year
- Issues: 1
- Pull requests: 24
- Average time to close issues: N/A
- Average time to close pull requests: 3 days
- Issue authors: 1
- Pull request authors: 2
- Average comments per issue: 0.0
- Average comments per pull request: 0.42
- Merged pull requests: 16
- Bot issues: 0
- Bot pull requests: 17
Top Authors
Issue Authors
- gegabo (1)
- farudolf (1)
- braniii (1)
Pull Request Authors
- dependabot[bot] (23)
- braniii (12)
- gegabo (6)
- taenzel (2)
Top Labels
Issue Labels
Pull Request Labels
Packages
- Total packages: 1
-
Total downloads:
- pypi 318 last-month
- Total dependent packages: 2
- Total dependent repositories: 1
- Total versions: 16
- Total maintainers: 1
pypi.org: prettypyplot
Wrapper for matplotlib to generate pretty plots.
- Documentation: https://braniii.github.io/prettypyplot
- License: BSD License
-
Latest release: 0.12.0
published 11 months ago
Rankings
Maintainers (1)
Dependencies
- actions/checkout v3 composite
- actions/setup-python v4 composite
- coverage *
- flake8 *
- mkdocs-gen-files *
- mkdocs-literate-nav *
- mkdocs-material *
- mkdocstrings *
- mkdocstrings-python *
- pytest *
- pytest-cov *
- pytest-mpl *
- pytest-rerunfailures *
- decorit >=0.2.0
- matplotlib >=3.0.0
- numpy *
- decorit >=0.2.0
- matplotlib *
- numpy *
- actions/checkout v4 composite
- actions/setup-python v5 composite
- actions/checkout v4 composite
- actions/setup-python v5 composite
- pypa/gh-action-pypi-publish release/v1 composite