launch-stats
Space launch statistics, charts & infographics made in Python with the Launch Library 2 API.
Science Score: 36.0%
This score indicates how likely this project is to be science-related based on various indicators:
-
○CITATION.cff file
-
✓codemeta.json file
Found codemeta.json file -
✓.zenodo.json file
Found .zenodo.json file -
○DOI references
-
✓Academic publication links
Links to: zenodo.org -
○Committers with academic emails
-
○Institutional organization owner
-
○JOSS paper metadata
-
○Scientific vocabulary similarity
Low similarity (8.2%) to scientific vocabulary
Keywords
Repository
Space launch statistics, charts & infographics made in Python with the Launch Library 2 API.
Basic Info
- Host: GitHub
- Owner: Nosudrum
- License: apache-2.0
- Language: Python
- Default Branch: main
- Homepage: https://thespacedevs.com/llapi
- Size: 46.8 GB
Statistics
- Stars: 25
- Watchers: 2
- Forks: 1
- Open Issues: 12
- Releases: 5
Topics
Metadata Files
README.md
Nosu's LL2 Launch Stats
![]()
![]()
![]()

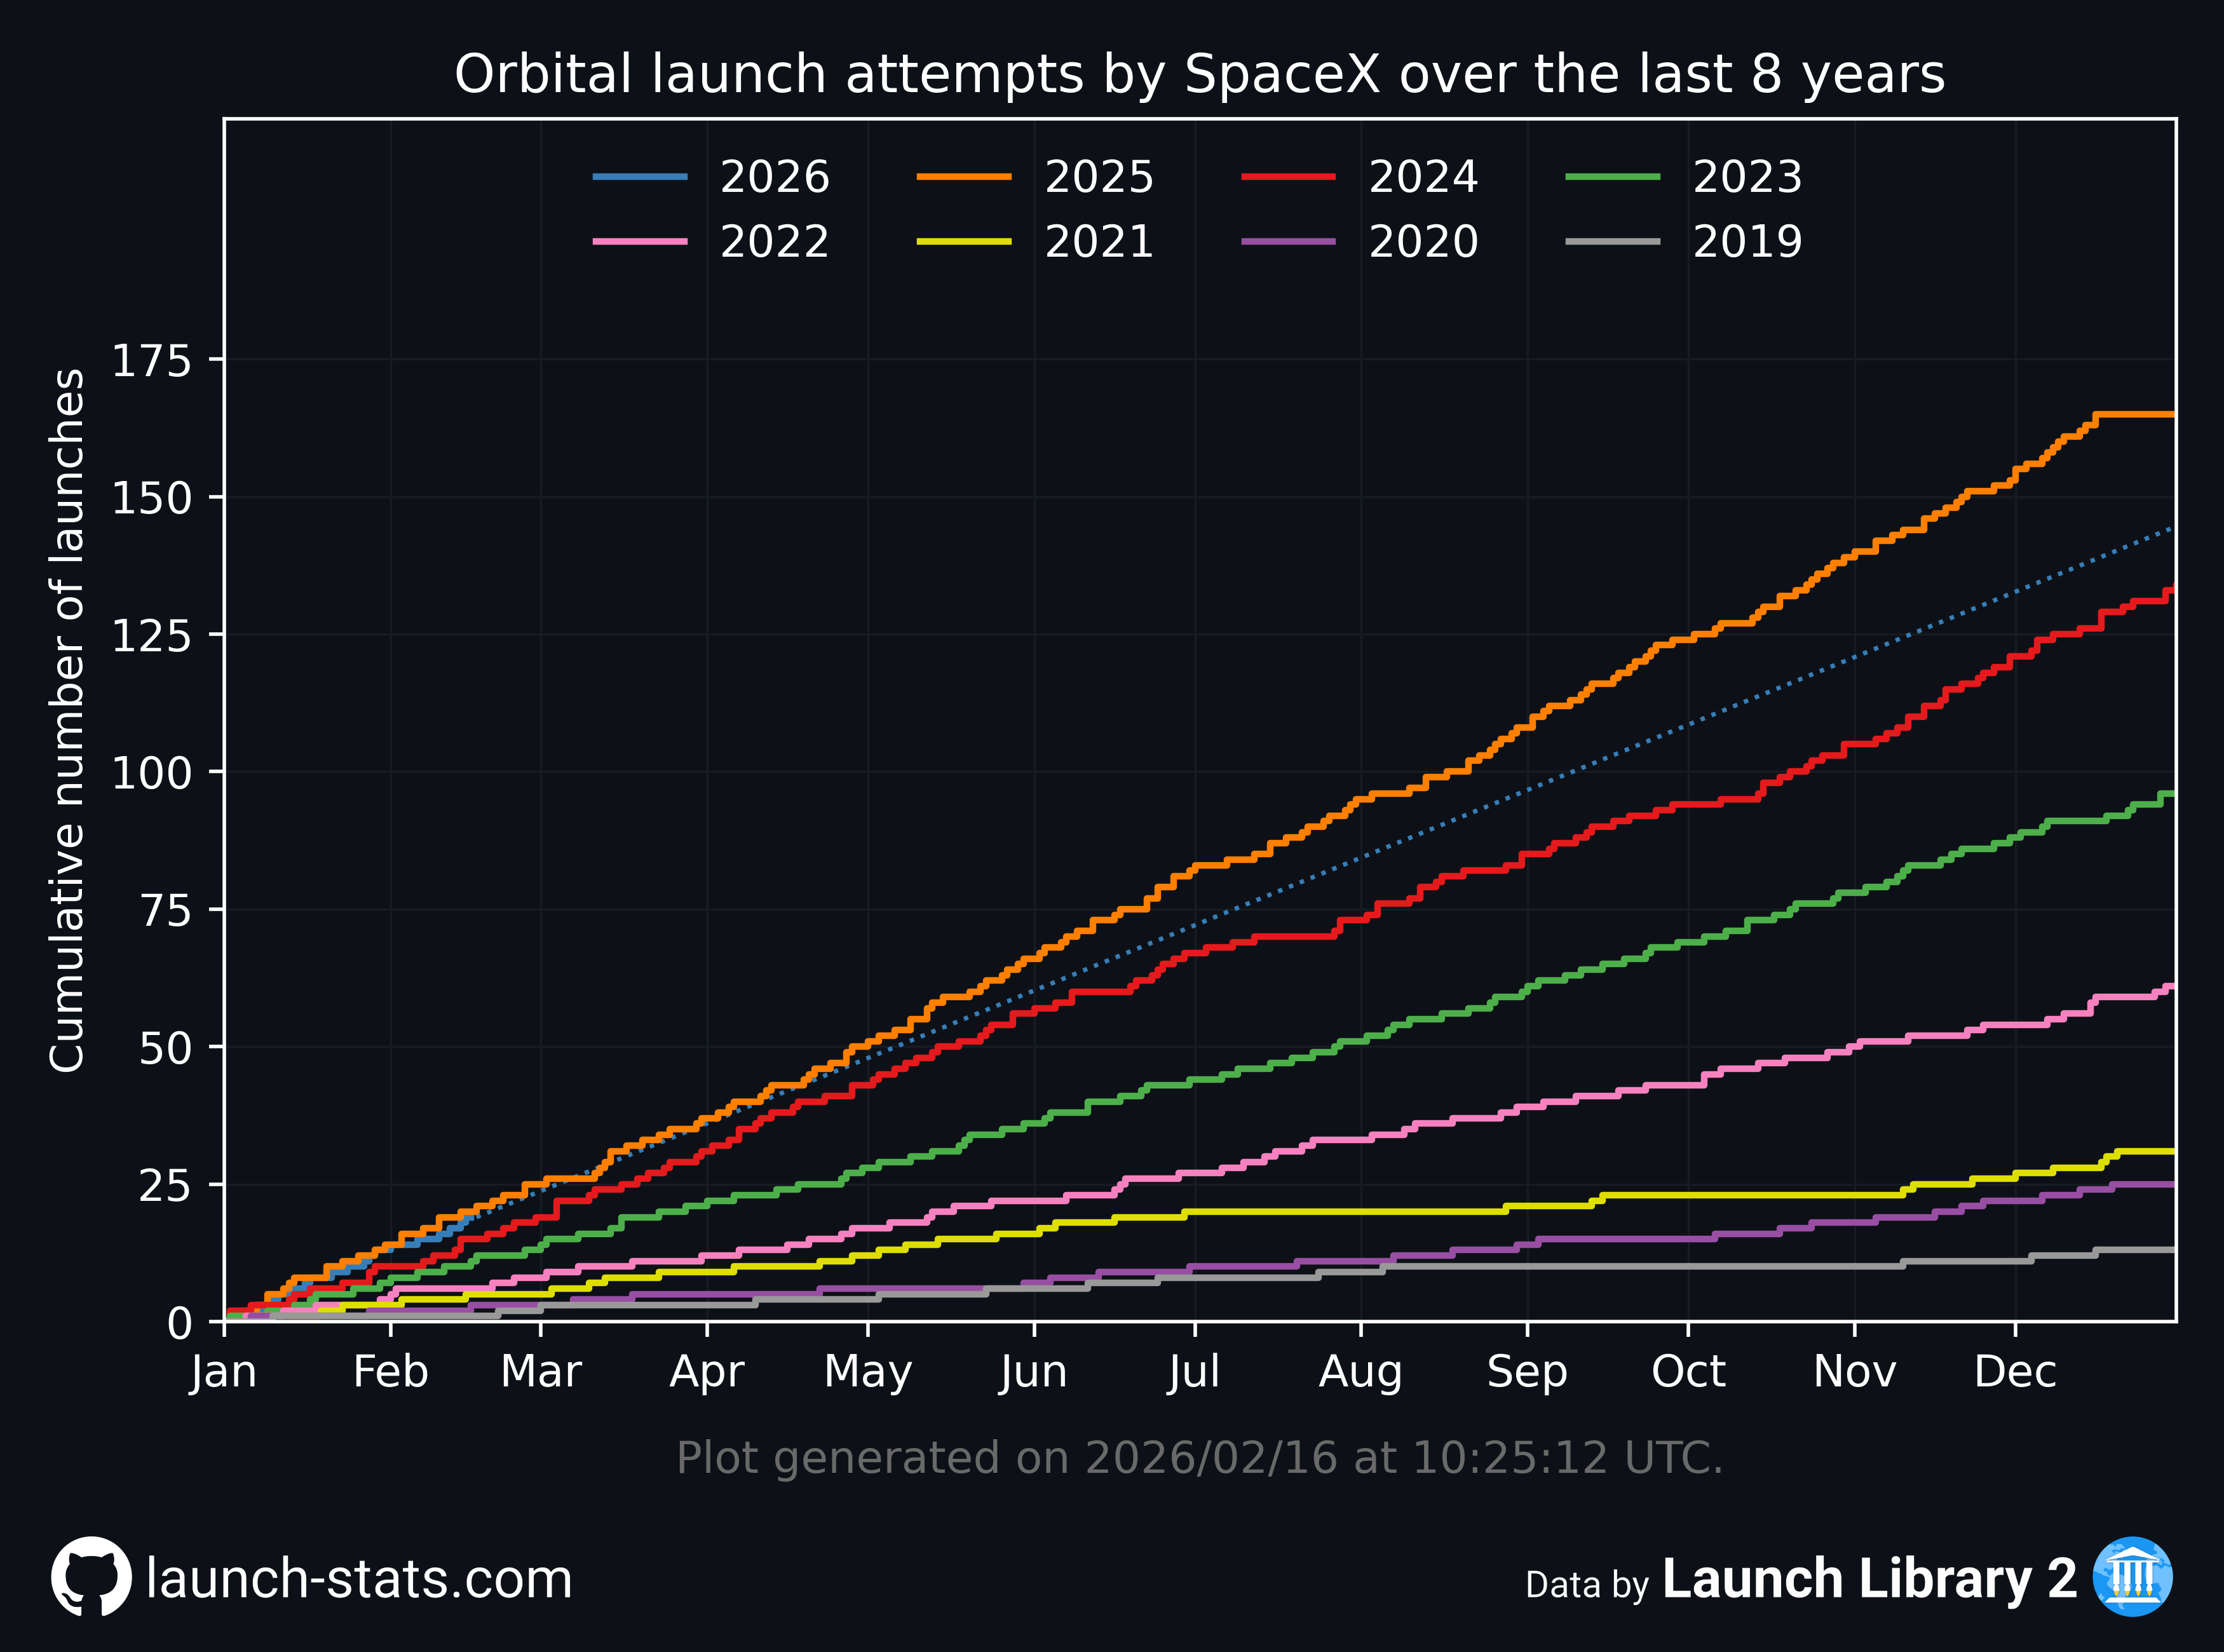
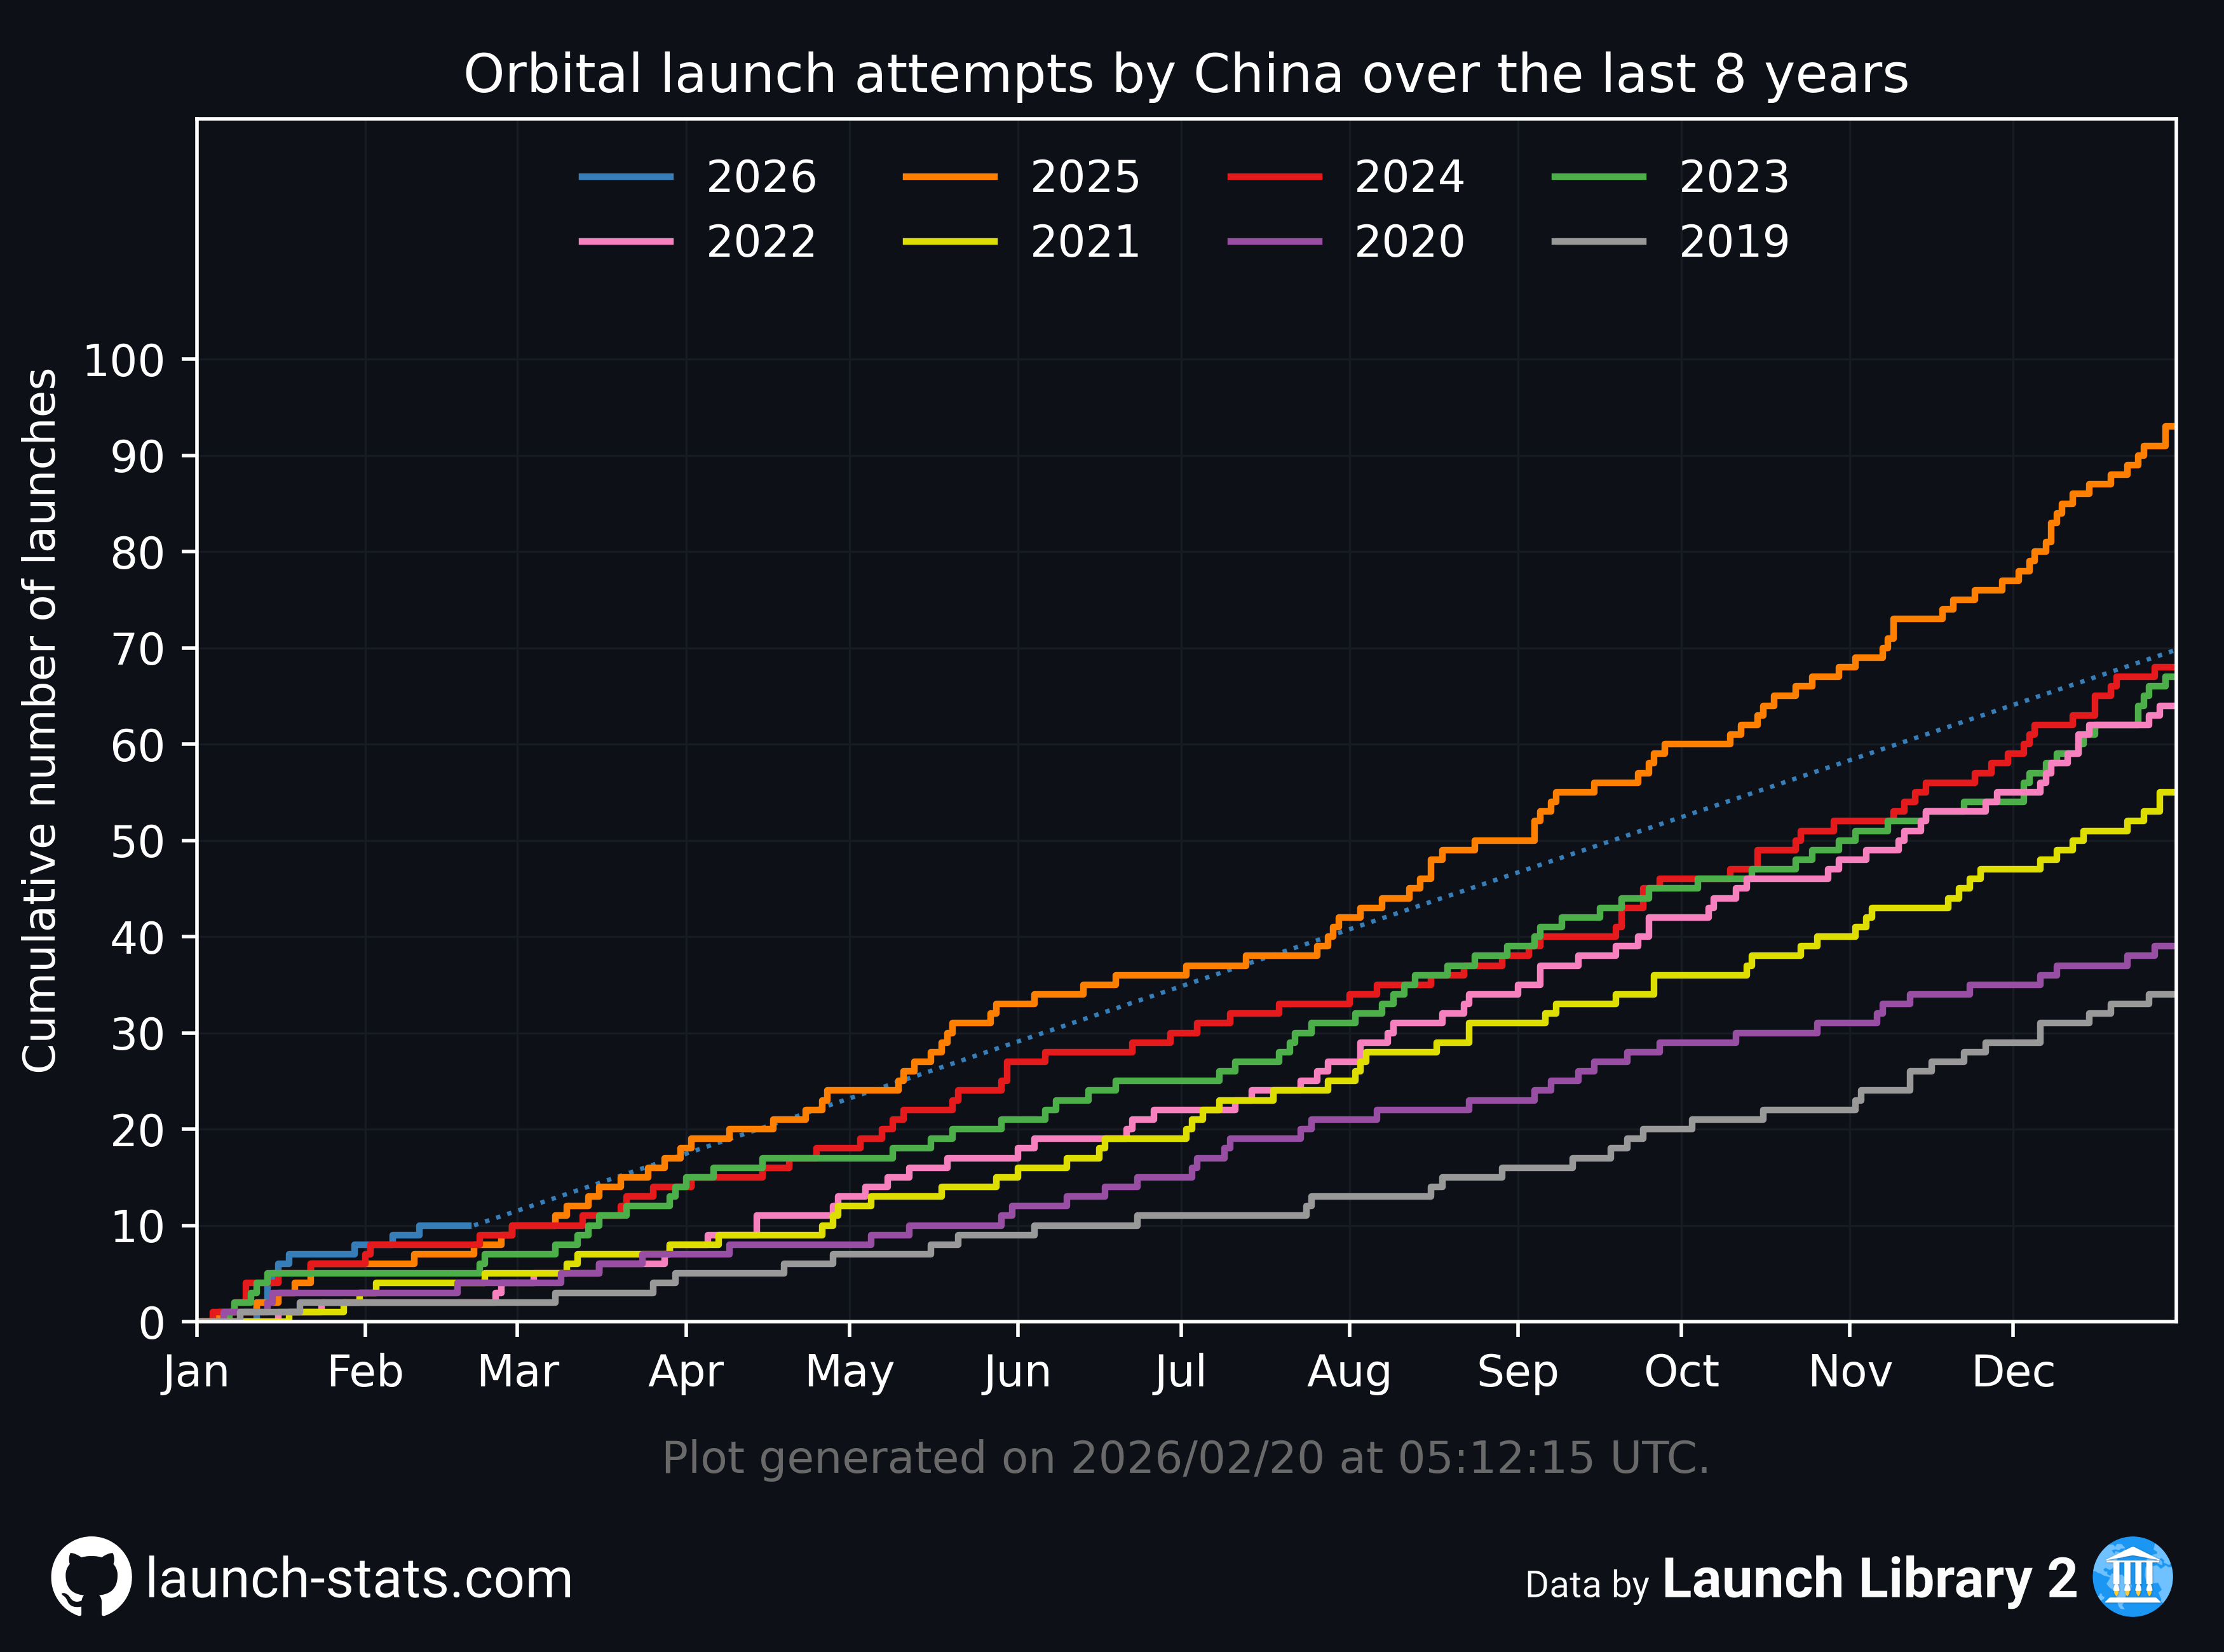
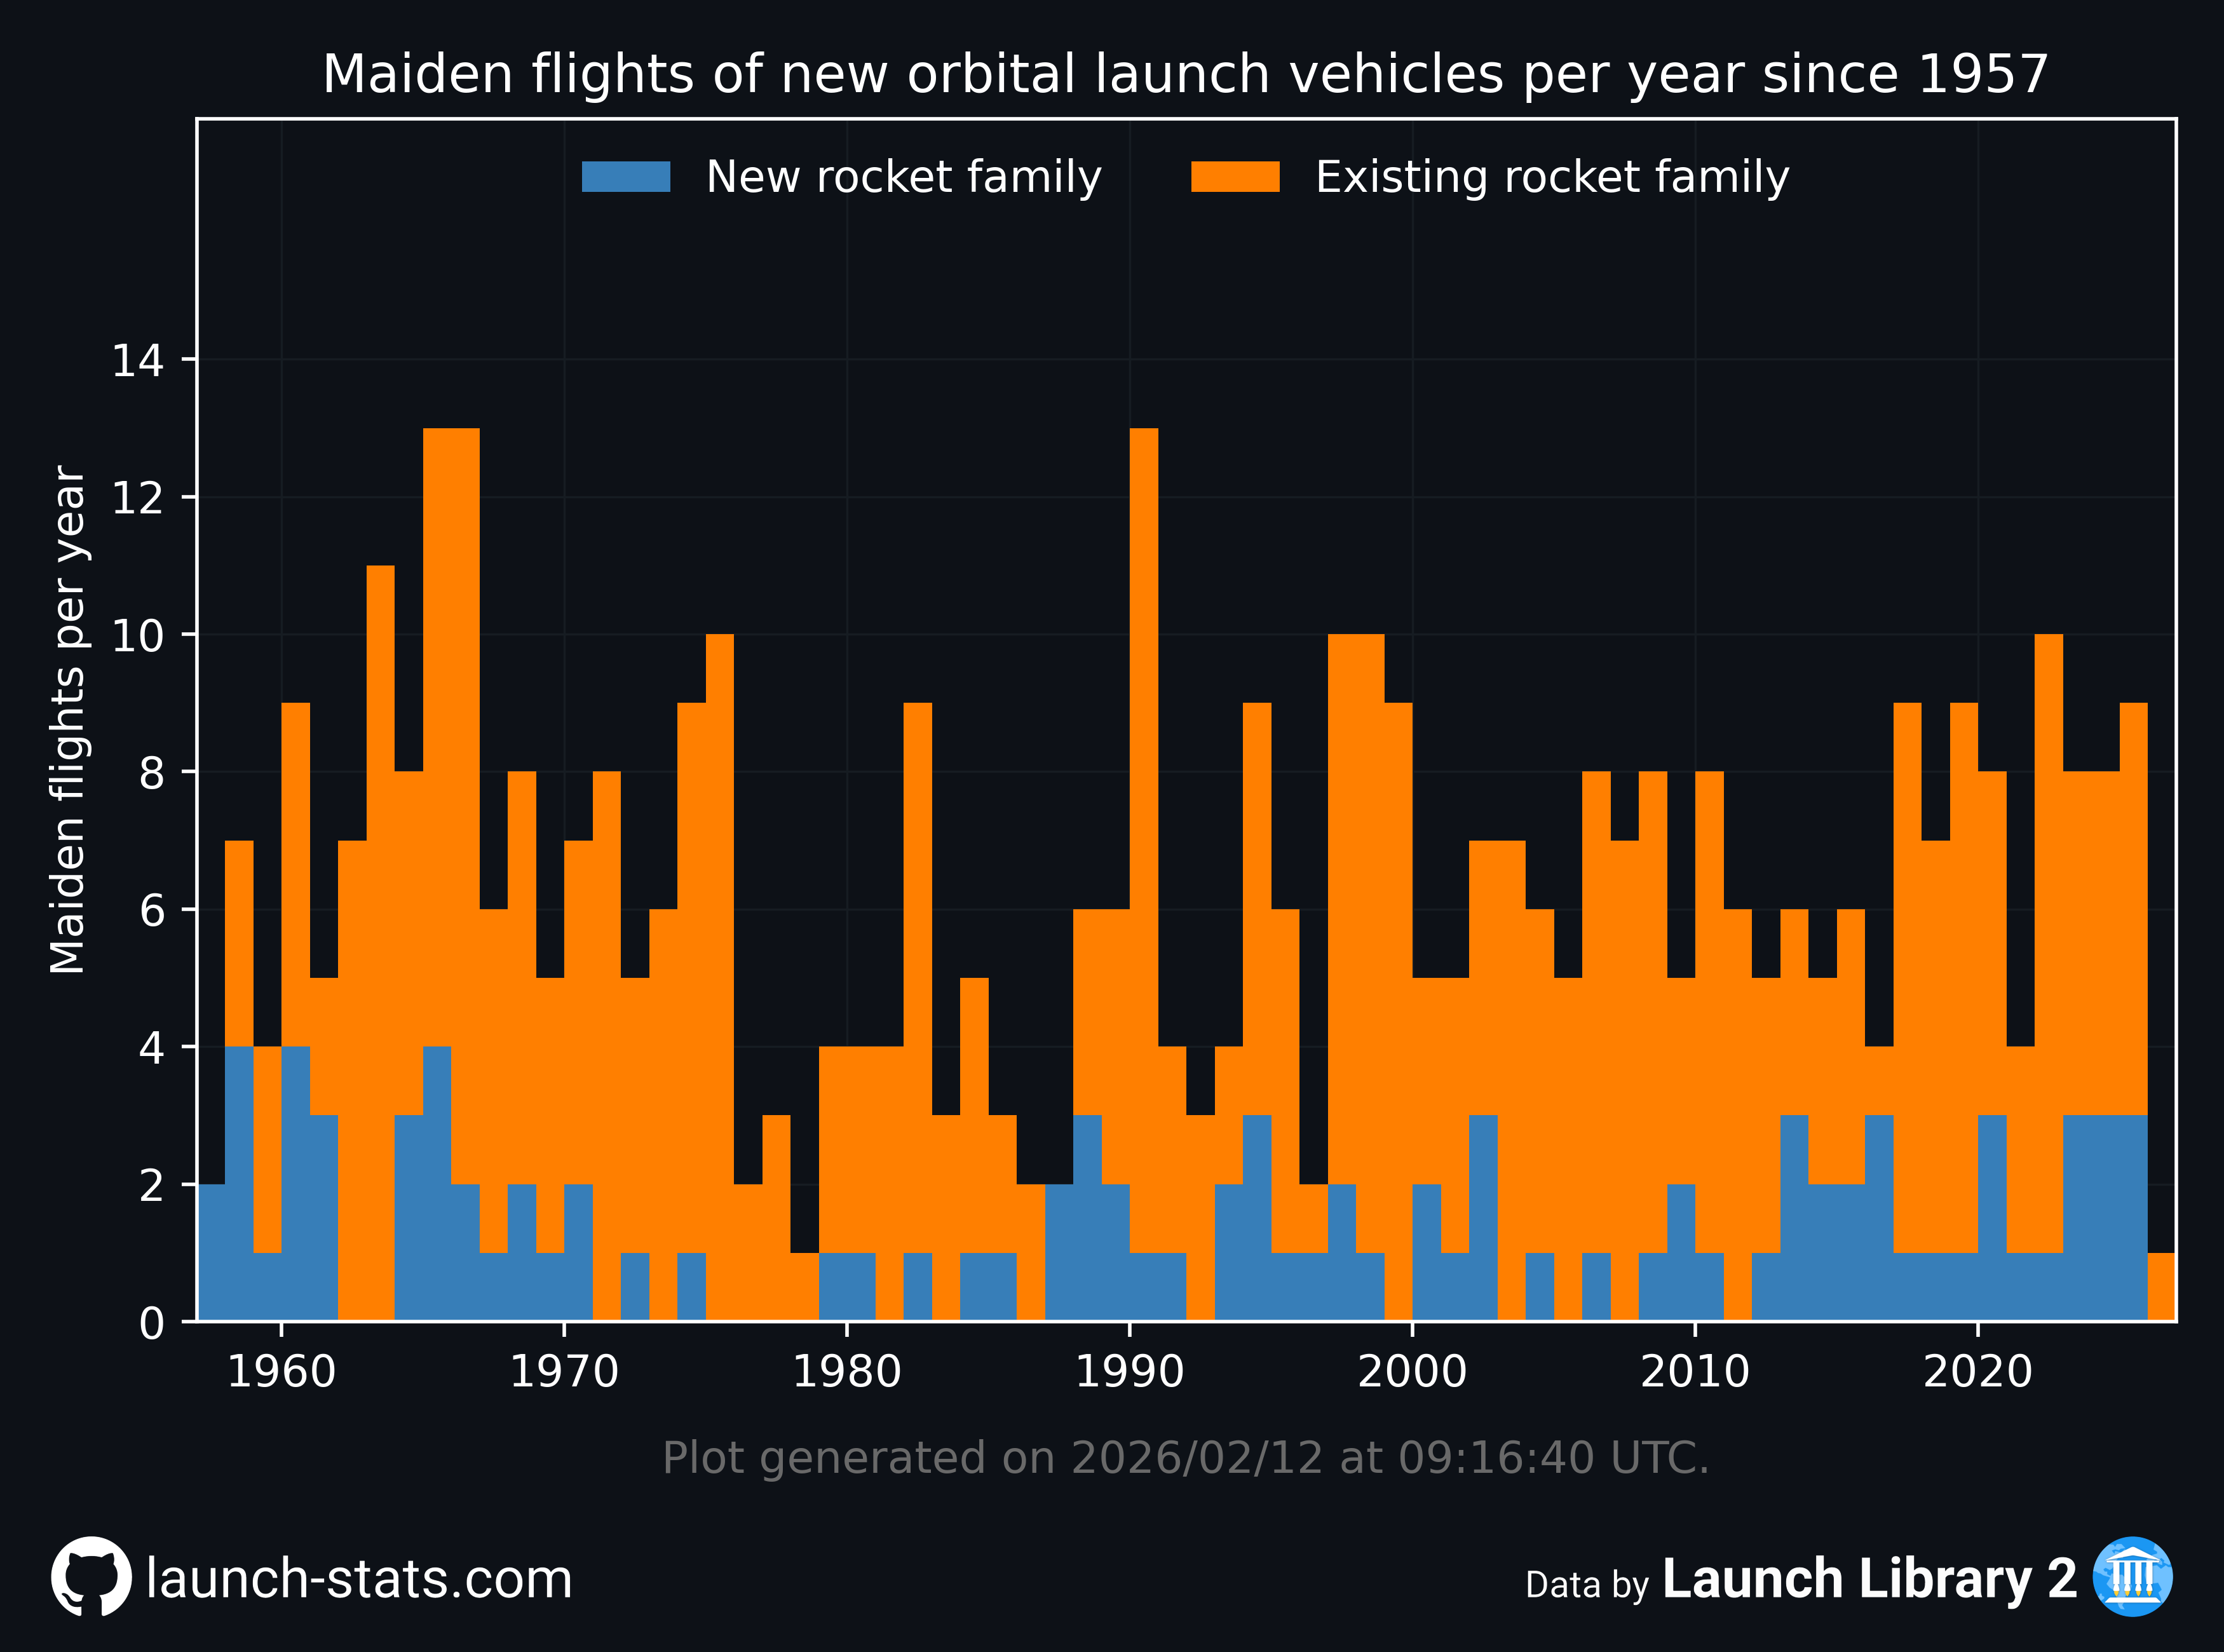
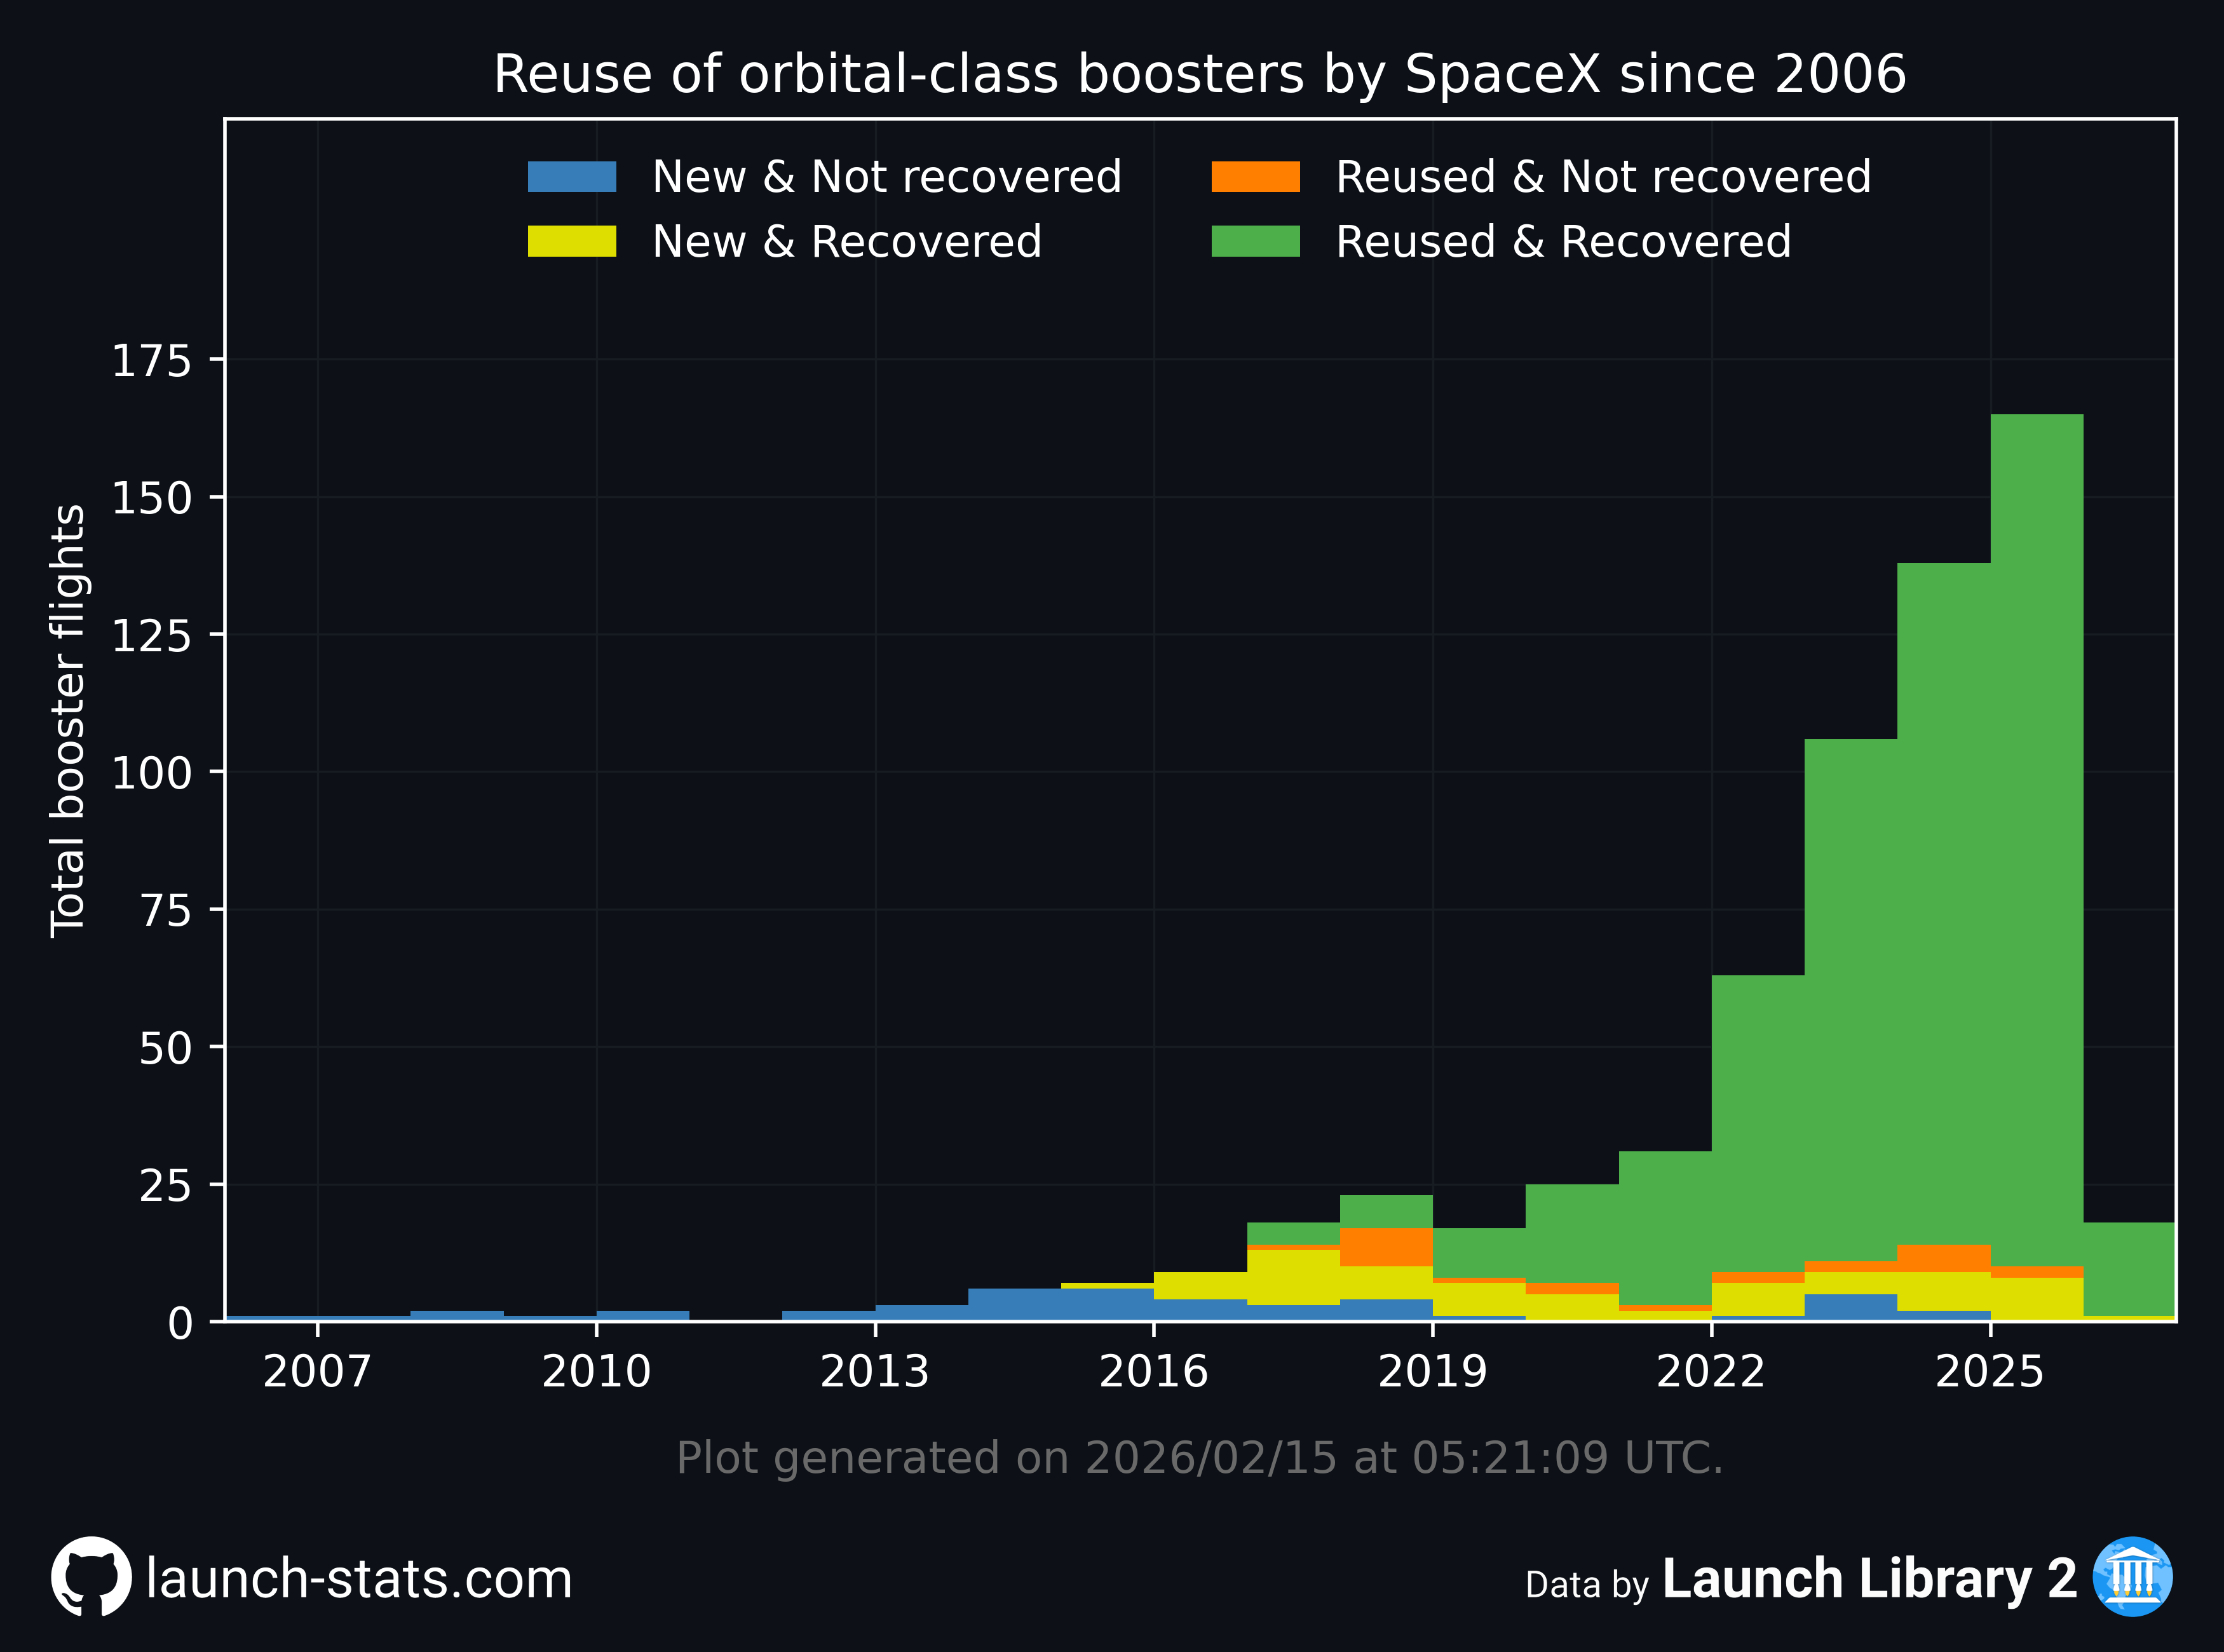
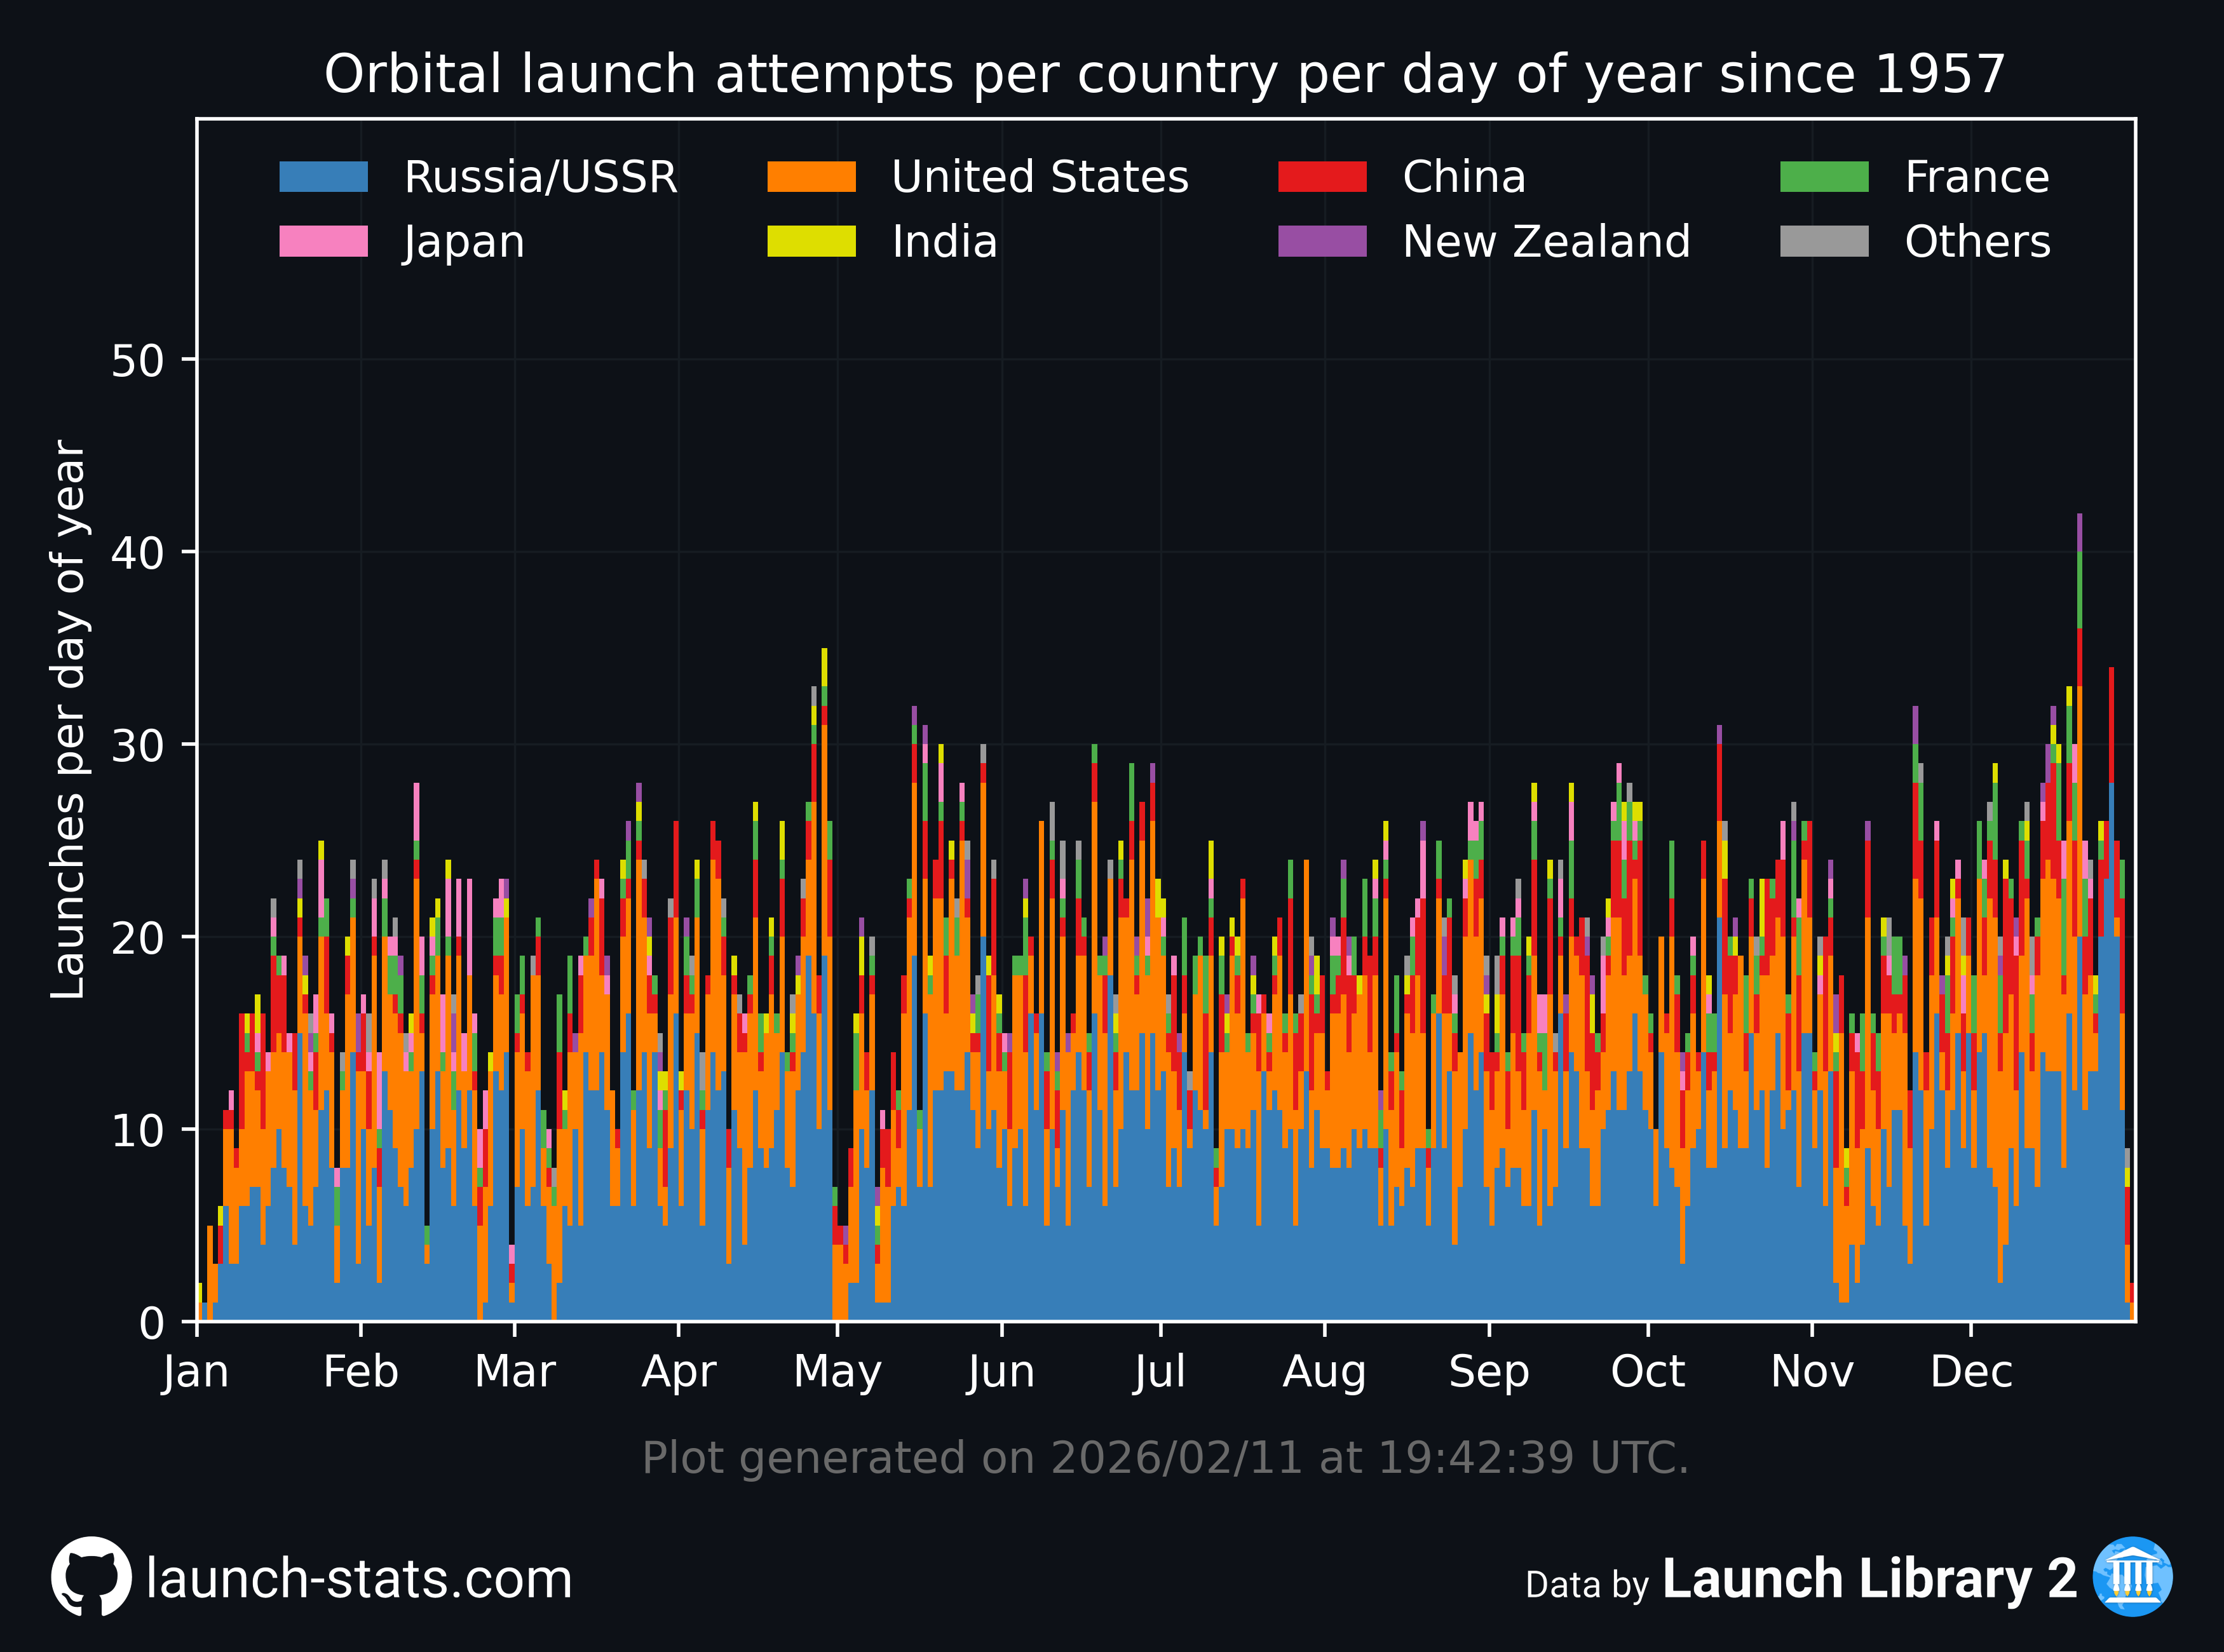
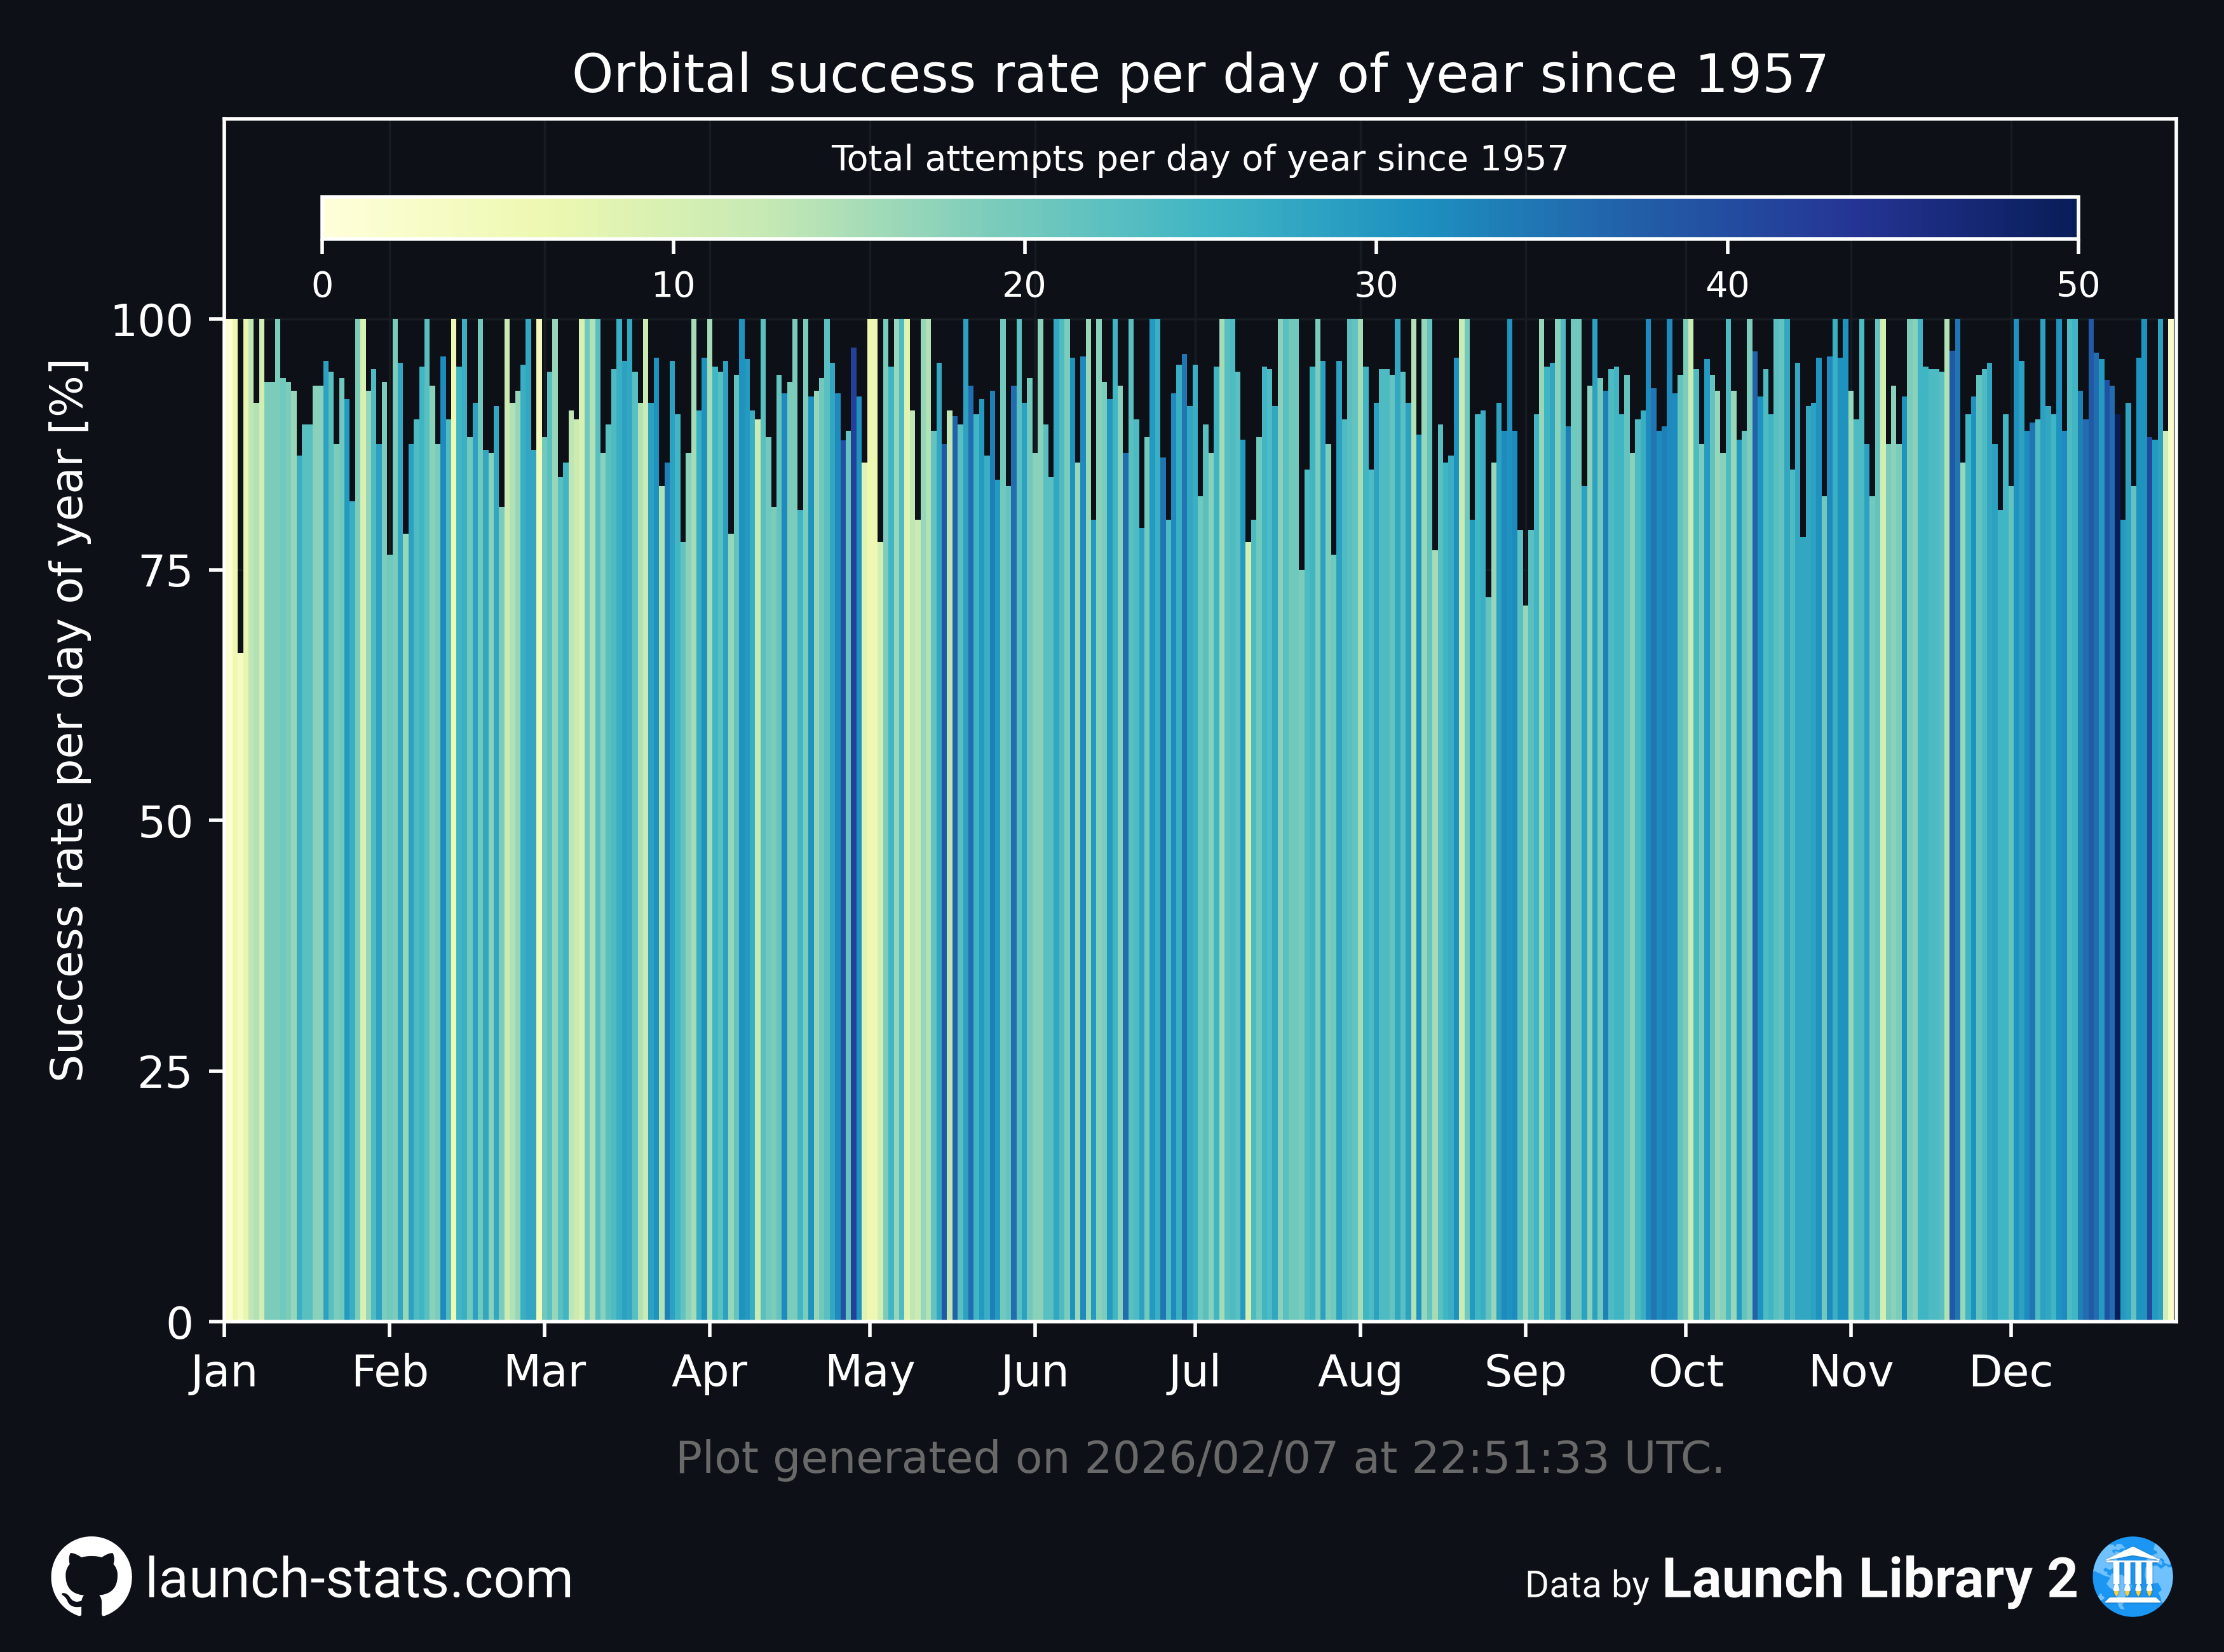
In this repository you can find various plots related to space launches made using the Launch Library 2 API and scripts written in python. The old MATLAB scripts are no longer used, but are still visible if anyone is interested.
If you have feedback or ideas, feel free to open an issue.
Interactive plots (better on desktop)
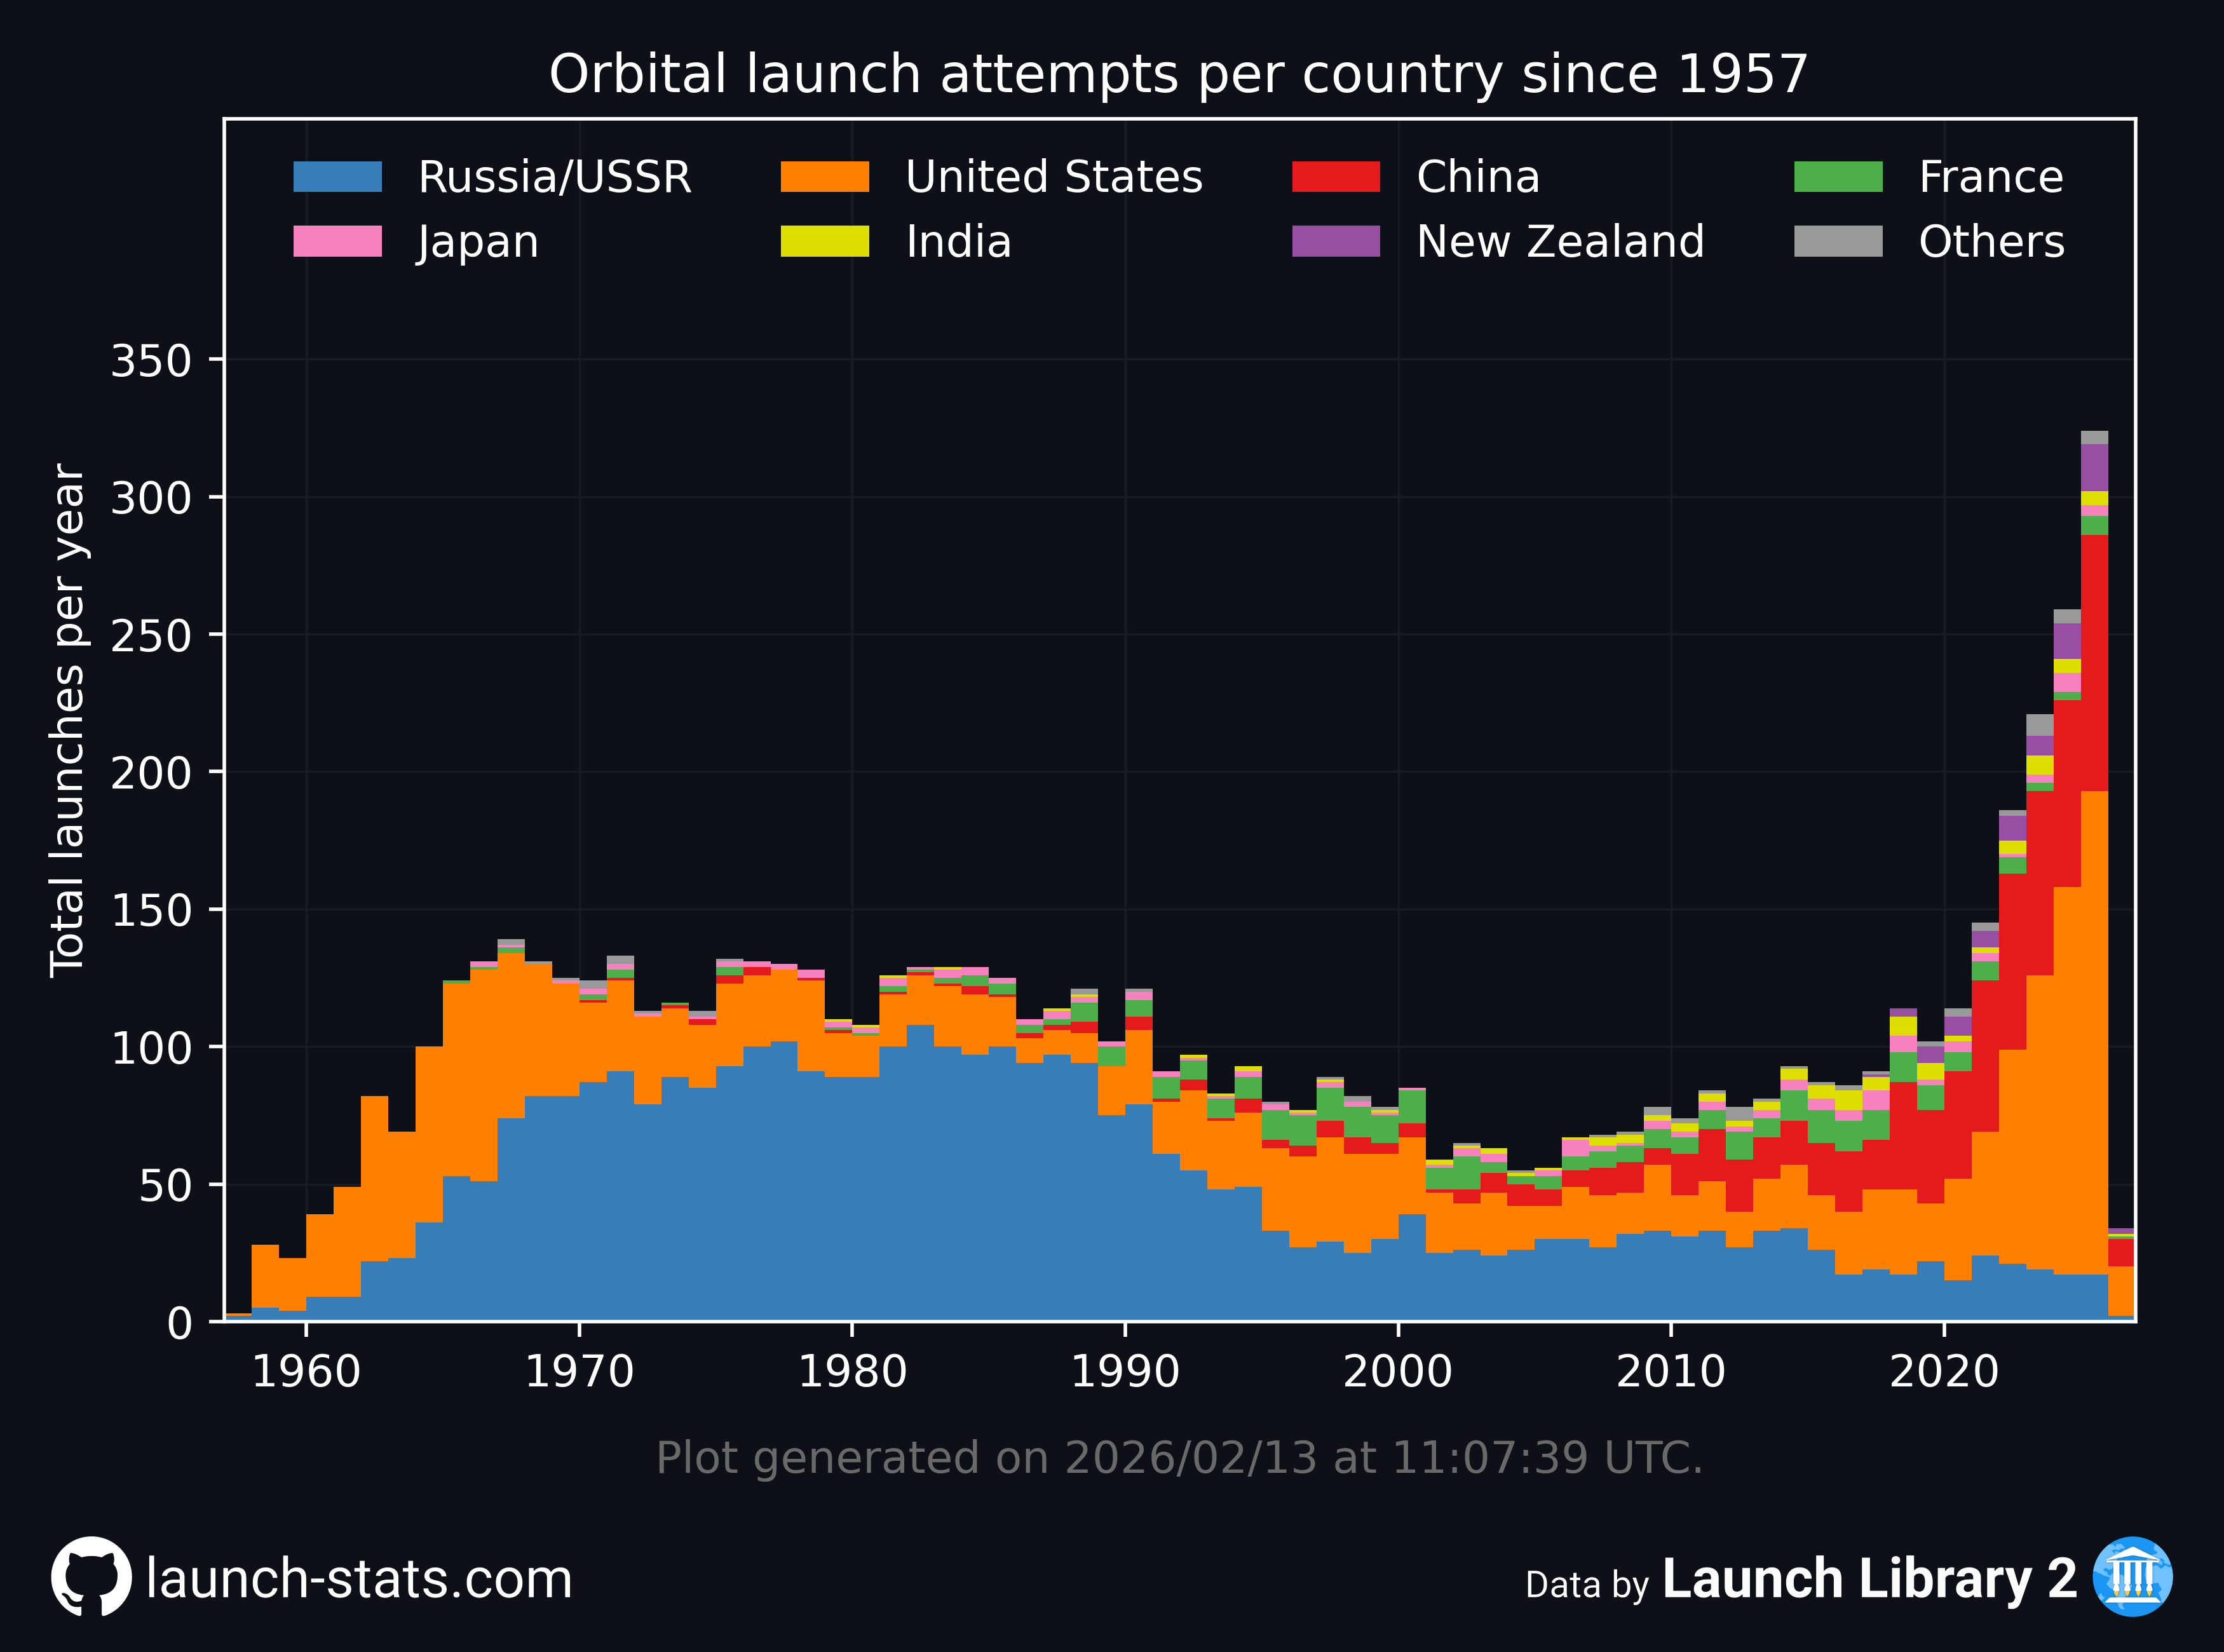
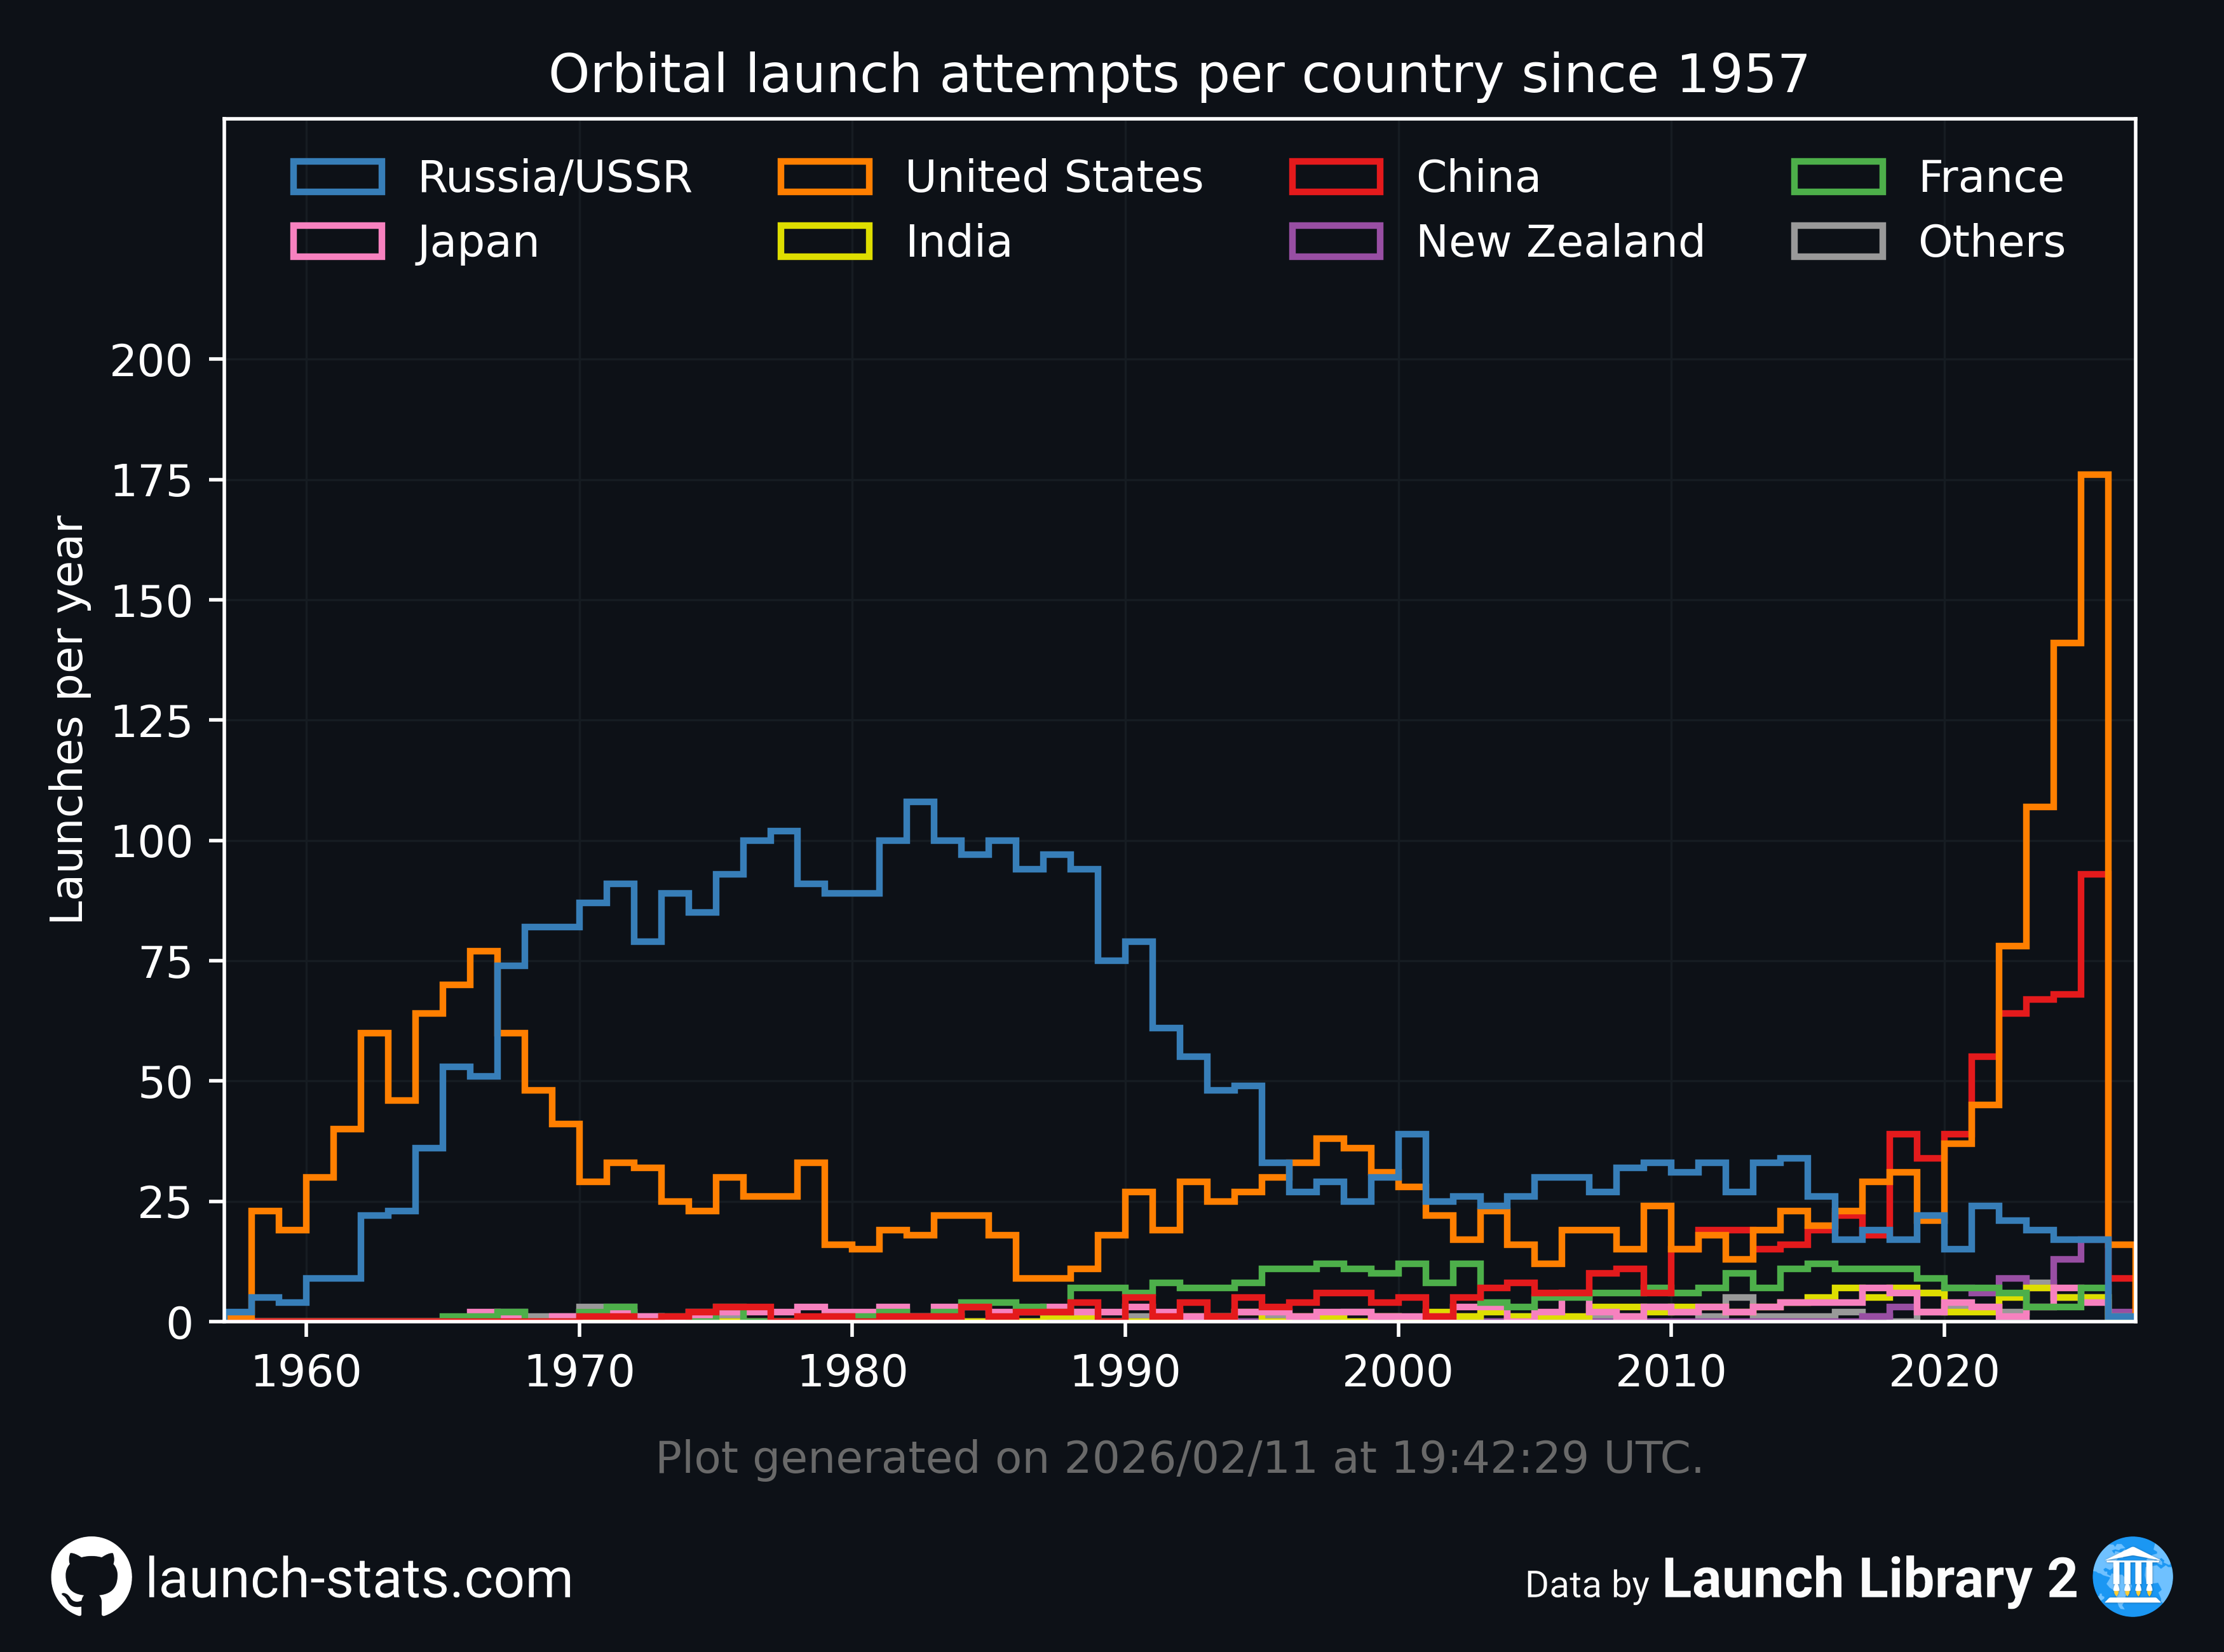
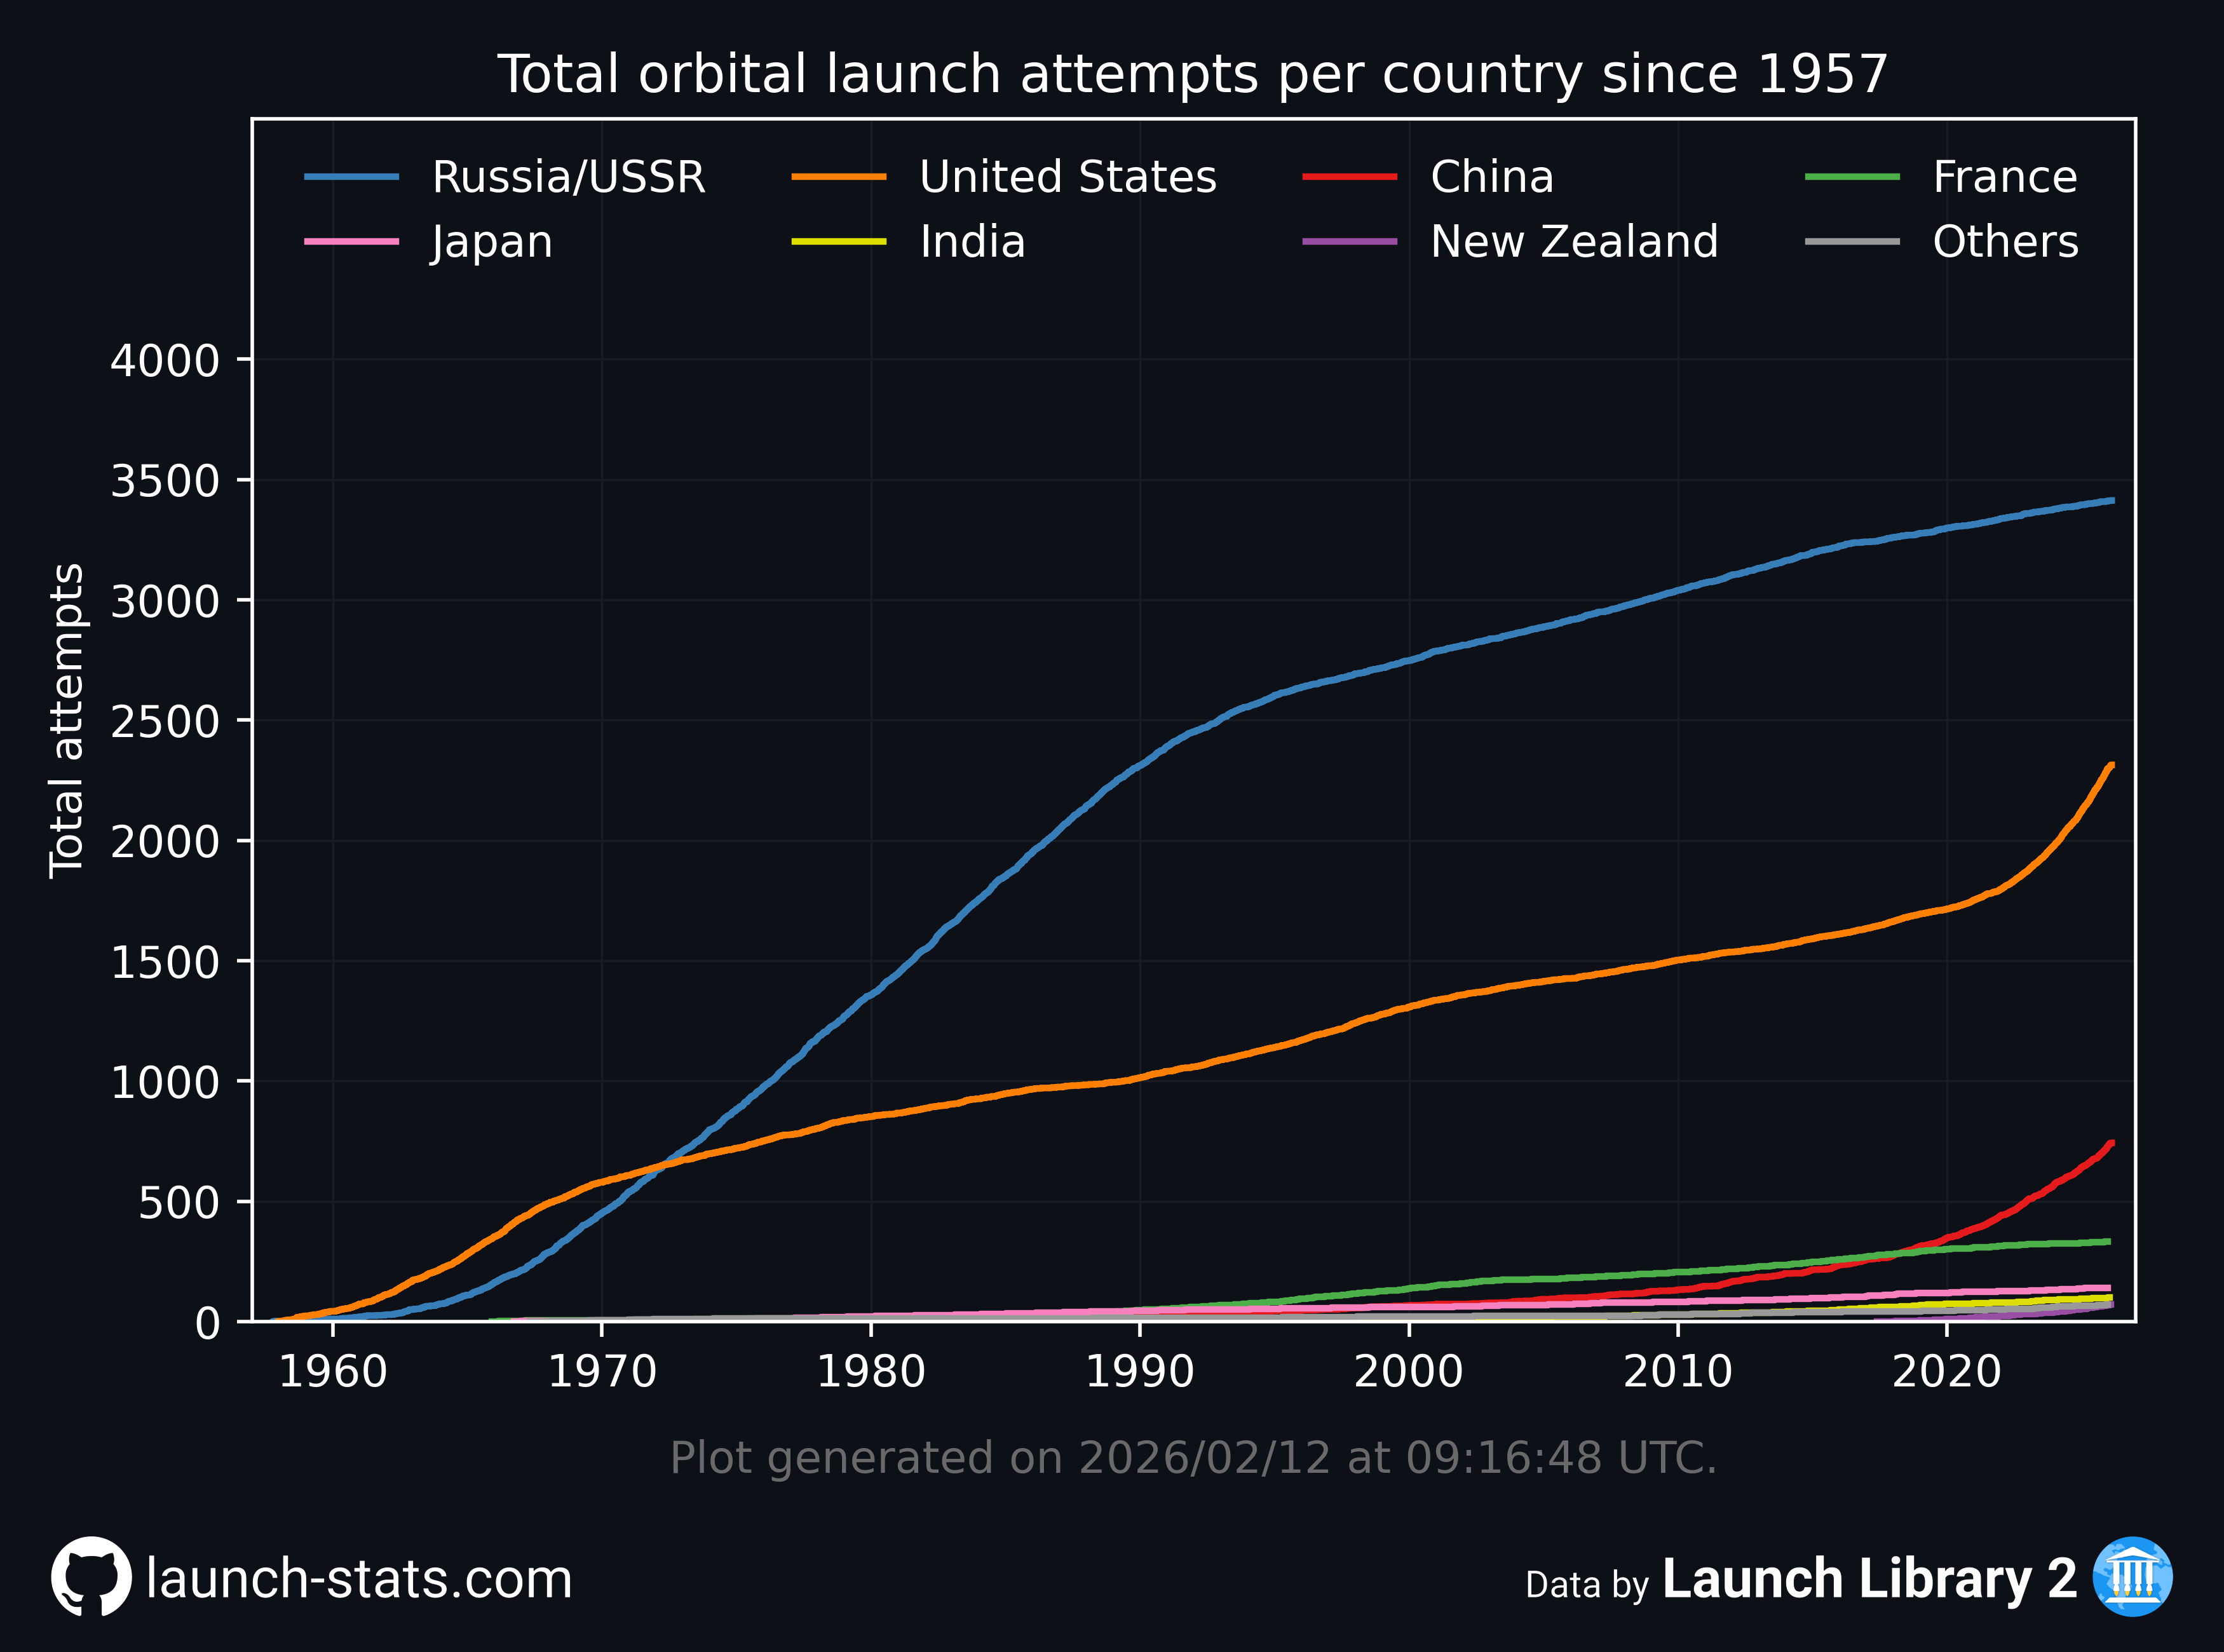
All launches since 1957 per country
Yearly plots
All yearly plots since 1957
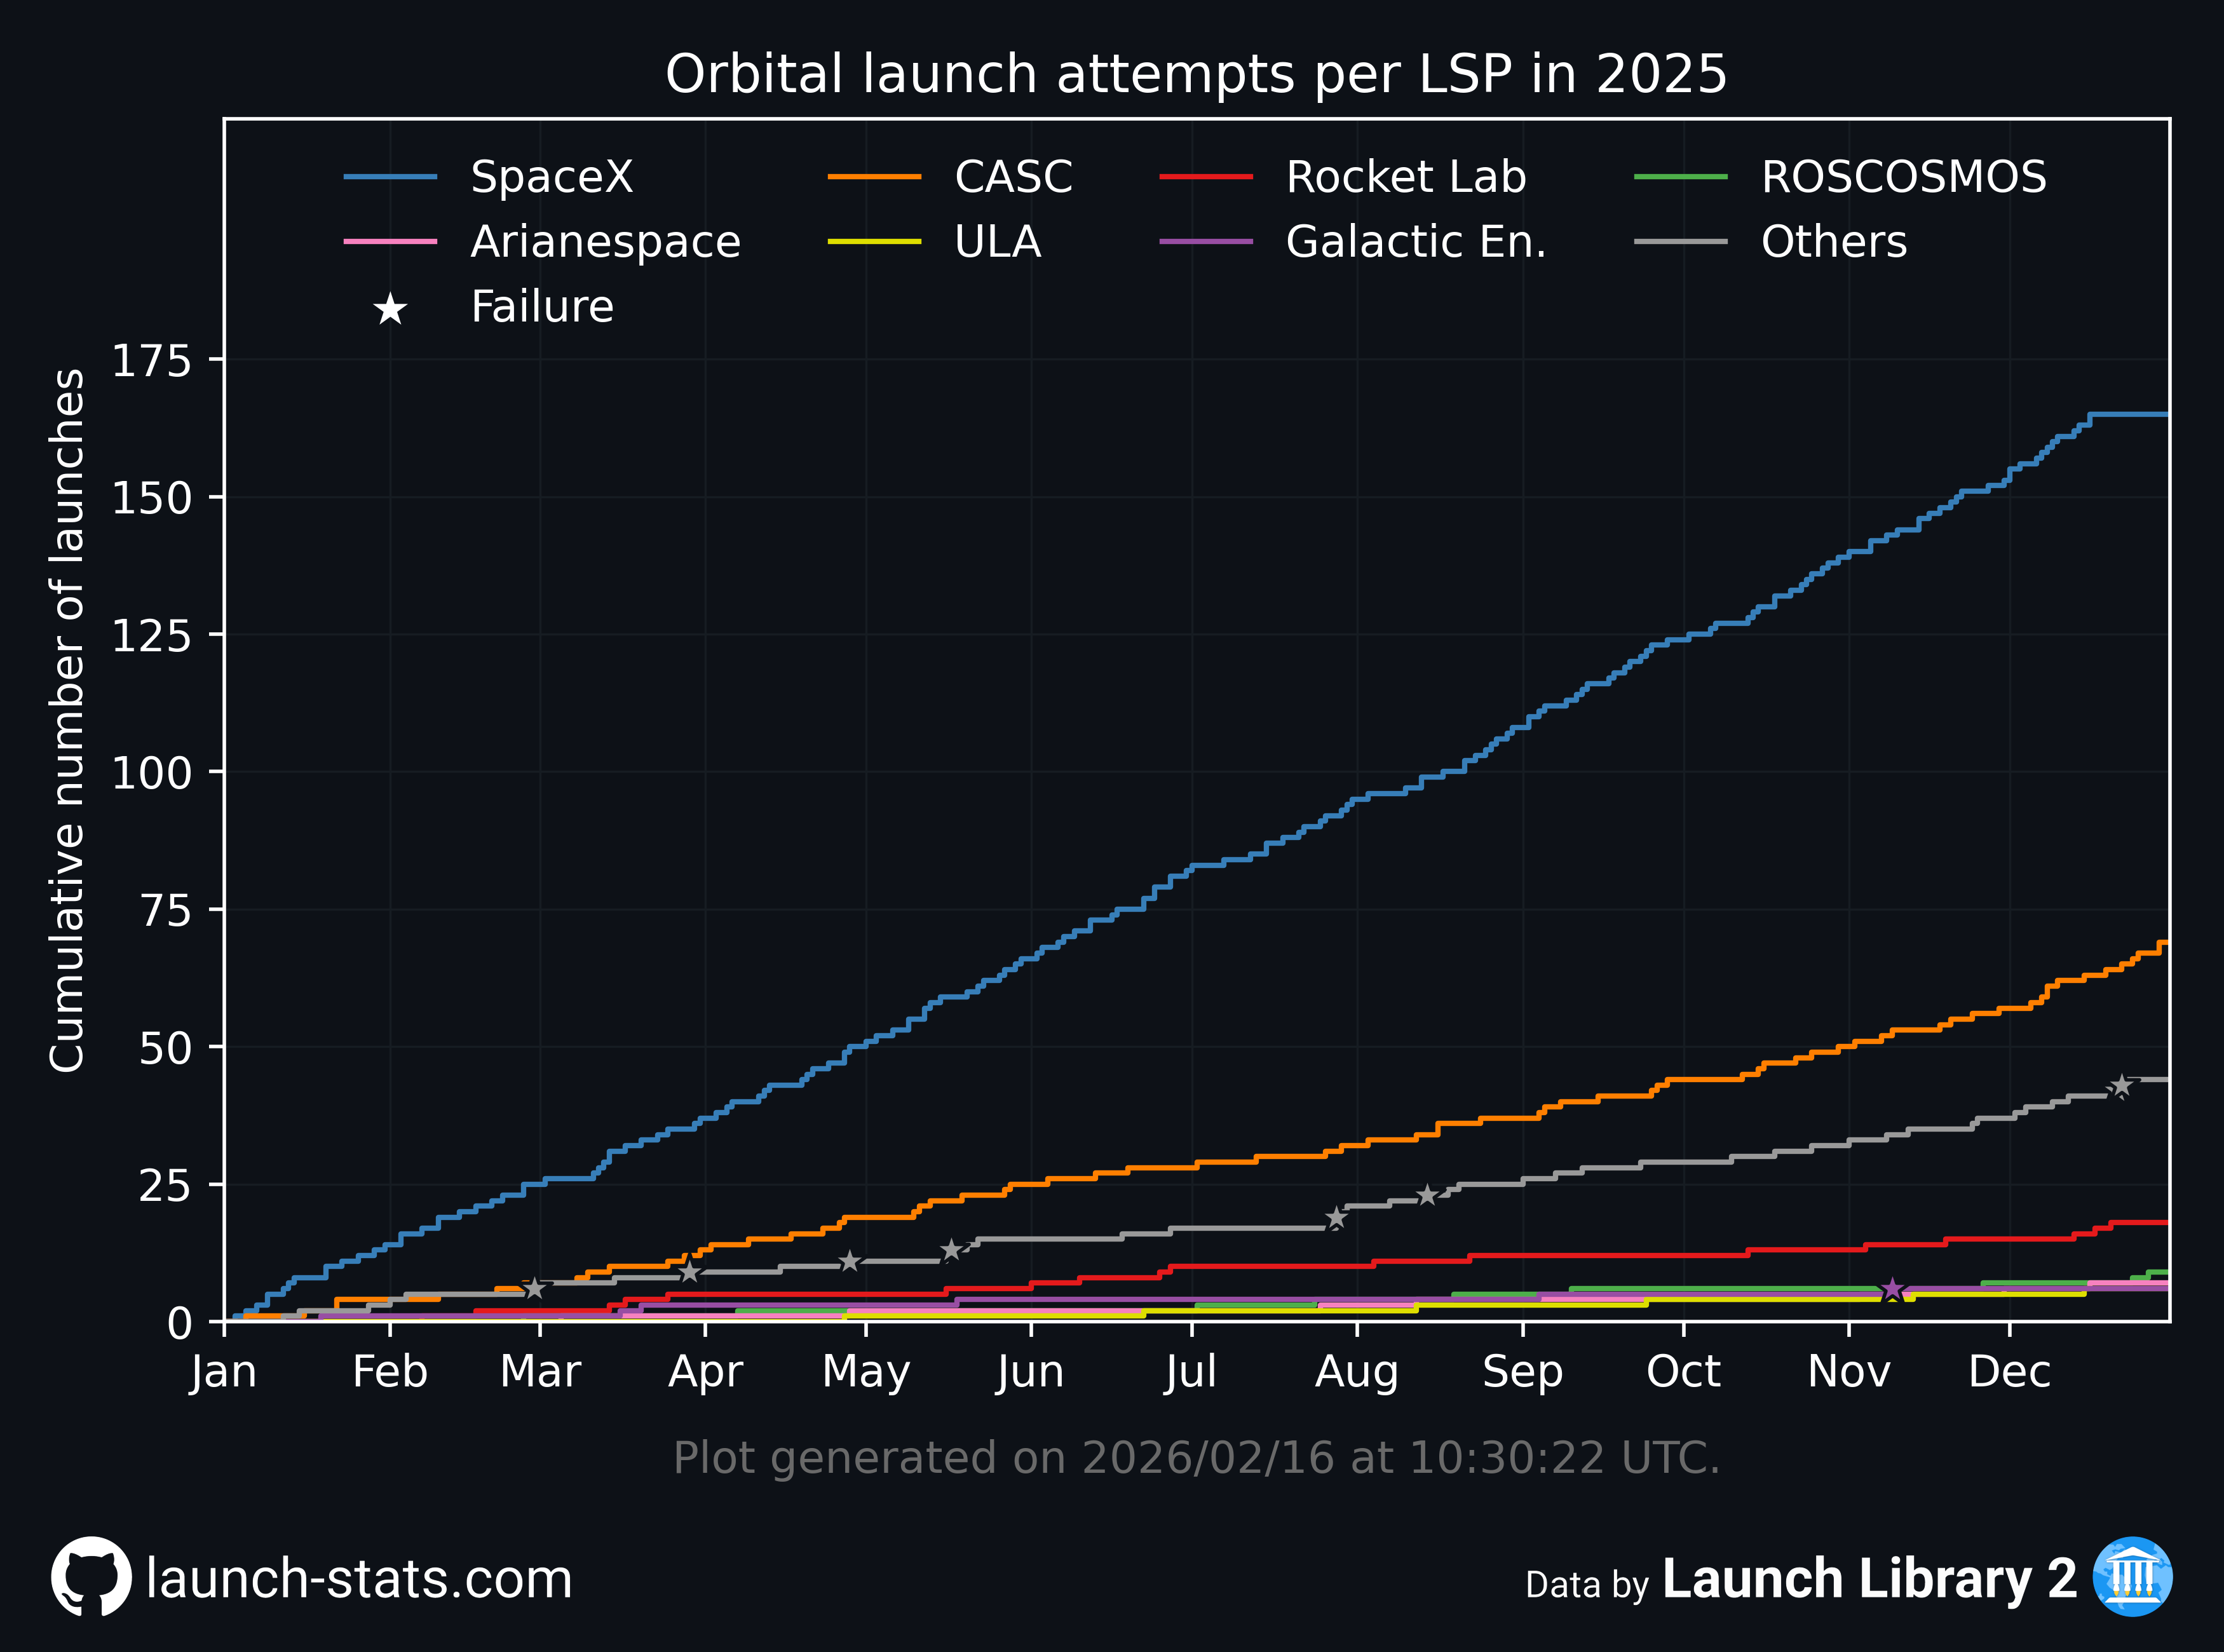
2025 plots

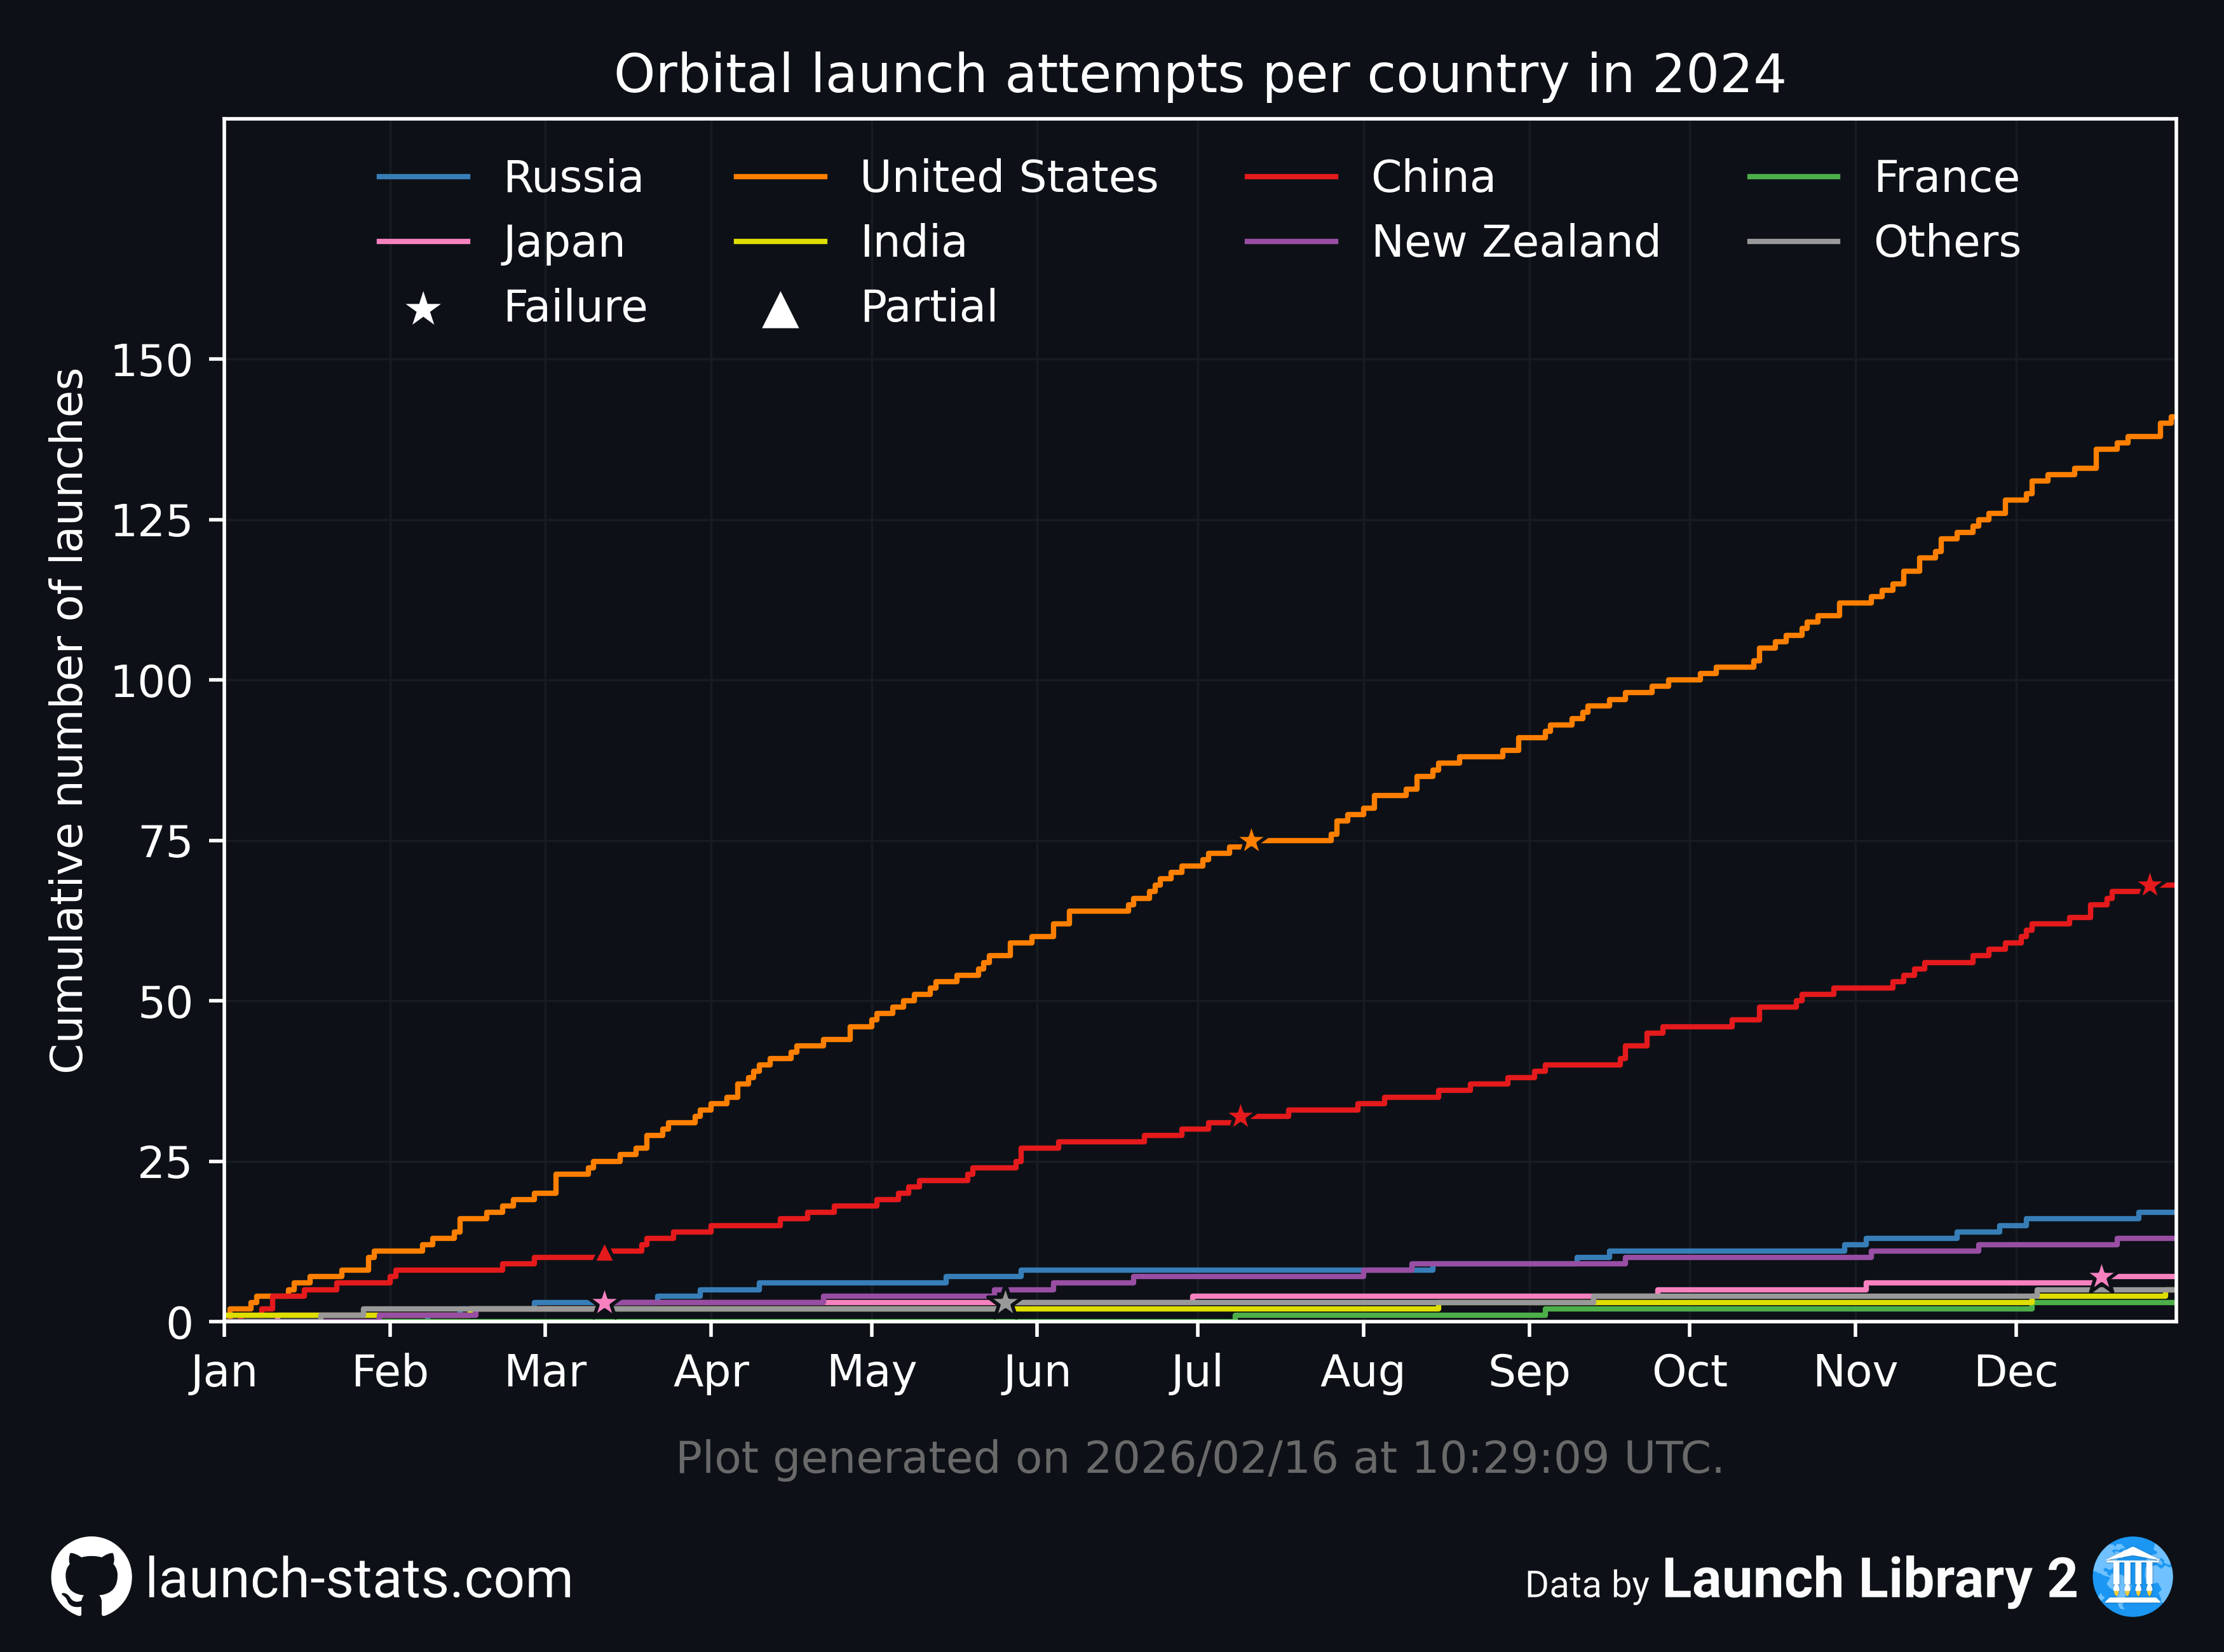
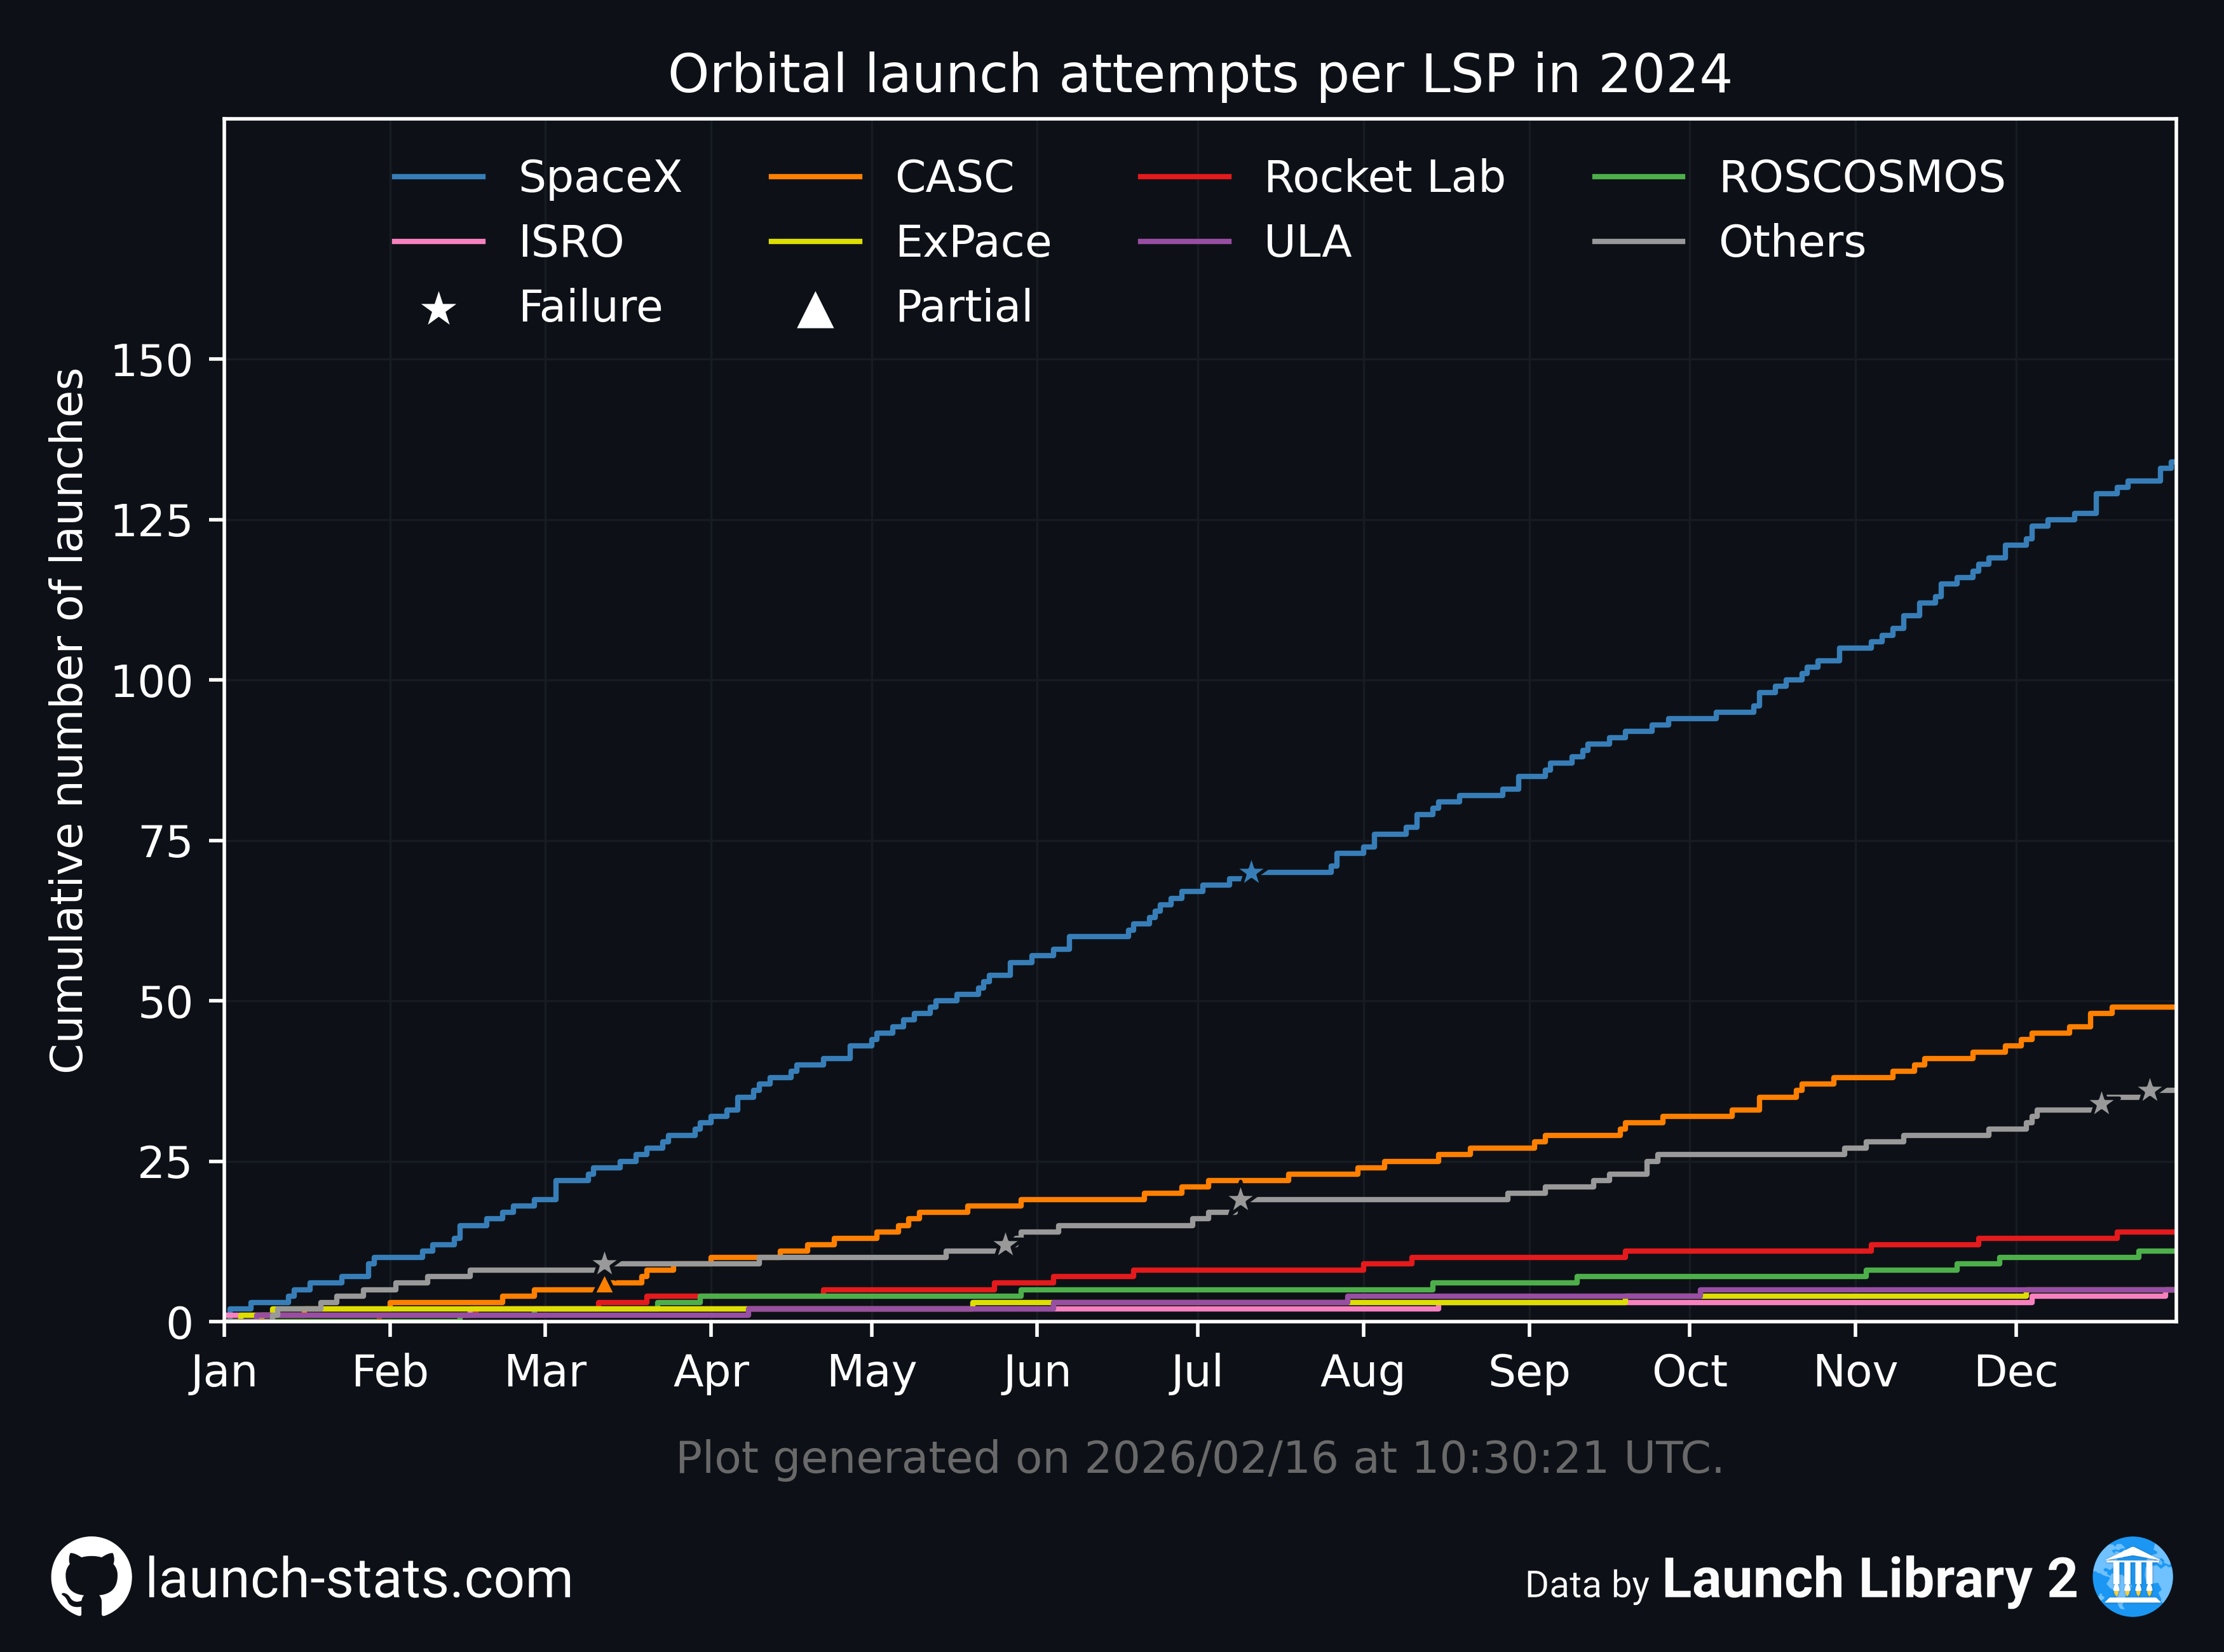
2024 plots
Historical data plots
Launch cadence evolution
All country launch cadence plots

Maiden flights and reusability
Day-of-year plots
Owner
- Name: Arnaud Muller
- Login: Nosudrum
- Kind: user
- Location: Europe (currently in Toulouse)
- Company: The Space Devs
- Website: https://go4liftoff.com/
- Twitter: nosudrum
- Repositories: 3
- Profile: https://github.com/Nosudrum
Aerospace & Mechanical Engineering student, staff at The Space Devs.
GitHub Events
Total
- Release event: 1
- Watch event: 4
- Push event: 242
- Pull request event: 1
- Create event: 2
Last Year
- Release event: 1
- Watch event: 4
- Push event: 242
- Pull request event: 1
- Create event: 2
Committers
Last synced: almost 2 years ago
Top Committers
| Name | Commits | |
|---|---|---|
| Nosudrum | N****m | 404 |
| Arnaud Muller | a****8@g****m | 379 |
Issues and Pull Requests
Last synced: almost 2 years ago
All Time
- Total issues: 26
- Total pull requests: 0
- Average time to close issues: 14 days
- Average time to close pull requests: N/A
- Total issue authors: 1
- Total pull request authors: 0
- Average comments per issue: 0.58
- Average comments per pull request: 0
- Merged pull requests: 0
- Bot issues: 0
- Bot pull requests: 0
Past Year
- Issues: 0
- Pull requests: 0
- Average time to close issues: N/A
- Average time to close pull requests: N/A
- Issue authors: 0
- Pull request authors: 0
- Average comments per issue: 0
- Average comments per pull request: 0
- Merged pull requests: 0
- Bot issues: 0
- Bot pull requests: 0
Top Authors
Issue Authors
- Nosudrum (26)
Pull Request Authors
- Nosudrum (1)
Top Labels
Issue Labels
Pull Request Labels
Dependencies
- actions/checkout main composite
- actions/setup-python v2 composite
- tqdm