scikit-eo
scikit-eo: A Python package for Remote Sensing Data Analysis - Published in JOSS (2024)
Science Score: 95.0%
This score indicates how likely this project is to be science-related based on various indicators:
-
○CITATION.cff file
-
✓codemeta.json file
Found codemeta.json file -
✓.zenodo.json file
Found .zenodo.json file -
✓DOI references
Found 3 DOI reference(s) in README and JOSS metadata -
✓Academic publication links
Links to: joss.theoj.org -
✓Committers with academic emails
1 of 7 committers (14.3%) from academic institutions -
○Institutional organization owner
-
✓JOSS paper metadata
Published in Journal of Open Source Software
Scientific Fields
Repository
A Python package for Remote Sensing Data Analysis
Basic Info
- Host: GitHub
- Owner: yotarazona
- License: other
- Language: Python
- Default Branch: main
- Homepage: https://yotarazona.github.io/scikit-eo/
- Size: 39.1 MB
Statistics
- Stars: 203
- Watchers: 7
- Forks: 23
- Open Issues: 3
- Releases: 17
Metadata Files
README.md
scikit-eo: A Python package for Remote Sensing Data Analysis
![]()
![]()
![]()

![]()

![]()
Journal of Open Source Software
Citation
Please, to cite the scikit-eo package in publications, use this paper:
Tarazona, Y., Benitez-Paez, F., Nowosad, J., Drenkhan, F., Nowosad, J., and Timaná, M. (2024). scikit-eo: A Python package for Remote Sensing Data Analysis. Journal of Open Source Software, 9(99), 6692. DOI: 10.21105/joss.06692
Introduction
Nowadays, remotely sensed data has increased dramatically. Microwaves and optical images with different spatial and temporal resolutions are available and are used to monitor a variety of environmental issues such as deforestation, land degradation, land use and land cover change, among others. Although there are efforts (i.e., Python packages, forums, communities, etc.) to make available line-of-code tools for pre-processing, processing and analysis of satellite imagery, there is still a gap that needs to be filled. In other words, too much time is still spent by many users developing Python lines of code. Algorithms for mapping land degradation through a linear trend of vegetation indices, fusion optical and radar images to classify vegetation cover, and calibration of machine learning algorithms, among others, are not available yet.
Therefore, scikit-eo is a Python package that provides tools for remote sensing. This package was developed to fill the gaps in remotely sensed data processing tools. Most of the tools are based on scientific publications, and others are useful algorithms that will allow processing to be done in a few lines of code. With these tools, the user will be able to invest time in analyzing the results of their data and not spend time on elaborating lines of code, which can sometimes be stressful.
Tools for Remote Sensing
| Name of functions/classes | Description|
| -------------------| --------------------------------------------------------------------------|
| mla | Machine Learning (Random Forest, Support Vector Machine, Decition Tree, Naive Bayes, Neural Network, etc.) |
| calmla | Calibrating supervised classification in Remote Sensing (e.g., Monte Carlo Cross-Validation, Leave-One-Out Cross-Validation, etc.) |
| confintervalML | Information of confusion matrix by proportions of area, overall accuracy, user's accuracy with confidence interval and estimated area with confidence interval as well. |
| rkmeans | K-means classification |
| calkmeans | This function allows to calibrate the kmeans algorithm. It is possible to obtain the best k value and the best embedded algorithm in kmeans. |
| pca | Principal Components Analysis |
| atmosCorr | Atmospheric Correction of satellite imagery |
| deepLearning | Deep Learning algorithms |
| linearTrend | Linear trend is useful for mapping forest degradation or land degradation |
| fusionrs | This algorithm allows to fuse images coming from different spectral sensors (e.g., optical-optical, optical and SAR or SAR-SAR). Among many of the qualities of this function, it is possible to obtain the contribution (%) of each variable in the fused image |
| sma | Spectral Mixture Analysis - Classification sup-pixel |
| tassCap | The Tasseled-Cap Transformation. |
You will find more algorithms!.
Dependencies used by scikit-eo
All dependencies used by scikit-eo are as follows:
numpy, pandas, matplotlib, rasterio, seaborn, statsmodels, scikit-learn, scipy, pytest, dbfread, fiona and geopandas. By installing scikit-eo all these packages will be installed!.
Installation
To use scikit-eo it is necessary to install it. There are two options:
1. From PyPI
scikit-eo is available on PyPI, so to install it, run this command in your terminal:
python
pip install scikeo
2. Installing from source
It is also possible to install the latest development version directly from the GitHub repository with:
python
pip install git+https://github.com/yotarazona/scikit-eo
containerizing scikit-eo
Note: It is a recommended practice to provide some instructions for isolating/containerizing scikit-eo. It would benefit their use and thus avoid that some dependencies are not compatible with others. For example, conda provides an easy solution.
python
conda create -n scikiteo python = 3.8
Then, activate the environment created
python
conda activate scikiteo
Then finally, scikit-eo can be install within this new environment using via PyPI or from the GitHub repository.
Example
1.0 Applying Machine Learning
Libraries to be used:
python
import rasterio
import numpy as np
from scikeo.mla import MLA
from scikeo.process import extract
import matplotlib.pyplot as plt
import matplotlib as mpl
import geopandas as gpd
from scikeo.plot import plotRGB
from scikeo.writeRaster import writeRaster
2.0 Optical image
Landsat-8 OLI (Operational Land Imager) will be used to obtain in order to classify using Random Forest (RF). This image, which is in surface reflectance with bands: - Blue -> B2 - Green -> B3 - Red -> B4 - Nir -> B5 - Swir1 -> B6 - Swir2 -> B7
This image will be downloaded using the following codes:
```python import requests, zipfile from io import BytesIO
Defining the zip file URL
url = 'https://github.com/yotarazona/data/raw/main/data/01machinelearning.zip'
Split URL to get the file name
filename = url.split('/')[-1]
Downloading the file by sending the request to the URL
req = requests.get(url)
extracting the zip file contents
file = zipfile.ZipFile(BytesIO(req.content)) file.extractall() ```
3.0 Supervised Classification using Random Forest
Image and endmembers
```python datadir = "01machine_learning/"
satellite image
pathraster = datadir + "LC0823206620190727SR.tif" img = rasterio.open(pathraster)
endmembers
pathendm = datadir + "endmembers.shp" endm = gpd.readfile(pathendm) ```
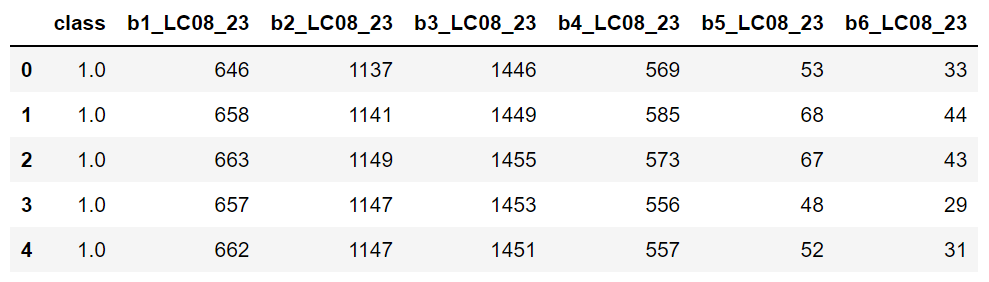
```python
endmembers
endm = extract(img, endm) endm ```
Instance of mla():
python
inst = MLA(image = img, endmembers = endm)
Applying Random Forest:
python
svm_class = inst.SVM(training_split = 0.7)
4.0 Results
Dictionary of results
python
svm_class.keys()
Overall accuracy
python
svm_class.get('Overall_Accuracy')
Kappa index
python
svm_class.get('Kappa_Index')
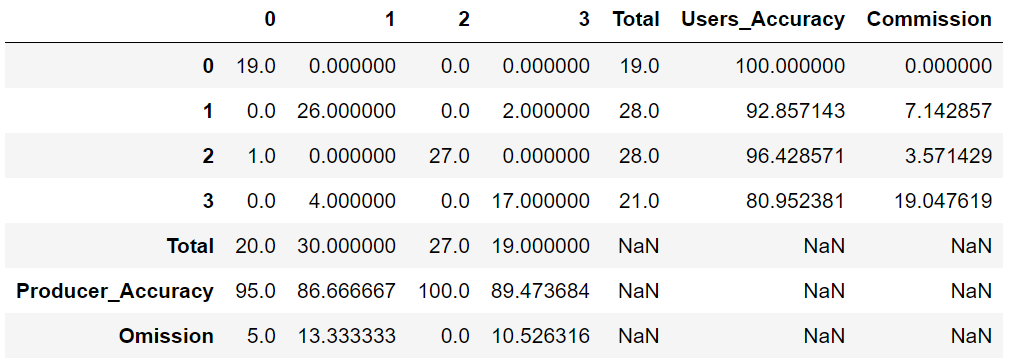
Confusion matrix or error matrix
python
svm_class.get('Confusion_Matrix')
Preparing the image before plotting
```python
Let's define the color palette
palette = mpl.colors.ListedColormap(["#2232F9","#F922AE","#229954","#7CED5E"]) ```
Applying the plotRGB() algorithm is easy:
```python
Let´s plot
fig, axes = plt.subplots(nrows = 1, ncols = 2, figsize = (15, 9))
satellite image
plotRGB(img, title = 'Image in Surface Reflectance', ax = axes[0])
class results
axes[1].imshow(svmclass.get('ClassificationMap'), cmap = palette) axes[1].set_title("Classification map") axes[1].grid(False) ```
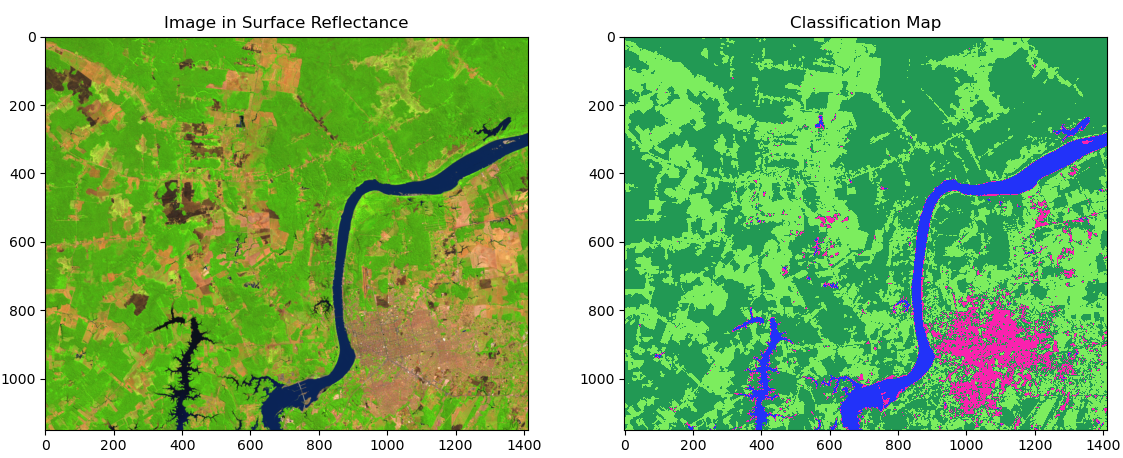
This result shows us how we can use the scikit-eo python package in order to obtaind a Land Cover map. Following this tutorial is it possible to use different algorithms such as Support Vector Machine, Decision Tree, Neural Networks, amont others.
- Free software: Apache Software License 2.0
- Documentation:
Acknowledgment
Special thanks to: - David Montero Loaiza for the idea of the package name scikit-eo.
- Qiusheng Wu for the suggestions that helped to improve the package.
Credits
This package was created with Cookiecutter
Logo inspiration
The logo on the package is inspired by fog oasis known as "lomas".
Owner
- Name: Yonatan Tarazona
- Login: yotarazona
- Kind: user
- Location: Lima, Peru
- Twitter: GeoYons
- Repositories: 1
- Profile: https://github.com/yotarazona
Researcher. Microwave and optical remote sensing, vegetation mapping. email: geoyons@gmail.com
JOSS Publication
scikit-eo: A Python package for Remote Sensing Data Analysis
Authors

Department of Earth Sciences, Center for Earth and Space Research (CITEUC), University of Coimbra, Portugal
The School of Geography and Sustainable Development, University of St Andrews, The UK
Adam Mickiewicz University in Poznań
Geography and the Environment, Department of Humanities, Pontificia Universidad Católica del Perú, Lima, Peru
Applied Geography Research Center, Pontificia Universidad Católica del Perú, Lima, Peru
Editor
Michael Mahoney
Tags
Remote Sensing Earth Observation Machine Learning Deep Learning Spatial AnalysisGitHub Events
Total
- Create event: 2
- Release event: 2
- Issues event: 5
- Watch event: 63
- Issue comment event: 7
- Push event: 8
- Pull request event: 4
- Fork event: 6
Last Year
- Create event: 2
- Release event: 2
- Issues event: 5
- Watch event: 63
- Issue comment event: 7
- Push event: 8
- Pull request event: 4
- Fork event: 6
Committers
Last synced: 12 months ago
Top Committers
| Name | Commits | |
|---|---|---|
| Yonatan Tarazona | y****9@g****m | 458 |
| mfbenitezp | f****z@t****k | 18 |
| Jakub Nowosad | N****d | 7 |
| Michael Mahoney | m****8@g****m | 3 |
| Robin Cole | r****e@g****m | 2 |
| senthilkumar-dimitra | s****a@d****o | 2 |
| RichardScottOZ | R****t@o****m | 1 |
Committer Domains (Top 20 + Academic)
Issues and Pull Requests
Last synced: 11 months ago
All Time
- Total issues: 24
- Total pull requests: 13
- Average time to close issues: 13 days
- Average time to close pull requests: about 3 hours
- Total issue authors: 5
- Total pull request authors: 6
- Average comments per issue: 2.33
- Average comments per pull request: 0.77
- Merged pull requests: 12
- Bot issues: 0
- Bot pull requests: 0
Past Year
- Issues: 6
- Pull requests: 5
- Average time to close issues: 5 days
- Average time to close pull requests: about 5 hours
- Issue authors: 3
- Pull request authors: 3
- Average comments per issue: 1.17
- Average comments per pull request: 1.2
- Merged pull requests: 5
- Bot issues: 0
- Bot pull requests: 0
Top Authors
Issue Authors
- dbuscombe-usgs (11)
- KBodolai (7)
- robmarkcole (4)
- edudzikorku (1)
- alxmrs (1)
Pull Request Authors
- mfbenitezp (8)
- mikemahoney218 (5)
- robmarkcole (3)
- senthilkumar-dimitra (2)
- RichardScottOZ (1)
- yotarazona (1)
- senthil1729 (1)
Top Labels
Issue Labels
Pull Request Labels
Packages
- Total packages: 1
-
Total downloads:
- pypi 141 last-month
- Total dependent packages: 0
- Total dependent repositories: 0
- Total versions: 28
- Total maintainers: 3
pypi.org: scikeo
Remote Sensing Tools
- Homepage: https://github.com/yotarazona/scikit-eo
- Documentation: https://scikeo.readthedocs.io/
- License: Apache Software License 2.0
-
Latest release: 0.2.35
published almost 2 years ago