meteostat
Access and analyze historical weather and climate data with Python.
Science Score: 44.0%
This score indicates how likely this project is to be science-related based on various indicators:
-
✓CITATION.cff file
Found CITATION.cff file -
✓codemeta.json file
Found codemeta.json file -
✓.zenodo.json file
Found .zenodo.json file -
○DOI references
-
○Academic publication links
-
○Committers with academic emails
-
○Institutional organization owner
-
○JOSS paper metadata
-
○Scientific vocabulary similarity
Low similarity (13.3%) to scientific vocabulary
Keywords
Repository
Access and analyze historical weather and climate data with Python.
Basic Info
- Host: GitHub
- Owner: meteostat
- License: mit
- Language: Python
- Default Branch: master
- Homepage: https://dev.meteostat.net/python/
- Size: 1.3 MB
Statistics
- Stars: 524
- Watchers: 9
- Forks: 65
- Open Issues: 26
- Releases: 52
Topics
Metadata Files
README.md
Meteostat Python Package
The Meteostat Python library provides a simple API for accessing open weather and climate data. The historical observations and statistics are collected by Meteostat from different public interfaces, most of which are governmental.
Among the data sources are national weather services like the National Oceanic and Atmospheric Administration (NOAA) and Germany's national weather service (DWD).
Are you looking for a hosted solution? Try our JSON API.
Installation
The Meteostat Python package is available through PyPI:
sh
pip install meteostat
Meteostat requires Python 3.6 or higher. If you want to visualize data, please install Matplotlib, too.
Documentation
The Meteostat Python library is divided into multiple classes which provide access to the actual data. The documentation covers all aspects of the library:
- Selecting Locations
- Time Series
- Miscellaneous Data
- Library
Example
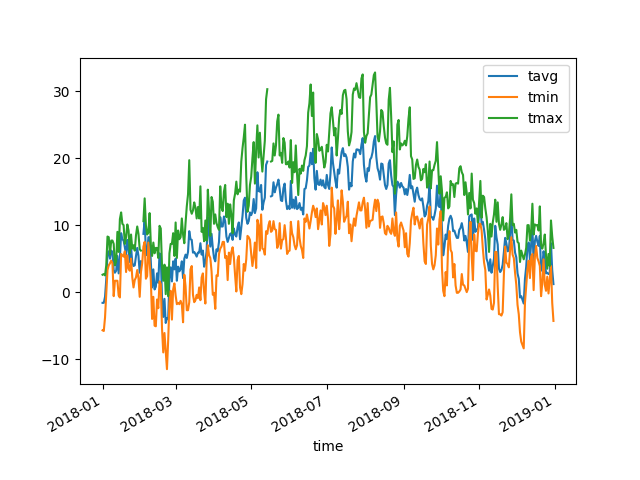
Let's plot 2018 temperature data for Vancouver, BC:
```python
Import Meteostat library and dependencies
from datetime import datetime import matplotlib.pyplot as plt from meteostat import Point, Daily
Set time period
start = datetime(2018, 1, 1) end = datetime(2018, 12, 31)
Create Point for Vancouver, BC
location = Point(49.2497, -123.1193, 70)
Get daily data for 2018
data = Daily(location, start, end) data = data.fetch()
Plot line chart including average, minimum and maximum temperature
data.plot(y=['tavg', 'tmin', 'tmax']) plt.show() ```
Take a look at the expected output:
Contributing
Instructions on building and testing the Meteostat Python package can be found in the documentation. More information about the Meteostat bulk data interface is available here.
Donating
If you want to support the project financially, you can make a donation using one of the following services:
Data License
Meteorological data is provided under the terms of the Creative Commons Attribution-NonCommercial 4.0 International Public License (CC BY-NC 4.0). You may build upon the material for any purpose, even commercially. However, you are not allowed to redistribute Meteostat data "as-is" for commercial purposes.
By using the Meteostat Python library you agree to our terms of service. All meteorological data sources used by the Meteostat project are listed here.
Code License
The code of this library is available under the MIT license.
Owner
- Name: Meteostat
- Login: meteostat
- Kind: organization
- Email: info@meteostat.net
- Website: https://meteostat.net
- Twitter: meteost
- Repositories: 14
- Profile: https://github.com/meteostat
The Weather's Record Keeper
Citation (CITATION.cff)
cff-version: 1.2.0
title: Meteostat Python
message: >-
  If you use this software, please cite it using the
  metadata from this file.
type: software
authors:
  - given-names: Christian Sebastian
    family-names: Lamprecht
    email: cla@meteostat.net
    orcid: 'https://orcid.org/0000-0003-3301-2852'
GitHub Events
Total
- Create event: 4
- Release event: 4
- Issues event: 13
- Watch event: 85
- Issue comment event: 22
- Push event: 65
- Pull request review event: 1
- Pull request review comment event: 3
- Pull request event: 8
- Fork event: 5
Last Year
- Create event: 4
- Release event: 4
- Issues event: 13
- Watch event: 85
- Issue comment event: 22
- Push event: 65
- Pull request review event: 1
- Pull request review comment event: 3
- Pull request event: 8
- Fork event: 5
Committers
Last synced: 11 months ago
Top Committers
| Name | Commits | |
|---|---|---|
| Christian Lamprecht | c****t@a****e | 124 |
| e-hamza | 3****a | 1 |
Committer Domains (Top 20 + Academic)
Issues and Pull Requests
Last synced: 10 months ago
All Time
- Total issues: 99
- Total pull requests: 58
- Average time to close issues: about 2 months
- Average time to close pull requests: about 1 month
- Total issue authors: 77
- Total pull request authors: 11
- Average comments per issue: 2.03
- Average comments per pull request: 0.28
- Merged pull requests: 55
- Bot issues: 0
- Bot pull requests: 0
Past Year
- Issues: 15
- Pull requests: 8
- Average time to close issues: 9 days
- Average time to close pull requests: 6 days
- Issue authors: 13
- Pull request authors: 1
- Average comments per issue: 0.4
- Average comments per pull request: 0.25
- Merged pull requests: 7
- Bot issues: 0
- Bot pull requests: 0
Top Authors
Issue Authors
- clampr (8)
- MarieCurie13 (3)
- lefkothea1 (3)
- guidocioni (3)
- bram-tv (3)
- xenide (2)
- gvangelatos (2)
- magowiz (2)
- GangaBisht (2)
- WillBaumgardnerVevo (2)
- cminton-hub (2)
- Weyaaron (2)
- andersoncarlosfs (1)
- somedude72 (1)
- mullerhai (1)
Pull Request Authors
- clampr (43)
- ngehrsitz (2)
- Weyaaron (2)
- LairdStreak (2)
- meteoDaniel (2)
- andersoncarlosfs (2)
- e-hamza (1)
- eisber (1)
- tnfru (1)
- jan-meyer-1986 (1)
- Jonas1312 (1)
Top Labels
Issue Labels
Pull Request Labels
Packages
- Total packages: 2
-
Total downloads:
- pypi 489,328 last-month
- Total docker downloads: 138
-
Total dependent packages: 10
(may contain duplicates) -
Total dependent repositories: 41
(may contain duplicates) - Total versions: 105
- Total maintainers: 1
pypi.org: meteostat
Access and analyze historical weather and climate data with Python.
- Homepage: https://github.com/meteostat/meteostat-python
- Documentation: https://meteostat.readthedocs.io/
- License: MIT
-
Latest release: 1.7.4
published about 1 year ago
Rankings
Maintainers (1)
proxy.golang.org: github.com/meteostat/meteostat-python
- Documentation: https://pkg.go.dev/github.com/meteostat/meteostat-python#section-documentation
- License: mit
-
Latest release: v1.7.4
published about 1 year ago
Rankings
Dependencies
- black *
- matplotlib *
- numpy *
- pandas >=1.1
- pylint *
- pytest *
- pytz *
- twine *
- wheel *
- pandas >=1.1
- peter-evans/create-or-update-project-card v1 composite
- actions/checkout v2 composite
- github/super-linter v3.17.0 composite
- actions/checkout v2 composite
- actions/setup-python v1 composite
- actions/checkout v2 composite
- actions/setup-python v1 composite