eomaps
A library to create interactive maps of geographical datasets
Science Score: 59.0%
This score indicates how likely this project is to be science-related based on various indicators:
-
○CITATION.cff file
-
✓codemeta.json file
Found codemeta.json file -
✓.zenodo.json file
Found .zenodo.json file -
✓DOI references
Found 8 DOI reference(s) in README -
✓Academic publication links
Links to: zenodo.org -
✓Committers with academic emails
2 of 6 committers (33.3%) from academic institutions -
○Institutional organization owner
-
○JOSS paper metadata
-
○Scientific vocabulary similarity
Low similarity (14.4%) to scientific vocabulary
Keywords
Repository
A library to create interactive maps of geographical datasets
Basic Info
- Host: GitHub
- Owner: raphaelquast
- License: bsd-3-clause
- Language: Python
- Default Branch: master
- Homepage: https://eomaps.readthedocs.io/
- Size: 96.6 MB
Statistics
- Stars: 357
- Watchers: 4
- Forks: 27
- Open Issues: 17
- Releases: 88
Topics
Metadata Files
README.md
![]()


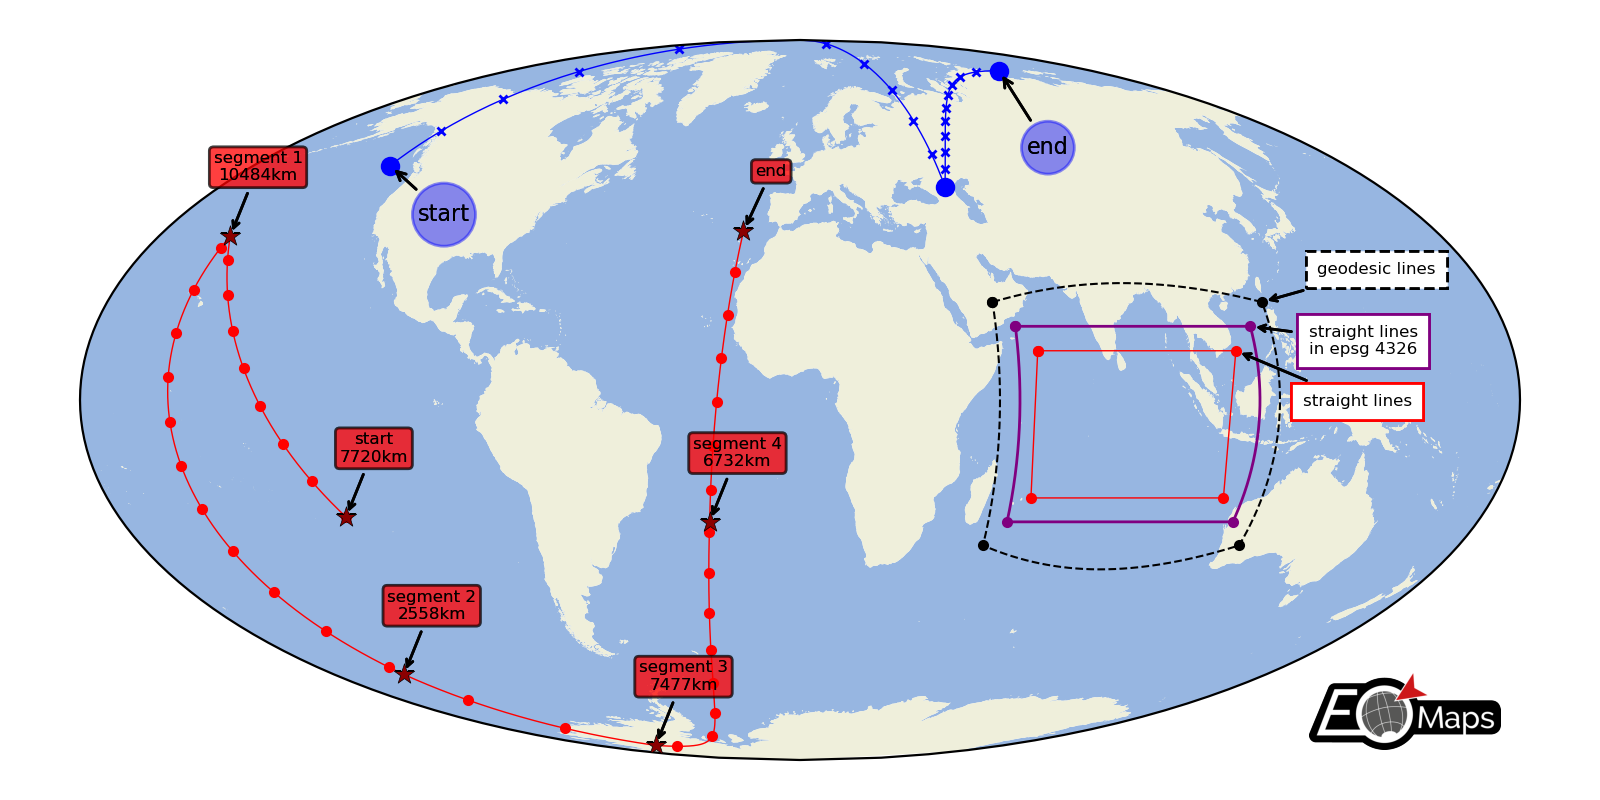
A python package to visualize and analyze geographical datasets.
| EOmaps aims to provide a comprehensive, flexible, well-documented and easy-to-use API to create publication-ready maps that can directly be used for interactive data analysis. |
What can I do with EOmaps?
EOmaps is built on top of matplotlib and cartopy and integrates well with the scientific python infrastructure (e.g., numpy, pandas, geopandas, xarray etc.), allowing you to visualize point-, raster- or vector-datasets provided in almost any format you can imagine, no matter if you're dealing with just a few unsorted datapoints or multi-dimensional stacks of global high-resolution datasets.
Figures created with EOmaps are multi-layered, so you can (transparently) overlay and interactively compare your datasets with ease. With the accompanying GUI widget, you can quickly switch layers, change the layout, examine the large collection of features and web-map services, and explore the capabilities of EOmaps. Once you're map is ready, you can export it as high-resolution image or vector-graphic for further editing. Leveraging the powers of matplotlib, you can also embed interactive maps in Jupyter Notebooks, on a webpage or in GUI frameworks like Qt, tkinter etc..
[!IMPORTANT]
EOmaps is 100% free and open-source.
As such, acknowledgement is extremely important to allow continued support and development of the package.Did EOmaps help in your research? $\Rightarrow$ Add a ✔️ Citation to your publication!
BibTeX
The following BibTeX entry uses a DOI that always points to the latest release of EOmaps!
(You can get the DOI for a specific version form the zenodo-page) ```bibtex @software{eomaps, author = {Raphael Quast}, title = {EOmaps: A python package to visualize and analyze geographical datasets.}, doi = {10.5281/zenodo.6459598}, url = {https://doi.org/10.5281/zenodo.6459598} } ```
🚀 Getting started
Head over to the start-page of the 📖 Documentation to get an overview of all available features and functionalities!
[!TIP] For a quick hands-on introduction, checkout this article on dev.to:
Geographic data visualization and analysis with EOmaps: Interactive maps in python!
🔨 Installation
To install EOmaps (and all its dependencies) with the conda package-manager, simply use:
python
conda install -c conda-forge eomaps
[!TIP] To get a huge speedup, use mamba to solve the dependencies!
python
mamba install -c conda-forge eomaps
Advanced users can also use
pipto install EOmaps (and selectively install optional dependency groups)python pip install eomaps # install only minimal required dependencies pip install eomaps[all] # install all optional dependencies ...
For more detailes, have a look at the Installation Instructions or the quickstart guide "From 0 to EOmaps"!
🌟 Contribute
Interested in contributing to EOmaps? Awesome!
You can find detailed instructions on how to setup EOmaps for development in the Contribution Guide!
Found a bug or got an idea for an interesting feature?
Open an issue or start a discussion, and I'll see what I can do!
|
|

|

|
|
|

|
|

|
|

|
|

|
☕ Support
The development of EOmaps has been supported by:
TU Wien Department of Geodesy and Geoinformation - Research Area Remote Sensing
🌼 Thanks to
- Jakob Quast for designing the nice logo!
Owner
- Name: Raphael Quast
- Login: raphaelquast
- Kind: user
- Repositories: 8
- Profile: https://github.com/raphaelquast
GitHub Events
Total
- Create event: 2
- Release event: 2
- Issues event: 13
- Watch event: 21
- Issue comment event: 26
- Push event: 16
- Pull request review comment event: 3
- Pull request review event: 2
- Pull request event: 9
- Fork event: 3
Last Year
- Create event: 2
- Release event: 2
- Issues event: 13
- Watch event: 21
- Issue comment event: 26
- Push event: 16
- Pull request review comment event: 3
- Pull request review event: 2
- Pull request event: 9
- Fork event: 3
Committers
Last synced: over 2 years ago
Top Committers
| Name | Commits | |
|---|---|---|
| Raphael | r****t@g****t | 2,760 |
| Raphael Quast | r****t@g****t | 151 |
| Max Hollmann | m****n@g****m | 1 |
| Domagoj K. Hackenberger | d****k@g****m | 1 |
| Alan Gerber | a****r | 1 |
| Edward Betts | e****d@4****m | 1 |
Committer Domains (Top 20 + Academic)
Issues and Pull Requests
Last synced: 10 months ago
All Time
- Total issues: 69
- Total pull requests: 128
- Average time to close issues: about 2 months
- Average time to close pull requests: 22 days
- Total issue authors: 16
- Total pull request authors: 10
- Average comments per issue: 1.8
- Average comments per pull request: 1.34
- Merged pull requests: 104
- Bot issues: 0
- Bot pull requests: 0
Past Year
- Issues: 9
- Pull requests: 11
- Average time to close issues: about 1 month
- Average time to close pull requests: 16 days
- Issue authors: 6
- Pull request authors: 2
- Average comments per issue: 1.22
- Average comments per pull request: 2.0
- Merged pull requests: 8
- Bot issues: 0
- Bot pull requests: 0
Top Authors
Issue Authors
- raphaelquast (38)
- banesullivan (6)
- yun881201 (6)
- salahelfarissi (3)
- vianneylan (2)
- ihimmelb (2)
- ocehugo (2)
- nguyen-vu-son (1)
- cnavacch (1)
- sebhahn (1)
- jklobas (1)
- konstantinfalkner (1)
- DomagojHack (1)
- Joshdpaul (1)
- GongdaLu (1)
Pull Request Authors
- raphaelquast (132)
- nathanjmcdougall (6)
- banesullivan (2)
- Fanchengyan (2)
- ihimmelb (2)
- maxhollmann (1)
- gitter-badger (1)
- DomagojHack (1)
- EdwardBetts (1)
- akgerber (1)
Top Labels
Issue Labels
Pull Request Labels
Packages
- Total packages: 4
-
Total downloads:
- pypi 1,965 last-month
-
Total dependent packages: 2
(may contain duplicates) -
Total dependent repositories: 3
(may contain duplicates) - Total versions: 214
- Total maintainers: 1
proxy.golang.org: github.com/raphaelquast/eomaps
- Documentation: https://pkg.go.dev/github.com/raphaelquast/eomaps#section-documentation
- License: bsd-3-clause
-
Latest release: v8.3.3+incompatible
published about 1 year ago
Rankings
proxy.golang.org: github.com/raphaelquast/EOmaps
- Documentation: https://pkg.go.dev/github.com/raphaelquast/EOmaps#section-documentation
- License: bsd-3-clause
-
Latest release: v8.3.3+incompatible
published about 1 year ago
Rankings
pypi.org: eomaps
A library to create interactive maps of geographical datasets.
- Documentation: https://eomaps.readthedocs.io/
- License: BSD 3-Clause License Copyright (c) 2021, The EOmaps authors. Redistribution and use in source and binary forms, with or without modification, are permitted provided that the following conditions are met: 1. Redistributions of source code must retain the above copyright notice, this list of conditions and the following disclaimer. 2. Redistributions in binary form must reproduce the above copyright notice, this list of conditions and the following disclaimer in the documentation and/or other materials provided with the distribution. 3. Neither the name of the copyright holder nor the names of its contributors may be used to endorse or promote products derived from this software without specific prior written permission. THIS SOFTWARE IS PROVIDED BY THE COPYRIGHT HOLDERS AND CONTRIBUTORS "AS IS" AND ANY EXPRESS OR IMPLIED WARRANTIES, INCLUDING, BUT NOT LIMITED TO, THE IMPLIED WARRANTIES OF MERCHANTABILITY AND FITNESS FOR A PARTICULAR PURPOSE ARE DISCLAIMED. IN NO EVENT SHALL THE COPYRIGHT HOLDER OR CONTRIBUTORS BE LIABLE FOR ANY DIRECT, INDIRECT, INCIDENTAL, SPECIAL, EXEMPLARY, OR CONSEQUENTIAL DAMAGES (INCLUDING, BUT NOT LIMITED TO, PROCUREMENT OF SUBSTITUTE GOODS OR SERVICES; LOSS OF USE, DATA, OR PROFITS; OR BUSINESS INTERRUPTION) HOWEVER CAUSED AND ON ANY THEORY OF LIABILITY, WHETHER IN CONTRACT, STRICT LIABILITY, OR TORT (INCLUDING NEGLIGENCE OR OTHERWISE) ARISING IN ANY WAY OUT OF THE USE OF THIS SOFTWARE, EVEN IF ADVISED OF THE POSSIBILITY OF SUCH DAMAGE.
-
Latest release: 8.3.3
published about 1 year ago
Rankings
Maintainers (1)
conda-forge.org: eomaps
EOmaps is a python package to visualize and analyze geographical datasets. It aims to provide a comprehensive, flexible, well-documented and easy-to-use API to create publication-ready maps that can directly be used for interactive data analysis. EOmaps is built on top of matplotlib and cartopy and integrates well with the scientific python infrastructure (e.g., numpy, pandas, geopandas, xarray etc.), allowing you to visualize point-, raster- or vector-datasets provided in almost any format you can imagine, no matter if you're dealing with just a few unsorted datapoints or multi-dimensional stacks of global high-resolution datasets. Figures created with EOmaps are multi-layered, so you can (transparently) overlay and interactively compare your datasets with ease. With the accompanying GUI widget, you can quickly switch layers, change the layout, examine the large collection of features and web-map services, and explore the capabilities of EOmaps. Once you're map is ready, you can export it as high-resolution image or vector-graphic for further editing. Leveraging the powers of matplotlib, you can also embed interactive maps in Jupyter Notebooks, on a webpage or in GUI frameworks like Qt, tkinter etc.. Check the documentation for more details & examples!
- Homepage: https://github.com/raphaelquast/EOmaps
- License: BSD-3-Clause
-
Latest release: 4.4.3
published almost 4 years ago
Rankings
Dependencies
- actions/checkout v3 composite
- actions/setup-python v4 composite
- actions/checkout v3 composite
- actions/setup-python v4 composite
- pre-commit/action v3.0.0 composite
- actions/checkout v3 composite
- codecov/codecov-action v3 composite
- conda-incubator/setup-miniconda v2 composite
- cairosvg *
- cartopy >=0.20.0
- click *
- descartes *
- geopandas *
- mapclassify *
- matplotlib >=3.4
- numpy *
- owslib *
- packaging *
- pandas *
- pyepsg *
- pyproj *
- requests *
- scipy *
- xmltodict *