Science Score: 75.0%
This score indicates how likely this project is to be science-related based on various indicators:
-
✓CITATION.cff file
Found CITATION.cff file -
✓codemeta.json file
Found codemeta.json file -
✓.zenodo.json file
Found .zenodo.json file -
✓DOI references
Found 6 DOI reference(s) in README -
✓Academic publication links
Links to: zenodo.org -
○Academic email domains
-
✓Institutional organization owner
Organization stairlab has institutional domain (stairlab.berkeley.edu) -
○JOSS paper metadata
-
○Scientific vocabulary similarity
Low similarity (16.8%) to scientific vocabulary
Keywords
Repository
Finite element visualization framework
Basic Info
- Host: GitHub
- Owner: STAIRlab
- Language: Python
- Default Branch: master
- Homepage: http://veux.io/
- Size: 368 MB
Statistics
- Stars: 29
- Watchers: 0
- Forks: 11
- Open Issues: 0
- Releases: 0
Topics
Metadata Files
README.md

Finite element visualization
veux is a visualization library for finite element analysis that is built on the idea that your renderings should be easy to save, share, and revisit.
veux is a finite element visualization library that leverages modern
web technologies to produce sharable, efficient, and detailed renderings.
Unlike most tools that only provide temporary visualization, veux generates
persistent 3D models that can be stored in files, shared with colleagues, and
viewed with any standard 3D model viewer. This means anyone can interact with
the renderings without needing to install specialized software or even Python.
Simply open the 3D object with your computers 3D viewer (e.g., 3D Viewer on
Windows) or load it into a free online viewer in like gltf-viewer.
veux is further distinguished by its features for geometrically exact simulations
of constrained bodies like rods and shells.
Documentation is available at https://veux.io/ and an extensive set of examples at https://gallery.stairlab.io.
Features
- Detailed Render frames with extruded cross sections
- Persistence: Save finite element visualizations as persistent 3D models that can be revisited and analyzed at any time.
- Portability: Share renderings effortlessly with colleagues, enabling seamless collaboration and review.
- Accessibility: View and interact with the models using any standard 3D model viewer, eliminating the need for specialized software or Python installation.
Getting Started
To install veux run:
shell
pip install veux
Python Interface
To render a model directly from Python, use the veux.render function:
python
artist = veux.render(model, canvas=canvas)
- model: the
modelparameter can be of several types - canvas: The
canvasparameter is a string which indicates which "backend" technology to use. The options are:"gltf"is the default canvas and produces the highest quality renderings. You can save renderings drawn by this backend to either.htmlor.glbfiles..glbfiles are preferred as they are a natural format for 3D objects and can be viewed by standard 3D viewing applications."plotly"is best for model debugging as it is able to embed model details like node/element numbers and properties with hover annotations. However, the renderings produced by this backend dont look quite as good as withgltf."matplotlib": can be used to programatically create.pngfiles.
Once the artist is created, the rendering can either be displayed or saved to a file. Each canvas supports slightly different options:
- viewing To view a rendering that is generated either with canvas="gltf" or canvas="plotly", use the veux.serve() function:
python
  veux.serve(artist)
After running you will see a message like the following printed
to your terminal:
      Bottle v0.13.1 server starting up (using WSGIRefServer())...
      Listening on http://localhost:8081/
      Hit Ctrl-C to quit.
Paste the URL from this message (eg, http://localhost:8081) into
the address bar of a browser and an interactive rendering will
appear.
- saving Use the
artist'ssave()method to write the rendering to a file. The file type depends on the canvas:- with
canvas="gltf", files are saved in the glTF format with extension.glb:python ... artist.save("model.glb") - with
canvas="plotly", files are saved in to HTML:python ... artist.save("model.html") - with
canvas="matplotlib", files are saved in as PNGs:python ... artist.save("model.png")Note, however, that renderings produced by the"matplotlib"canvas are generally very poor quality. For high quality images, use the"gltf"canvas and take screen captures.
- with
Command Line Interface
To create a rendering, execute the following command from the anaconda prompt (after activating the appropriate environment):
shell
python -m veux model.json -o model.html
where model.json is a JSON file generated from executing the following OpenSees command:
tcl
print -JSON model.json
If you omit the -o <file.html> portion, it will plot immediately in a new
window. You can also use a .png extension to save a static image file, as
opposed to the interactive html.
Note Printing depends on the JSON output of a model. Several materials and elements in the OpenSeesPy and upstream OpenSees implementations do not correctly print to JSON. For the most reliable results, use the
xarapackage for interpreting OpenSees.
By default, the rendering treats the $y$ coordinate as vertical.
In order to manually control this behavior, pass the option
--vert 3 to render model $z$ vertically, or --vert 2 to render model $y$ vertically.
If the opensees package is installed,
you can directly render a Tcl script without first printing to JSON,
by just passing a Tcl script instead of the JSON file:
shell
python -m veux model.tcl -o model.html
To plot an elevation (elev) plan (plan) or section (sect) view, run:
shell
python -m veux model.json --view elev
and add -o <file.extension> as appropriate.
To see the help page run
shell
python -m veux --help
Related Links
The veux packages was used to generate figures for the following publications:
- On nonlinear geometric transformations of finite elements doi: 10.1002/nme.7506
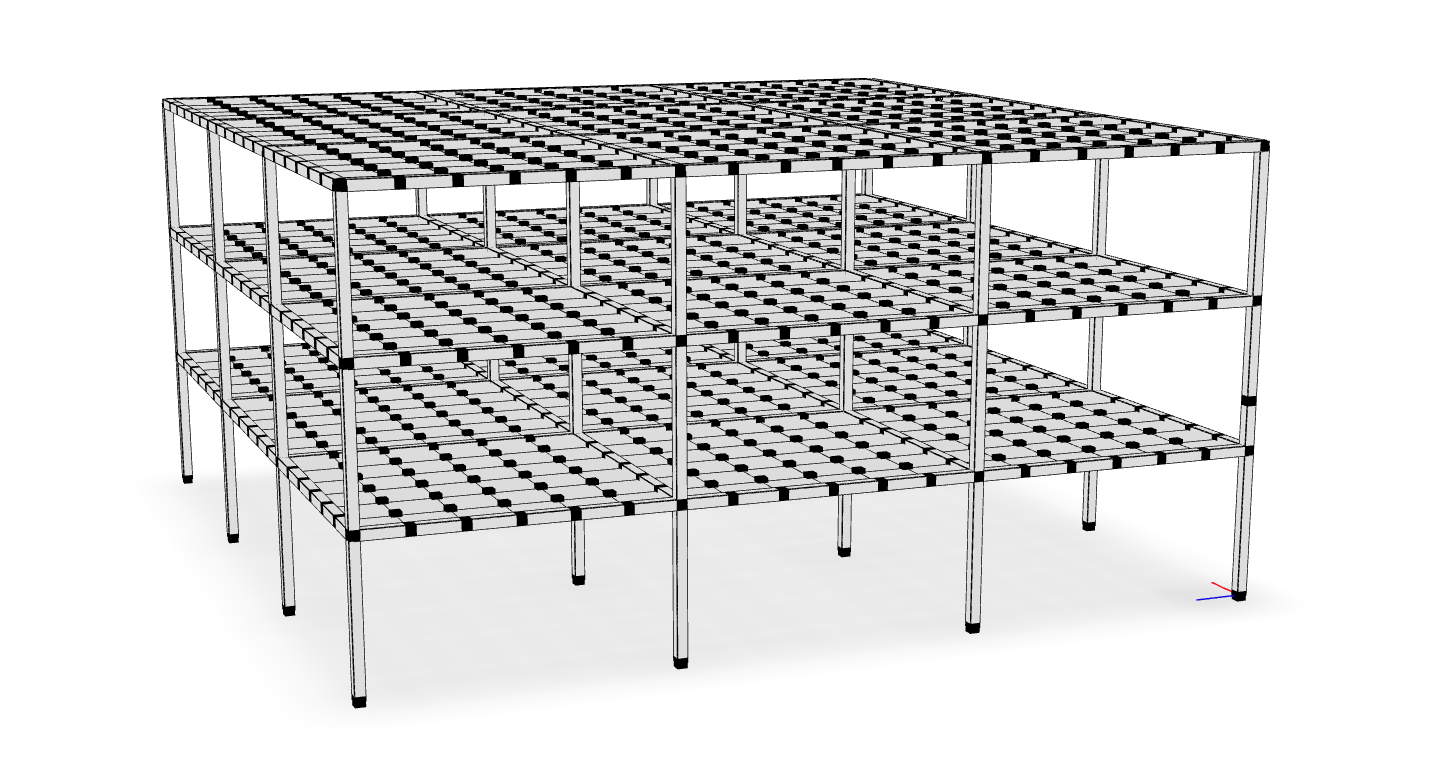
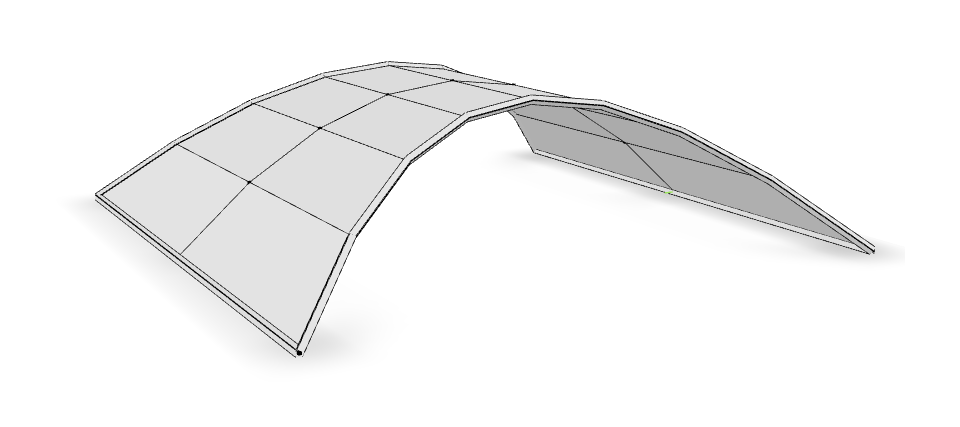
Gallery
| | |
| :---------------: | :---------------: |
|  |
|  |
|
|
|  |
|  |
|
Support

|

|

|
Owner
- Name: STAIRlab
- Login: STAIRlab
- Kind: organization
- Location: Berkeley, CA
- Website: http://stairlab.berkeley.edu
- Repositories: 1
- Profile: https://github.com/STAIRlab
An Active Research Group at the Intersection of AI & SHM
Citation (CITATION.cff)
cff-version: 1.2.0
message: "If you use this software, please cite it as below."
authors:
- family-names: "Perez"
  given-names: "Claudio"
  orcid: "https://orcid.org/0000-0001-8156-2651"
- family-names: "Vouvakis Manousakis"
  given-names: "John"
- family-names: "Mosalam"
  given-names: "Khalid"
  orcid: "https://orcid.org/0000-0003-2988-2361"
title: "veux"
version: 0.0.2
doi: 10.5281/zenodo.13367076
date-released: 2024-07-14
url: "https://veux.io/"
GitHub Events
Total
- Watch event: 6
- Push event: 137
- Pull request event: 20
- Fork event: 6
- Create event: 1
Last Year
- Watch event: 6
- Push event: 137
- Pull request event: 20
- Fork event: 6
- Create event: 1
Issues and Pull Requests
Last synced: 10 months ago
All Time
- Total issues: 0
- Total pull requests: 9
- Average time to close issues: N/A
- Average time to close pull requests: 1 minute
- Total issue authors: 0
- Total pull request authors: 3
- Average comments per issue: 0
- Average comments per pull request: 0.0
- Merged pull requests: 9
- Bot issues: 0
- Bot pull requests: 0
Past Year
- Issues: 0
- Pull requests: 9
- Average time to close issues: N/A
- Average time to close pull requests: 1 minute
- Issue authors: 0
- Pull request authors: 3
- Average comments per issue: 0
- Average comments per pull request: 0.0
- Merged pull requests: 9
- Bot issues: 0
- Bot pull requests: 0
Top Authors
Issue Authors
Pull Request Authors
- claudioperez (7)
- wensley-rushing (2)
- chrystalchern (1)
Top Labels
Issue Labels
Pull Request Labels
Packages
- Total packages: 1
-
Total downloads:
- pypi 1,543 last-month
- Total dependent packages: 0
- Total dependent repositories: 0
- Total versions: 41
- Total maintainers: 2
pypi.org: veux
Fast and friendly finite element visualization for xara and OpenSees/OpenSeesPy.
- Documentation: https://veux.io
-
Latest release: 0.0.40
published 11 months ago
Rankings
Maintainers (2)
Dependencies
- numpy python_version>='3.8'
- numpy < 1.20.0; python_version<'3.8'
- platformdirs *
- prompt_toolkit *
- pygments *
- pyparsing *
- sees *
- actions/checkout v4 composite
- actions/deploy-pages v4 composite
- actions/upload-pages-artifact v3 composite
- ammaraskar/sphinx-action 7.0.0 composite
- pydata-sphinx-theme *
- sphinx *
- veux *