Science Score: 59.0%
This score indicates how likely this project is to be science-related based on various indicators:
-
○CITATION.cff file
-
✓codemeta.json file
Found codemeta.json file -
✓.zenodo.json file
Found .zenodo.json file -
✓DOI references
Found 1 DOI reference(s) in README -
✓Academic publication links
Links to: biorxiv.org -
✓Committers with academic emails
2 of 19 committers (10.5%) from academic institutions -
○Institutional organization owner
-
○JOSS paper metadata
-
○Scientific vocabulary similarity
Low similarity (12.5%) to scientific vocabulary
Keywords from Contributors
Repository
Fast Gene Set Enrichment Analysis
Basic Info
- Host: GitHub
- Owner: alserglab
- License: other
- Language: R
- Default Branch: master
- Size: 3.25 MB
Statistics
- Stars: 408
- Watchers: 19
- Forks: 72
- Open Issues: 12
- Releases: 0
Metadata Files
README.md
![]()
fgsea
fgsea is an R-package for fast preranked gene set enrichment analysis (GSEA). This package allows to quickly and accurately calculate arbitrarily low GSEA P-values for a collection of gene sets. P-value estimation is based on an adaptive multi-level split Monte-Carlo scheme.
See the preprint for algorithmic details.
Full vignette can be found here: http://bioconductor.org/packages/devel/bioc/vignettes/fgsea/inst/doc/fgsea-tutorial.html
Installation
fgsea is a part of R/Bioconductor and is availble on Linux, macOS and Windows platforms. For the installation instructions and more details please refer to https://bioconductor.org/packages/release/bioc/html/fgsea.html
The latest version of fgsea can be installed from GitHub using devtools package, which can take up to a few minutes to install all the dependencies:
{r}
library(devtools)
install_github("ctlab/fgsea")
Quick run
Loading libraries
{r}
library(data.table)
library(fgsea)
library(ggplot2)
Loading example pathways and gene-level statistics:
{r}
data(examplePathways)
data(exampleRanks)
Running fgsea (should take about 10 seconds):
{r}
fgseaRes <- fgsea(pathways = examplePathways,
                  stats    = exampleRanks,
                  minSize  = 15,
                  maxSize  = 500)
The head of resulting table sorted by p-value:
pathway                                 pval   padj   log2err  ES      NES     size
5990979_Cell_Cycle,_Mitotic             1e-10  4e-09  NA       0.5595  2.7437  317
5990980_Cell_Cycle                      1e-10  4e-09  NA       0.5388  2.6876  369
5990981_DNA_Replication                 1e-10  4e-09  NA       0.6440  2.6390  82
5990987_Synthesis_of_DNA                1e-10  4e-09  NA       0.6479  2.6290  78
5990988_S_Phase                         1e-10  4e-09  NA       0.6013  2.5069  98
5990990_G1_S_Transition                 1e-10  4e-09  NA       0.6233  2.5625  84
5990991_Mitotic_G1-G1_S_phases          1e-10  4e-09  NA       0.6285  2.6256  101
5991209_RHO_GTPase_Effectors            1e-10  4e-09  NA       0.5249  2.3712  157
5991454_M_Phase                         1e-10  4e-09  NA       0.5576  2.5491  173
5991502_Mitotic_Metaphase_and_Anaphase  1e-10  4e-09  NA       0.6053  2.6331  123
As you can see fgsea has a default lower bound eps=1e-10 for estimating P-values. If you need to estimate P-value more accurately, you can set the eps argument to zero in the fgsea function.
```{r} fgseaRes <- fgsea(pathways = examplePathways, stats = exampleRanks, eps = 0.0, minSize = 15, maxSize = 500)
head(fgseaRes[order(pval), ]) ```
pathway                                          pval      padj      log2err  ES      NES     size
5990979_Cell_Cycle,_Mitotic                      4.44e-26  1.70e-23  1.3267   0.5595  2.7414  317
5990980_Cell_Cycle                               5.80e-26  1.70e-23  1.3189   0.5388  2.6747  369
5991851_Mitotic_Prometaphase                     8.50e-19  1.66e-16  1.1239   0.7253  2.9674  82
5992217_Resolution_of_Sister_Chromatid_Cohesion  1.50e-17  2.19e-15  1.0769   0.7348  2.9482  74
5991454_M_Phase                                  1.10e-14  1.29e-12  0.9865   0.5576  2.5436  173
5991599_Separation_of_Sister_Chromatids          3.01e-14  2.94e-12  0.9653   0.6165  2.6630  116
One can make an enrichment plot for a pathway: ```{r} plotEnrichment(examplePathways[["5991130ProgrammedCell_Death"]], exampleRanks) + labs(title="Programmed Cell Death")
```

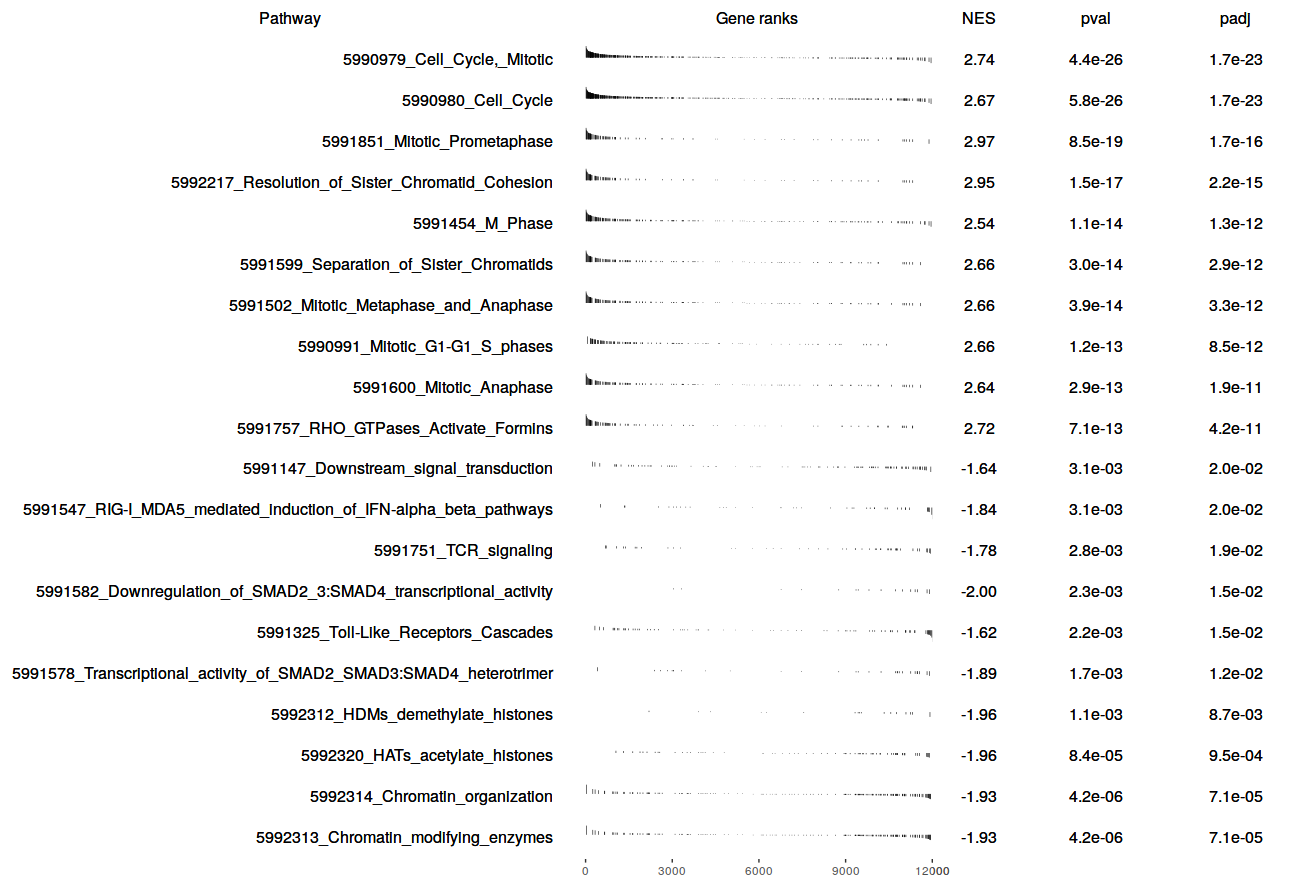
Or make a table plot for a bunch of selected pathways:
{r}
topPathwaysUp <- fgseaRes[ES > 0][head(order(pval), n=10), pathway]
topPathwaysDown <- fgseaRes[ES < 0][head(order(pval), n=10), pathway]
topPathways <- c(topPathwaysUp, rev(topPathwaysDown))
plotGseaTable(examplePathways[topPathways], exampleRanks, fgseaRes,
              gseaParam=0.5)
Owner
- Name: alserglab
- Login: alserglab
- Kind: organization
- Repositories: 1
- Profile: https://github.com/alserglab
GitHub Events
Total
- Issues event: 8
- Watch event: 21
- Issue comment event: 10
- Push event: 21
- Pull request event: 5
- Fork event: 2
- Create event: 3
Last Year
- Issues event: 8
- Watch event: 21
- Issue comment event: 10
- Push event: 21
- Pull request event: 5
- Fork event: 2
- Create event: 3
Committers
Last synced: about 1 year ago
Top Committers
| Name | Commits | |
|---|---|---|
| Alexey Sergushichev | a****x@g****m | 268 |
| Vladimir Sukhov | v****v@y****u | 49 |
| pinguinson | n****n@g****m | 15 |
| Nitesh Turaga | n****a@g****m | 14 |
| J Wokaty | j****y@s****u | 10 |
| markziemann | m****n@g****m | 5 |
| Herve Pages | h****s@f****g | 4 |
| Enrique Toledo M | T****M | 3 |
| Hervé Pagès | h****s@f****g | 2 |
| vobencha | v****a@g****m | 2 |
| A Wokaty | a****y@s****u | 2 |
| vobencha | v****n@r****g | 2 |
| Chris Middleton | c****n@g****m | 1 |
| Darío Hereñú | m****a@g****m | 1 |
| Lluís | l****s | 1 |
| Alon Shaiber | a****r@i****m | 1 |
| Martin Morgan | m****n@f****g | 1 |
| Gusak Nikita | G****a | 1 |
| BudAlNik | b****7@g****m | 1 |
Committer Domains (Top 20 + Academic)
Dependencies
- R >= 3.3 depends
- BiocParallel * imports
- Matrix * imports
- Rcpp * imports
- cowplot * imports
- data.table * imports
- fastmatch * imports
- ggplot2 >= 2.2.0 imports
- grid * imports
- stats * imports
- utils * imports
- AnnotationDbi * suggests
- GEOquery * suggests
- aggregation * suggests
- knitr * suggests
- limma * suggests
- msigdbr * suggests
- org.Mm.eg.db * suggests
- parallel * suggests
- reactome.db * suggests
- rmarkdown * suggests
- testthat * suggests