director
Bioconductor R package for visualizing multi-level molecular data
Science Score: 23.0%
This score indicates how likely this project is to be science-related based on various indicators:
-
○CITATION.cff file
-
○codemeta.json file
-
○.zenodo.json file
-
✓DOI references
Found 1 DOI reference(s) in README -
✓Academic publication links
Links to: sciencedirect.com -
○Committers with academic emails
-
○Institutional organization owner
-
○JOSS paper metadata
-
○Scientific vocabulary similarity
Low similarity (8.9%) to scientific vocabulary
Keywords from Contributors
bioconductor-package
bioinformatics
core-package
annotation-agnostic
count
derfinder
deseq2
exon
human
illumina
Last synced: 10 months ago
·
JSON representation
Repository
Bioconductor R package for visualizing multi-level molecular data
Basic Info
- Host: GitHub
- Owner: kzouchka
- License: other
- Language: R
- Default Branch: master
- Size: 460 KB
Statistics
- Stars: 0
- Watchers: 1
- Forks: 0
- Open Issues: 0
- Releases: 0
Created over 8 years ago
· Last pushed over 5 years ago
https://github.com/kzouchka/Director/blob/master/
# Director Director is an R package designed to streamline the visualization of multiple levels of interacting biological data. It utilizes the R package htmltools and customized Sankey plugin of the JavaScript library D3 (http://d3js.org) to provide an alternative to standard network visualization of biological networks. It is a fast and easy browser-enabled solution to discovering potentially interesting downstream effects or regulatory pathways. The diagrams are dynamic, interactive, and packaged as HTML files, making them highly portable and eliminating the need for third-party software. This enables a straightforward approach for scientists to interpret the data produced, and bioinformatics developers an alternative means to present relevant data. 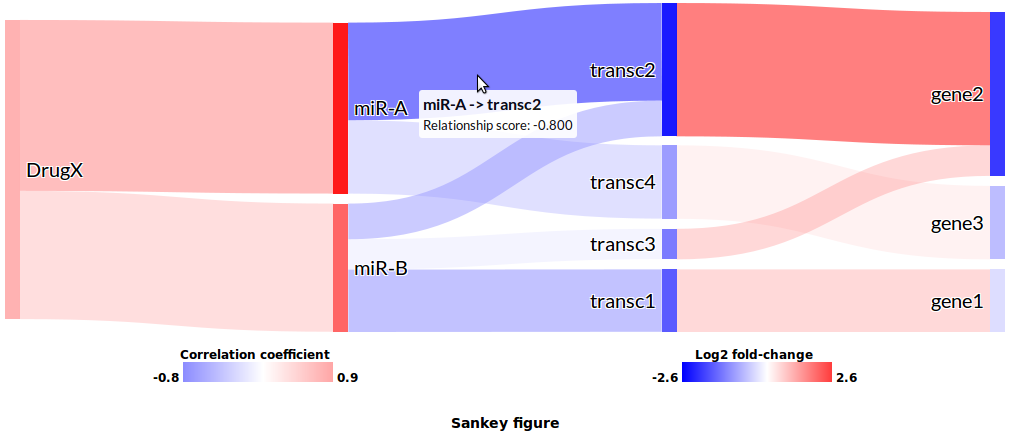 ## How it works Two types of quantitive information are all that's needed to render the diagram: values for nodes and values for paths. The package assumes nodes are molecules of interest and that the quantitative value is the feature which makes them interesting, e.g. expression fold-change, significance value, or methylation score. Similarly, paths represent a predictive or quantitative measure of the interaction between molecules (e.g. correlation, affinity score). Quantitative values are used to render the diagram. Molecules with strong quantitative values, multiple and strong interactions are automatically emphasized in the diagram. A connected series of such molecules would, in turn, identify potentially interesting regulatory cascades -- visual information not as easily nor intuitively conveyed with standard network approaches. ## Get it Package installation instructions for R are found on [http://kzouchka.github.io/Director/](http://kzouchka.github.io/Director/) ## How to cite Icay, K. and Liu, C. and Hautaniemi, S. (2018) Dynamic visualization of multi-level molecular data: The Director package in R Comput Methods Programs Biomed 153: 129--136 10.1016/j.cmpb.2017.10.013 [https://www.sciencedirect.com/science/article/pii/S0169260716306964]
Owner
- Name: Katherine Icay-Rouhiainen
- Login: kzouchka
- Kind: user
- Repositories: 1
- Profile: https://github.com/kzouchka
GitHub Events
Total
Last Year
Committers
Last synced: over 2 years ago
Top Committers
| Name | Commits | |
|---|---|---|
| Katherine Icay-Rouhiainen | k****n@y****i | 7 |
| Nitesh Turaga | n****a@g****m | 6 |
| Katherine Icay | k****y@g****m | 6 |
| Herve Pages | h****s@f****g | 5 |
| Katherine Icay | k****y@h****i | 2 |
| vobencha | v****n@r****g | 2 |
| vobencha | v****a@g****m | 2 |
| Hervé Pagès | h****s@f****g | 2 |
| Martin Morgan | m****n@f****g | 1 |
| Katherine Icay-Rouhiainen | k****a | 1 |
Committer Domains (Top 20 + Academic)
Issues and Pull Requests
Last synced: 11 months ago
All Time
- Total issues: 0
- Total pull requests: 0
- Average time to close issues: N/A
- Average time to close pull requests: N/A
- Total issue authors: 0
- Total pull request authors: 0
- Average comments per issue: 0
- Average comments per pull request: 0
- Merged pull requests: 0
- Bot issues: 0
- Bot pull requests: 0
Past Year
- Issues: 0
- Pull requests: 0
- Average time to close issues: N/A
- Average time to close pull requests: N/A
- Issue authors: 0
- Pull request authors: 0
- Average comments per issue: 0
- Average comments per pull request: 0
- Merged pull requests: 0
- Bot issues: 0
- Bot pull requests: 0