Science Score: 23.0%
This score indicates how likely this project is to be science-related based on various indicators:
-
○CITATION.cff file
-
✓codemeta.json file
Found codemeta.json file -
○.zenodo.json file
-
○DOI references
-
✓Academic publication links
Links to: zenodo.org -
○Committers with academic emails
-
○Institutional organization owner
-
○JOSS paper metadata
-
○Scientific vocabulary similarity
Low similarity (13.7%) to scientific vocabulary
Keywords
ammi
ammi-model
biplots
gge
hmrpgv
mgidi
mtsi
rpgv
stability
waas
waasb
Last synced: 11 months ago
·
JSON representation
Repository
Package for multi-environment trial analysis
Basic Info
- Host: GitHub
- Owner: TiagoOlivoto
- License: gpl-3.0
- Language: R
- Default Branch: master
- Homepage: https://tiagoolivoto.github.io/metan/
- Size: 415 MB
Statistics
- Stars: 31
- Watchers: 1
- Forks: 17
- Open Issues: 0
- Releases: 20
Topics
ammi
ammi-model
biplots
gge
hmrpgv
mgidi
mtsi
rpgv
stability
waas
waasb
Created over 8 years ago
· Last pushed over 2 years ago
Metadata Files
Readme
Contributing
License
Code of conduct
Support
README.Rmd
---
always_allow_html: yes
output: github_document
---
```{r, echo = FALSE}
knitr::opts_chunk$set(
collapse = TRUE,
comment = "#",
fig.path = "man/figures/README-"
)
```
# metan  [](https://CRAN.R-project.org/package=metan) [](https://lifecycle.r-lib.org/articles/stages.html#stable-1)

[](https://r-pkg.org/pkg/metan)
[](https://r-pkg.org/pkg/metan)
[](https://r-pkg.org/pkg/metan)
[
[](https://CRAN.R-project.org/package=metan) [](https://lifecycle.r-lib.org/articles/stages.html#stable-1)

[](https://r-pkg.org/pkg/metan)
[](https://r-pkg.org/pkg/metan)
[](https://r-pkg.org/pkg/metan)
[ ](https://zenodo.org/badge/latestdoi/130062661)
`metan` (**m**ulti-**e**nvironment **t**rials **an**alysis) provides useful functions for analyzing multi-environment trial data using parametric and non-parametric methods. The package will help you to:
- [Inspect](https://tiagoolivoto.github.io/metan/reference/inspect.html) data for possible common errors;
- Manipulate [rows and columns](https://tiagoolivoto.github.io/metan/reference/utils_rows_cols.html);
- Manipulate [numbers and strings](https://tiagoolivoto.github.io/metan/reference/utils_num_str.html);
- Manipulate [`NA`s and `0`s](https://tiagoolivoto.github.io/metan/reference/utils_na_zero.html);
- Compute [descriptive statistics](https://tiagoolivoto.github.io/metan/reference/desc_stat.html);
- Compute [within-environment](https://tiagoolivoto.github.io/metan/reference/anova_ind.html) and [joint-analysis of variance](https://tiagoolivoto.github.io/metan/reference/anova_joint.html);
- Compute [AMMI analysis](https://tiagoolivoto.github.io/metan/reference/performs_ammi.html) with prediction considering different numbers of interaction principal component axes;
- Compute [AMMI-based stability indexes](https://tiagoolivoto.github.io/metan/reference/ammi_indexes.html);
- Compute [GGE biplot analysis](https://tiagoolivoto.github.io/metan/reference/gge.html);
- Compute [GT](https://tiagoolivoto.github.io/metan/reference/gtb.html) and [GYT](https://tiagoolivoto.github.io/metan/reference/gytb.html) biplot analysis;
- Compute [BLUP-based stability indexes](https://tiagoolivoto.github.io/metan/reference/blup_indexes.html);
- Compute variance components and genetic parameters in [single environment](https://tiagoolivoto.github.io/metan/reference/gamem.html) and [multi-environment](https://tiagoolivoto.github.io/metan/reference/gamem_met.html) trials using mixed-effect models;
- Perform cross-validation procedures for [AMMI-family](https://tiagoolivoto.github.io/metan/reference/cv_ammif.html) and [BLUP](https://tiagoolivoto.github.io/metan/reference/cv_blup.html) models;
- Compute parametric and nonparametric [stability statistics](https://tiagoolivoto.github.io/metan/reference/ge_stats.html);
- Implement [biometrical models](https://tiagoolivoto.github.io/metan/reference/index.html#section-biometry).
# Installation
Install the released version of `metan` from [CRAN](https://CRAN.R-project.org/package=metan) with:
```{r, eval=FALSE}
install.packages("metan")
```
Or install the development version from [GitHub](https://github.com/TiagoOlivoto/metan) with:
```{r, eval=FALSE}
devtools::install_github("TiagoOlivoto/metan")
# To build the HTML vignette use
devtools::install_github("TiagoOlivoto/metan", build_vignettes = TRUE)
```
*Note*: If you are a Windows user, you should also first download and install the latest version of [Rtools](https://cran.r-project.org/bin/windows/Rtools/).
For the latest release notes on this development version, see the [NEWS file](https://tiagoolivoto.github.io/metan/news/index.html).
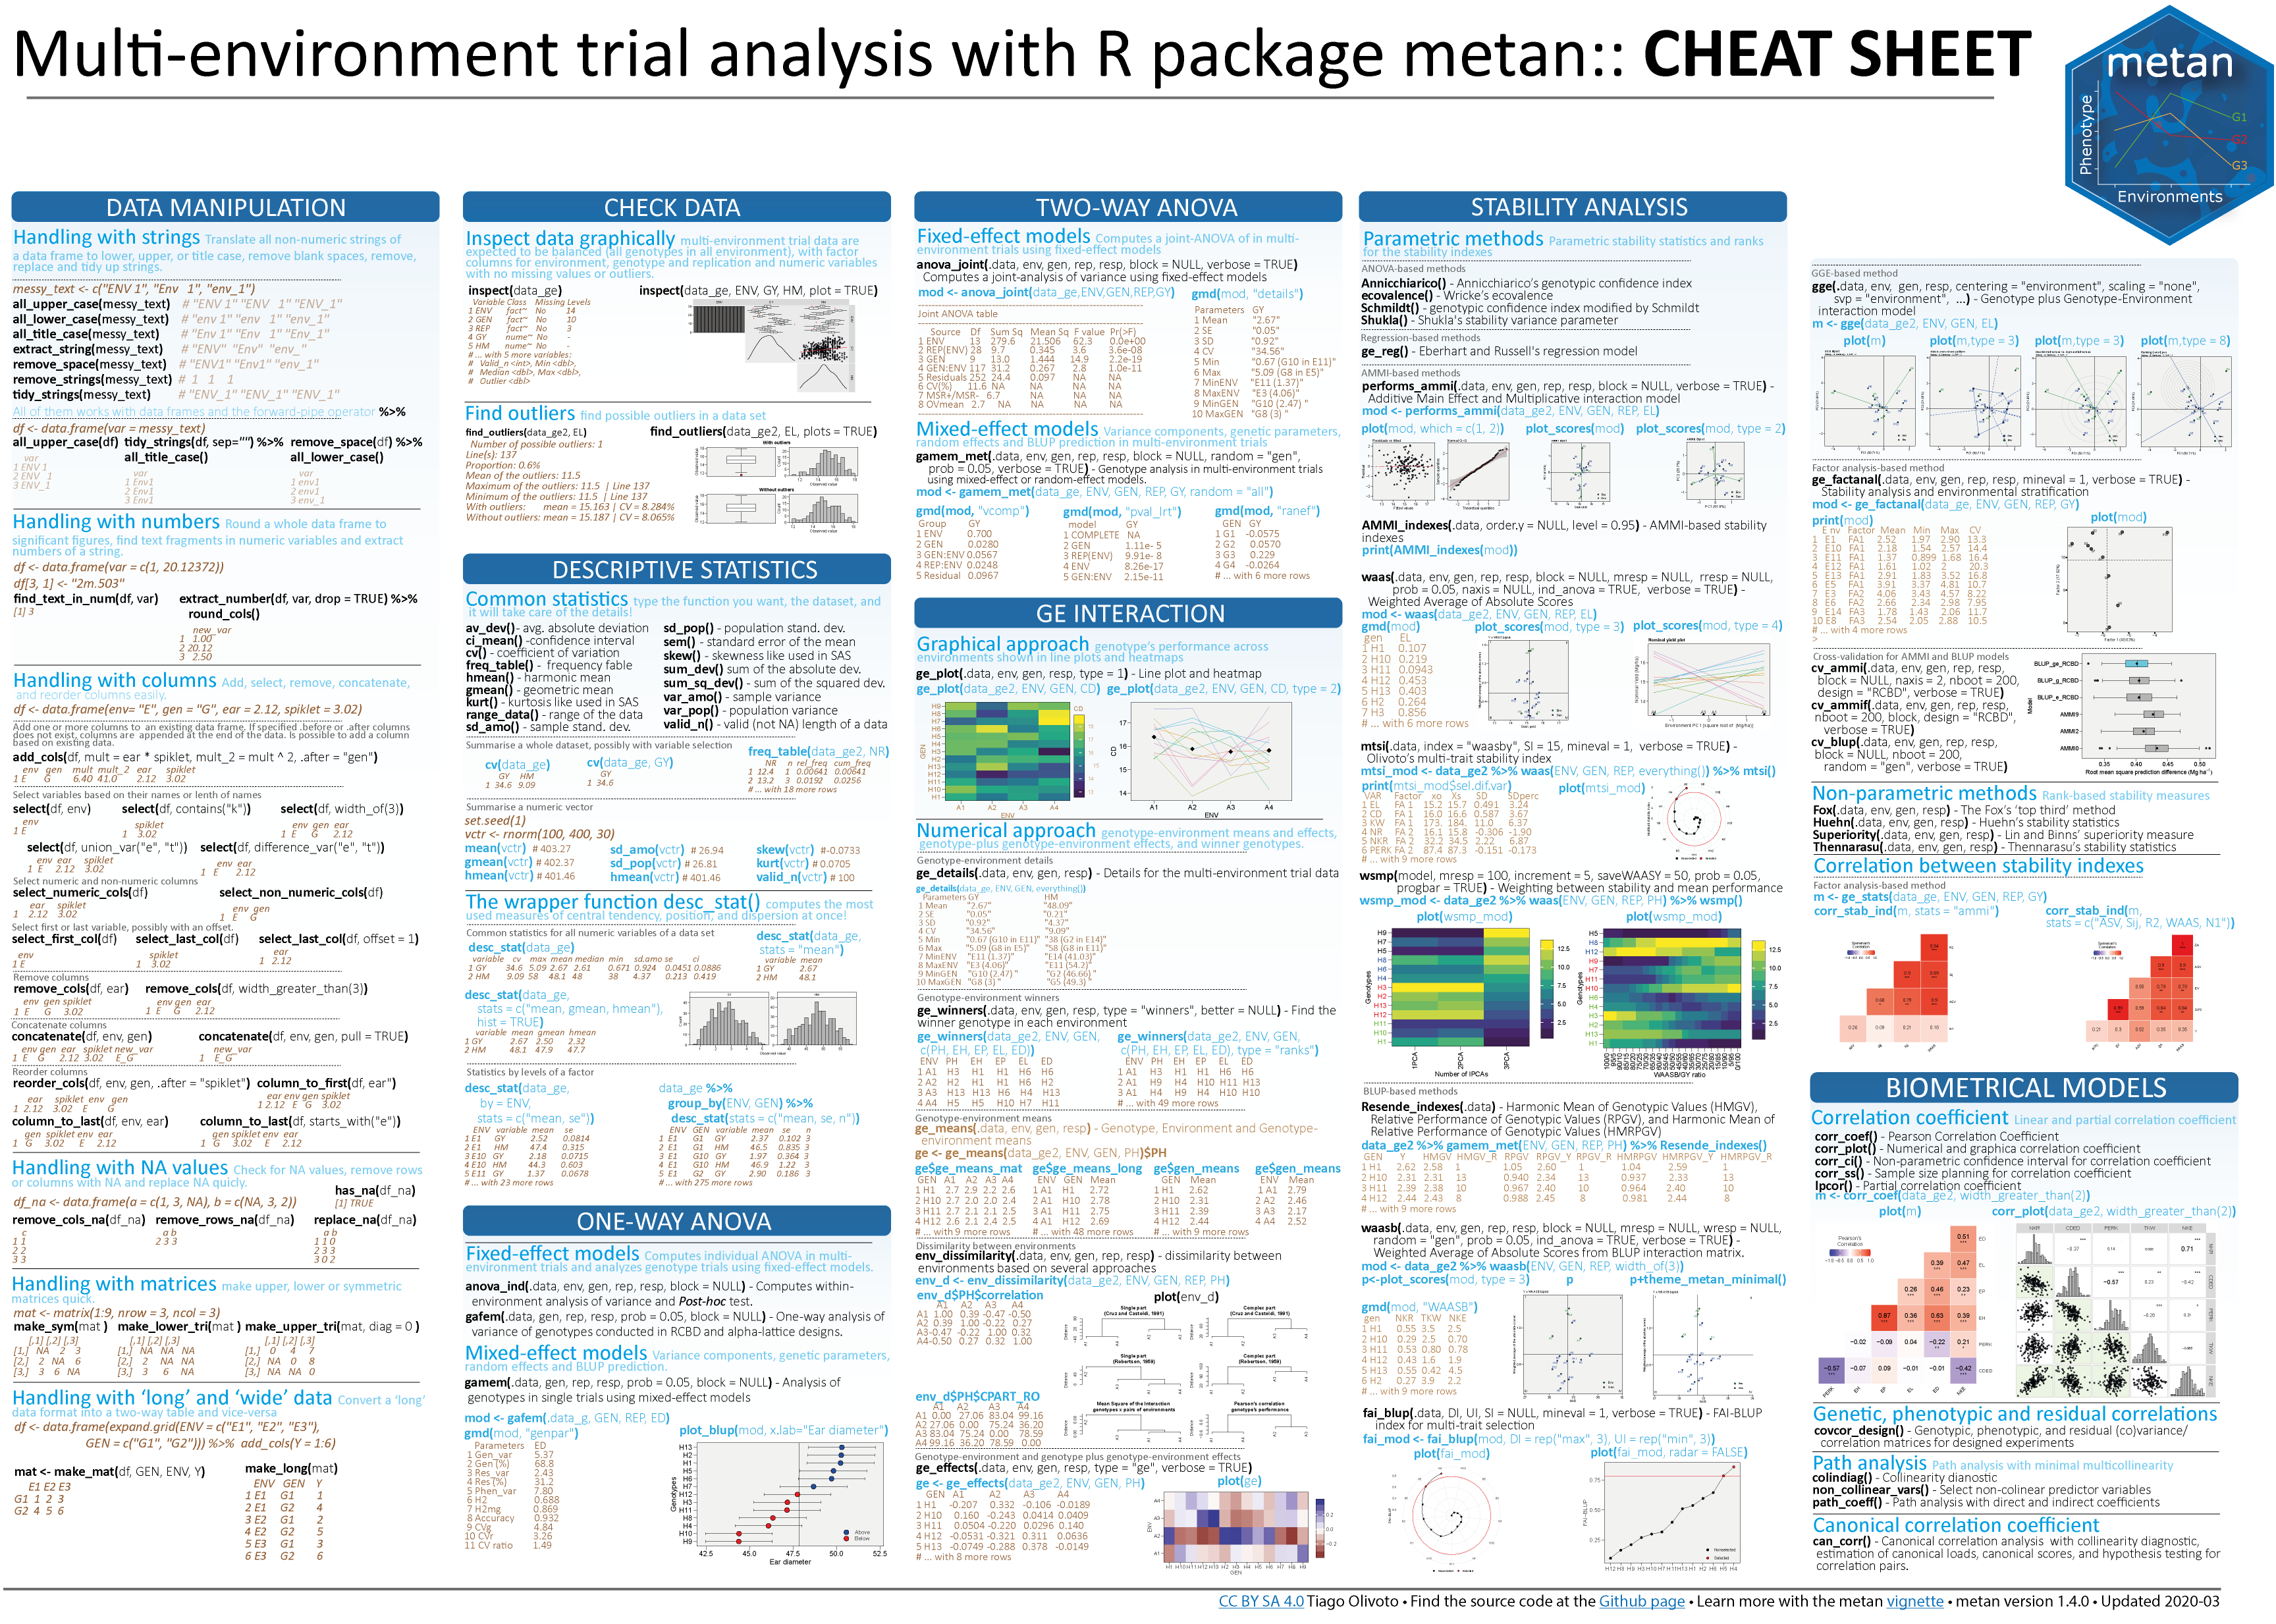
## Cheatsheet
](https://zenodo.org/badge/latestdoi/130062661)
`metan` (**m**ulti-**e**nvironment **t**rials **an**alysis) provides useful functions for analyzing multi-environment trial data using parametric and non-parametric methods. The package will help you to:
- [Inspect](https://tiagoolivoto.github.io/metan/reference/inspect.html) data for possible common errors;
- Manipulate [rows and columns](https://tiagoolivoto.github.io/metan/reference/utils_rows_cols.html);
- Manipulate [numbers and strings](https://tiagoolivoto.github.io/metan/reference/utils_num_str.html);
- Manipulate [`NA`s and `0`s](https://tiagoolivoto.github.io/metan/reference/utils_na_zero.html);
- Compute [descriptive statistics](https://tiagoolivoto.github.io/metan/reference/desc_stat.html);
- Compute [within-environment](https://tiagoolivoto.github.io/metan/reference/anova_ind.html) and [joint-analysis of variance](https://tiagoolivoto.github.io/metan/reference/anova_joint.html);
- Compute [AMMI analysis](https://tiagoolivoto.github.io/metan/reference/performs_ammi.html) with prediction considering different numbers of interaction principal component axes;
- Compute [AMMI-based stability indexes](https://tiagoolivoto.github.io/metan/reference/ammi_indexes.html);
- Compute [GGE biplot analysis](https://tiagoolivoto.github.io/metan/reference/gge.html);
- Compute [GT](https://tiagoolivoto.github.io/metan/reference/gtb.html) and [GYT](https://tiagoolivoto.github.io/metan/reference/gytb.html) biplot analysis;
- Compute [BLUP-based stability indexes](https://tiagoolivoto.github.io/metan/reference/blup_indexes.html);
- Compute variance components and genetic parameters in [single environment](https://tiagoolivoto.github.io/metan/reference/gamem.html) and [multi-environment](https://tiagoolivoto.github.io/metan/reference/gamem_met.html) trials using mixed-effect models;
- Perform cross-validation procedures for [AMMI-family](https://tiagoolivoto.github.io/metan/reference/cv_ammif.html) and [BLUP](https://tiagoolivoto.github.io/metan/reference/cv_blup.html) models;
- Compute parametric and nonparametric [stability statistics](https://tiagoolivoto.github.io/metan/reference/ge_stats.html);
- Implement [biometrical models](https://tiagoolivoto.github.io/metan/reference/index.html#section-biometry).
# Installation
Install the released version of `metan` from [CRAN](https://CRAN.R-project.org/package=metan) with:
```{r, eval=FALSE}
install.packages("metan")
```
Or install the development version from [GitHub](https://github.com/TiagoOlivoto/metan) with:
```{r, eval=FALSE}
devtools::install_github("TiagoOlivoto/metan")
# To build the HTML vignette use
devtools::install_github("TiagoOlivoto/metan", build_vignettes = TRUE)
```
*Note*: If you are a Windows user, you should also first download and install the latest version of [Rtools](https://cran.r-project.org/bin/windows/Rtools/).
For the latest release notes on this development version, see the [NEWS file](https://tiagoolivoto.github.io/metan/news/index.html).
## Cheatsheet
 # Getting started
`metan` offers a set of functions that can be used to manipulate, summarize, analyze and plot typical multi-environment trial data. Maybe, one of the first functions users should use would be [`inspect()`](https://tiagoolivoto.github.io/metan/reference/inspect.html). Here, we will inspect the example dataset `data_ge` that contains data on two variables assessed in 10 genotypes growing in 14 environments.
```{r INSPECT, fig.width=7, fig.height=7, fig.align="center", message=FALSE, warning=FALSE}
library(metan)
inspect(data_ge, plot = TRUE)
```
No issues while inspecting the data. If any issue is given here (like outliers, missing values, etc.) consider using [`find_outliers()`](https://tiagoolivoto.github.io/metan/reference/find_outliers.html) to find possible outliers in the data set or any `metan`'s data manipulation tool such as [remove_rows_na()](https://tiagoolivoto.github.io/metan/reference/utils_na_zero.html) to remove rows with `NA` values, [replace_zero()](https://tiagoolivoto.github.io/metan/reference/utils_na_zero.html) to replace 0's with `NA`, [as_factor()](https://tiagoolivoto.github.io/metan/reference/utils_as.html) to convert desired columns to factor, [`find_text_in_num()`](https://tiagoolivoto.github.io/metan/reference/utils_num_str.html) to find text fragments in columns assumed to be numeric, or even [`tidy_strings()`](https://tiagoolivoto.github.io/metan/reference/utils_num_str.html) to tidy up strings.
# Descriptive statistics
`metan` provides [a set of functions](https://tiagoolivoto.github.io/metan/reference/utils_stats.html) to compute descriptive statistics. The easiest way to do that is by using [`desc_stat()`](https://tiagoolivoto.github.io/metan/reference/desc_stat.html).
```{r}
desc_stat(data_ge2)
```
# AMMI model
## Fitting the model
The AMMI model is fitted with the function [`performs_ammi()`](https://tiagoolivoto.github.io/metan/reference/performs_ammi.html). To analyze multiple variables at once we can use a comma-separated vector of unquoted variable names, or use any select helper in the argument `resp`. Here, using `everything()` we apply the function to all numeric variables in the data. For more details, see the [complete vignette](https://tiagoolivoto.github.io/metan/articles/vignettes_ammi.html).
```{r}
model <- performs_ammi(data_ge,
env = ENV,
gen = GEN,
rep = REP,
resp = everything(),
verbose = FALSE)
# Significance of IPCAs
get_model_data(model, "ipca_pval")
```
## Biplots
The well-known AMMI1 and AMMI2 biplots can be created with [`plot_scores()`](file:///D:/Desktop/metan/docs/reference/plot_scores.html). Note that since [`performs_ammi`](https://tiagoolivoto.github.io/metan/reference/performs_ammi.html) allows analyzing multiple variables at once, e.g., `resp = c(v1, v2, ...)`, the output `model` is a list, in this case with two elements (GY and HM). By default, the biplots are created for the first variable of the model. To choose another variable use the argument `var` (e.g., `var = "HM"`).
```{r AMMI, fig.width=10, fig.height=5, message=FALSE, warning=FALSE}
a <- plot_scores(model)
b <- plot_scores(model,
type = 2, # AMMI 2 biplot
polygon = TRUE, # show a polygon
highlight = c("G4", "G5", "G6"), #highlight genotypes
col.alpha.env = 0.5, # alpha for environments
col.alpha.gen = 0, # remove the other genotypes
col.env = "gray", # color for environment point
col.segm.env = "gray", # color for environment segment
plot_theme = theme_metan_minimal()) # theme
arrange_ggplot(a, b, tag_levels = "a")
```
# GGE model
The GGE model is fitted with the function [`gge()`](https://tiagoolivoto.github.io/metan/reference/gge.html). For more details, see the [complete vignette](https://tiagoolivoto.github.io/metan/articles/vignettes_gge.html).
```{r GGE, fig.width=15, fig.height=5, message=FALSE, warning=FALSE}
model <- gge(data_ge, ENV, GEN, GY)
model2 <- gge(data_ge, ENV, GEN, GY, svp = "genotype")
model3 <- gge(data_ge, ENV, GEN, GY, svp = "symmetrical")
a <- plot(model)
b <- plot(model2, type = 8)
c <- plot(model2,
type = 2,
col.gen = "black",
col.env = "gray70",
axis.expand = 1.5,
plot_theme = theme_metan_minimal())
arrange_ggplot(a, b, c, tag_levels = "a")
```
# BLUP model
Linear-mixed effect models to predict the response variable in METs are fitted using the function [gamem_met()](https://tiagoolivoto.github.io/metan/reference/gamem_met.html). Here we will obtain the predicted means for genotypes in the variables `GY` and `HM`. For more details, see the [complete vignette](https://tiagoolivoto.github.io/metan/articles/vignettes_blup.html).
```{r }
model2 <-
gamem_met(data_ge,
env = ENV,
gen = GEN,
rep = REP,
resp = everything())
# Get the variance components
get_model_data(model2, what = "vcomp")
```
## Plotting the BLUPs for genotypes
To produce a plot with the predicted means, use the function [`plot_blup()`](https://tiagoolivoto.github.io/metan/reference/plot_blup.html).
```{r BLUP, fig.width=10, fig.height=5, message=FALSE, warning=FALSE}
a <- plot_blup(model2)
b <- plot_blup(model2,
prob = 0.2,
col.shape = c("gray20", "gray80"),
invert = TRUE)
arrange_ggplot(a, b, tag_levels = "a")
```
# Computing parametric and non-parametric stability indexes
The easiest way to compute parametric and non-parametric stability indexes in `metan` is by using the function [`ge_stats()`](https://tiagoolivoto.github.io/metan/reference/ge_stats.html). It is a wrapper function around a lot of specific functions for stability indexes. To get the results into a *"ready-to-read"* file, use [get_model_data()](https://tiagoolivoto.github.io/metan/reference/get_model_data.html) or its shortcut [`gmd()`](https://tiagoolivoto.github.io/metan/reference/get_model_data.html).
```{r}
stats <- ge_stats(data_ge, ENV, GEN, REP, GY)
get_model_data(stats)
```
# Citation
```{r, comment=""}
citation("metan")
```
# Getting help
- If you encounter a clear bug, please file a minimal reproducible example on [github](https://github.com/TiagoOlivoto/metan/issues)
- Suggestions and criticisms to improve the quality and usability of the package are welcome!
# Getting started
`metan` offers a set of functions that can be used to manipulate, summarize, analyze and plot typical multi-environment trial data. Maybe, one of the first functions users should use would be [`inspect()`](https://tiagoolivoto.github.io/metan/reference/inspect.html). Here, we will inspect the example dataset `data_ge` that contains data on two variables assessed in 10 genotypes growing in 14 environments.
```{r INSPECT, fig.width=7, fig.height=7, fig.align="center", message=FALSE, warning=FALSE}
library(metan)
inspect(data_ge, plot = TRUE)
```
No issues while inspecting the data. If any issue is given here (like outliers, missing values, etc.) consider using [`find_outliers()`](https://tiagoolivoto.github.io/metan/reference/find_outliers.html) to find possible outliers in the data set or any `metan`'s data manipulation tool such as [remove_rows_na()](https://tiagoolivoto.github.io/metan/reference/utils_na_zero.html) to remove rows with `NA` values, [replace_zero()](https://tiagoolivoto.github.io/metan/reference/utils_na_zero.html) to replace 0's with `NA`, [as_factor()](https://tiagoolivoto.github.io/metan/reference/utils_as.html) to convert desired columns to factor, [`find_text_in_num()`](https://tiagoolivoto.github.io/metan/reference/utils_num_str.html) to find text fragments in columns assumed to be numeric, or even [`tidy_strings()`](https://tiagoolivoto.github.io/metan/reference/utils_num_str.html) to tidy up strings.
# Descriptive statistics
`metan` provides [a set of functions](https://tiagoolivoto.github.io/metan/reference/utils_stats.html) to compute descriptive statistics. The easiest way to do that is by using [`desc_stat()`](https://tiagoolivoto.github.io/metan/reference/desc_stat.html).
```{r}
desc_stat(data_ge2)
```
# AMMI model
## Fitting the model
The AMMI model is fitted with the function [`performs_ammi()`](https://tiagoolivoto.github.io/metan/reference/performs_ammi.html). To analyze multiple variables at once we can use a comma-separated vector of unquoted variable names, or use any select helper in the argument `resp`. Here, using `everything()` we apply the function to all numeric variables in the data. For more details, see the [complete vignette](https://tiagoolivoto.github.io/metan/articles/vignettes_ammi.html).
```{r}
model <- performs_ammi(data_ge,
env = ENV,
gen = GEN,
rep = REP,
resp = everything(),
verbose = FALSE)
# Significance of IPCAs
get_model_data(model, "ipca_pval")
```
## Biplots
The well-known AMMI1 and AMMI2 biplots can be created with [`plot_scores()`](file:///D:/Desktop/metan/docs/reference/plot_scores.html). Note that since [`performs_ammi`](https://tiagoolivoto.github.io/metan/reference/performs_ammi.html) allows analyzing multiple variables at once, e.g., `resp = c(v1, v2, ...)`, the output `model` is a list, in this case with two elements (GY and HM). By default, the biplots are created for the first variable of the model. To choose another variable use the argument `var` (e.g., `var = "HM"`).
```{r AMMI, fig.width=10, fig.height=5, message=FALSE, warning=FALSE}
a <- plot_scores(model)
b <- plot_scores(model,
type = 2, # AMMI 2 biplot
polygon = TRUE, # show a polygon
highlight = c("G4", "G5", "G6"), #highlight genotypes
col.alpha.env = 0.5, # alpha for environments
col.alpha.gen = 0, # remove the other genotypes
col.env = "gray", # color for environment point
col.segm.env = "gray", # color for environment segment
plot_theme = theme_metan_minimal()) # theme
arrange_ggplot(a, b, tag_levels = "a")
```
# GGE model
The GGE model is fitted with the function [`gge()`](https://tiagoolivoto.github.io/metan/reference/gge.html). For more details, see the [complete vignette](https://tiagoolivoto.github.io/metan/articles/vignettes_gge.html).
```{r GGE, fig.width=15, fig.height=5, message=FALSE, warning=FALSE}
model <- gge(data_ge, ENV, GEN, GY)
model2 <- gge(data_ge, ENV, GEN, GY, svp = "genotype")
model3 <- gge(data_ge, ENV, GEN, GY, svp = "symmetrical")
a <- plot(model)
b <- plot(model2, type = 8)
c <- plot(model2,
type = 2,
col.gen = "black",
col.env = "gray70",
axis.expand = 1.5,
plot_theme = theme_metan_minimal())
arrange_ggplot(a, b, c, tag_levels = "a")
```
# BLUP model
Linear-mixed effect models to predict the response variable in METs are fitted using the function [gamem_met()](https://tiagoolivoto.github.io/metan/reference/gamem_met.html). Here we will obtain the predicted means for genotypes in the variables `GY` and `HM`. For more details, see the [complete vignette](https://tiagoolivoto.github.io/metan/articles/vignettes_blup.html).
```{r }
model2 <-
gamem_met(data_ge,
env = ENV,
gen = GEN,
rep = REP,
resp = everything())
# Get the variance components
get_model_data(model2, what = "vcomp")
```
## Plotting the BLUPs for genotypes
To produce a plot with the predicted means, use the function [`plot_blup()`](https://tiagoolivoto.github.io/metan/reference/plot_blup.html).
```{r BLUP, fig.width=10, fig.height=5, message=FALSE, warning=FALSE}
a <- plot_blup(model2)
b <- plot_blup(model2,
prob = 0.2,
col.shape = c("gray20", "gray80"),
invert = TRUE)
arrange_ggplot(a, b, tag_levels = "a")
```
# Computing parametric and non-parametric stability indexes
The easiest way to compute parametric and non-parametric stability indexes in `metan` is by using the function [`ge_stats()`](https://tiagoolivoto.github.io/metan/reference/ge_stats.html). It is a wrapper function around a lot of specific functions for stability indexes. To get the results into a *"ready-to-read"* file, use [get_model_data()](https://tiagoolivoto.github.io/metan/reference/get_model_data.html) or its shortcut [`gmd()`](https://tiagoolivoto.github.io/metan/reference/get_model_data.html).
```{r}
stats <- ge_stats(data_ge, ENV, GEN, REP, GY)
get_model_data(stats)
```
# Citation
```{r, comment=""}
citation("metan")
```
# Getting help
- If you encounter a clear bug, please file a minimal reproducible example on [github](https://github.com/TiagoOlivoto/metan/issues)
- Suggestions and criticisms to improve the quality and usability of the package are welcome!
Owner
- Login: TiagoOlivoto
- Kind: user
- Repositories: 8
- Profile: https://github.com/TiagoOlivoto
GitHub Events
Total
- Watch event: 2
- Push event: 1
Last Year
- Watch event: 2
- Push event: 1
Committers
Last synced: almost 3 years ago
Top Committers
| Name | Commits | |
|---|---|---|
| TiagoOlivoto | t****o@g****m | 2,376 |
| TiagoOlivoto | 3****o | 89 |
| Bartosz Kozak | k****3@g****m | 1 |
Issues and Pull Requests
Last synced: over 1 year ago
All Time
- Total issues: 24
- Total pull requests: 2
- Average time to close issues: 5 days
- Average time to close pull requests: about 1 month
- Total issue authors: 16
- Total pull request authors: 2
- Average comments per issue: 2.17
- Average comments per pull request: 1.0
- Merged pull requests: 2
- Bot issues: 0
- Bot pull requests: 0
Past Year
- Issues: 2
- Pull requests: 1
- Average time to close issues: 18 days
- Average time to close pull requests: 2 months
- Issue authors: 2
- Pull request authors: 1
- Average comments per issue: 0.5
- Average comments per pull request: 0.0
- Merged pull requests: 1
- Bot issues: 0
- Bot pull requests: 0
Top Authors
Issue Authors
- nivelive (4)
- myaseen208 (3)
- drschowdary (3)
- TiagoOlivoto (2)
- shahbazahmed108 (1)
- sazzadbrri (1)
- Censkey (1)
- WheatSopka (1)
- Shekhar-789 (1)
- HaroldCh14 (1)
- jcberny (1)
- billh2006 (1)
- rameshram96 (1)
- chabrault (1)
- awkena (1)
Pull Request Authors
- olivroy (2)
- bartosz-kozak (1)
Top Labels
Issue Labels
Pull Request Labels
Dependencies
DESCRIPTION
cran
- R >= 4.1.0 depends
- GGally * imports
- dplyr >= 1.0.0 imports
- ggforce * imports
- ggplot2 >= 3.3.0 imports
- ggrepel * imports
- lme4 * imports
- lmerTest * imports
- magrittr * imports
- mathjaxr * imports
- methods * imports
- patchwork * imports
- purrr * imports
- rlang >= 0.4.11 imports
- tibble * imports
- tidyr * imports
- tidyselect >= 1.0.0 imports
- DT * suggests
- knitr * suggests
- rmarkdown * suggests
- roxygen2 * suggests
- rstudioapi * suggests