guiqwt
Efficient 2D plotting Python library based on PythonQwt
Science Score: 13.0%
This score indicates how likely this project is to be science-related based on various indicators:
-
○CITATION.cff file
-
✓codemeta.json file
Found codemeta.json file -
○.zenodo.json file
-
○DOI references
-
○Academic publication links
-
○Committers with academic emails
-
○Institutional organization owner
-
○JOSS paper metadata
-
○Scientific vocabulary similarity
Low similarity (13.0%) to scientific vocabulary
Keywords from Contributors
Repository
Efficient 2D plotting Python library based on PythonQwt
Basic Info
- Host: GitHub
- Owner: PlotPyStack
- License: other
- Language: Python
- Default Branch: master
- Homepage: https://pypi.python.org/pypi/guiqwt
- Size: 11.3 MB
Statistics
- Stars: 81
- Watchers: 13
- Forks: 21
- Open Issues: 12
- Releases: 16
Metadata Files
README.md
guiqwt: Python tools for curve and image plotting





ℹ️ Created in 2009 by Pierre Raybaut and maintained by the PlotPyStack organization.
Important note

guiqwt has been replaced by PlotPy which is a complete rewrite of the library, under more permissive license terms (BSD) with a lot of improvements (automatic test suite with ~70% test coverage, unified curve/image ready-to-use widgets, new documentation, ...). We strongly recommend to use PlotPy instead of guiqwt. First, because guiqwt is not maintained anymore and second, because PlotPy is far more robust and tested. Moreover, you can easily migrate your existing guiqwt-based code to PlotPy thanks to the migration guide.
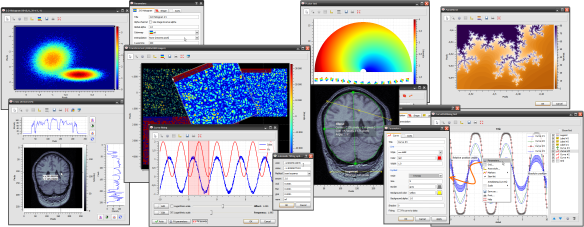
See documentation for more details on the library and changelog for recent history of changes.
Copyright © 2009-2015 CEA, Pierre Raybaut, licensed under the terms of the CECILL License.
Overview
Based on PythonQwt (a pure Python/PyQt reimplementation of the curve
plotting Qwt C++ library, included in guiqwt base source code) and on the
scientific modules NumPy and SciPy, guiqwt is a Python library providing
efficient 2D data-plotting features (curve/image visualization and related
tools) for interactive computing and signal/image processing application
development. It is based on Qt graphical user interfaces library, and
currently supports both PyQt5 and PySide2.
Extension to PythonQwt:
- set of tools for curve and image plotting
- GUI-based application development helpers
Dependencies
Requirements
- Python 3.7+
- PyQt5
- QtPy
- PythonQwt (pure Python reimplementation of Qwt6 C++ library)
- guidata
- NumPy
- SciPy
- Pillow
Optional modules
- pydicom for DICOM I/O support
Building/Installation
All platforms
The setup.py script supports the following extra options for
optimizing the image scaler engine with SSE2/SSE3 processors:
--sse2 or --sse3.
On GNU/Linux and MacOS platforms
bash
python setup.py build install
On Windows platforms with Microsoft Visual Studio
cmd
python setup.py build -c msvc install
Owner
- Name: PlotPyStack
- Login: PlotPyStack
- Kind: organization
- Location: France
- Repositories: 1
- Profile: https://github.com/PlotPyStack
The Python-Qt visualization and scientific GUI stack based on PythonQwt, guidata and plotpy
GitHub Events
Total
- Watch event: 2
Last Year
- Watch event: 2
Committers
Last synced: about 2 years ago
Top Committers
| Name | Commits | |
|---|---|---|
| Pierre Raybaut | p****t@c****r | 524 |
| Pierre Raybaut | p****t@g****m | 268 |
| Pierre Raybaut@Jaune | P****t@J****e | 24 |
| Ludovic Aubry | l****y@c****r | 13 |
| laubrycomm@free.fr | l****m@f****r | 10 |
| Virginie Le Rouzic | v****c@c****r | 6 |
| berrosse | b****e@f****r | 5 |
| Russ Berg | r****g@l****a | 5 |
| Virginie Rousseau | v****u@c****r | 4 |
| Pierre Raybaut@skynet | P****t@s****t | 3 |
| Pierre Raybaut@Skynet | P****t@S****t | 3 |
| Pierre Raybaut | pr@p****m | 3 |
| dependabot[bot] | 4****] | 2 |
| Pierre Raybaut | p****t@c****r | 2 |
| ADM_RaybautP@P-S10985-XP | A****P@P****P | 1 |
| pierre@skynet | p****e@s****t | 1 |
| convert-repo | n****e@n****e | 1 |
| Gabi Davar | g****o@g****m | 1 |
| stonebig | s****4@g****m | 1 |
Committer Domains (Top 20 + Academic)
Packages
- Total packages: 2
-
Total downloads:
- pypi 2,788 last-month
-
Total dependent packages: 6
(may contain duplicates) -
Total dependent repositories: 37
(may contain duplicates) - Total versions: 30
- Total maintainers: 1
pypi.org: guiqwt
guiqwt is a set of tools for curve and image plotting (extension to PythonQwt)
- Homepage: https://github.com/PlotPyStack/guiqwt
- Documentation: https://guiqwt.readthedocs.io/
- License: CeCILL V2
-
Latest release: 4.4.5
published over 2 years ago
Rankings
Maintainers (1)
conda-forge.org: guiqwt
Based on PythonQwt (a pure Python/PyQt reimplementation of the curve plotting Qwt C++ library, included in guiqwt base source code) and on the scientific modules NumPy and SciPy, guiqwt is a Python library providing efficient 2D data-plotting features (curve/image visualization and related tools) for interactive computing and signal/image processing application development. It is based on Qt graphical user interfaces library, and currently supports both PyQt4 and PyQt5.
- Homepage: https://github.com/PlotPyStack/guiqwt
- License: CECILL-2.0
-
Latest release: 3.0.7
published over 4 years ago
Rankings
Dependencies
- Cython ==0.29.21
- PyQt5 ==5.15.0
- PyQt5-sip ==12.8.0
- guidata ==1.7.8
- numpy ==1.21.0
- NumPy >=1.3
- Pillow *
- PythonQwt >=0.10
- QtPy >=1.3
- SciPy >=0.7
- guidata >=2.3