dtreeviz
A python library for decision tree visualization and model interpretation.
Science Score: 36.0%
This score indicates how likely this project is to be science-related based on various indicators:
-
○CITATION.cff file
-
✓codemeta.json file
Found codemeta.json file -
✓.zenodo.json file
Found .zenodo.json file -
○DOI references
-
○Academic publication links
-
✓Committers with academic emails
2 of 31 committers (6.5%) from academic institutions -
○Institutional organization owner
-
○JOSS paper metadata
-
○Scientific vocabulary similarity
Low similarity (9.3%) to scientific vocabulary
Keywords
Keywords from Contributors
Repository
A python library for decision tree visualization and model interpretation.
Basic Info
Statistics
- Stars: 3,092
- Watchers: 46
- Forks: 343
- Open Issues: 75
- Releases: 37
Topics
Metadata Files
README.md
dtreeviz : Decision Tree Visualization
Description
A python library for decision tree visualization and model interpretation. Decision trees are the fundamental building block of gradient boosting machines and Random Forests(tm), probably the two most popular machine learning models for structured data. Visualizing decision trees is a tremendous aid when learning how these models work and when interpreting models. The visualizations are inspired by an educational animation by R2D3; A visual introduction to machine learning. Please see How to visualize decision trees for deeper discussion of our decision tree visualization library and the visual design decisions we made.
Currently dtreeviz supports: scikit-learn, XGBoost, Spark MLlib, LightGBM, and Tensorflow. See Installation instructions.
Authors
- Terence Parr, a tech lead at Google, and until 2022 was a professor of data science / computer science at Univ. of San Francisco, where he was founding director of the University of San Francisco's MS in data science program in 2012.
- Tudor Lapusan
- Prince Grover
With major code and visualization clean up contributions done by Matthew Epland (@mepland).
Sample Visualizations
Tree visualizations
 |
 |
 |
Prediction path explanations
 |
 |
 |
Leaf information
 |
 |
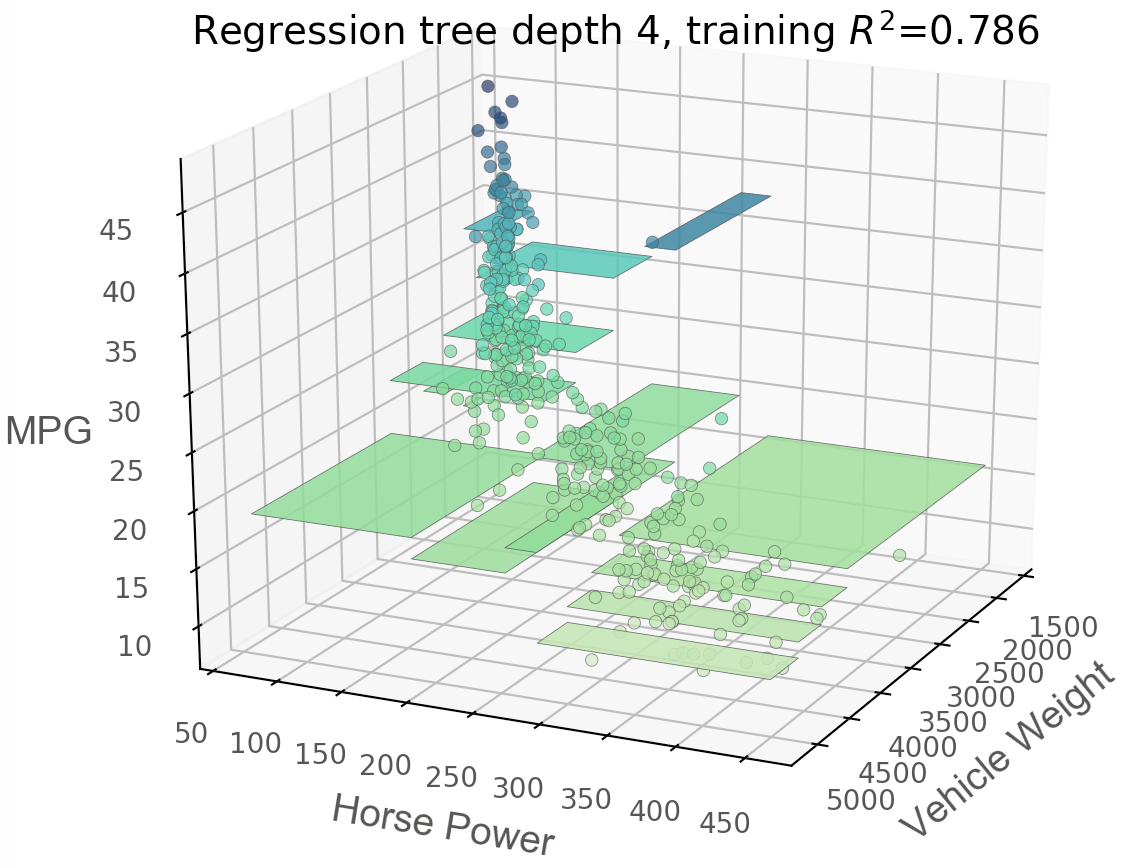
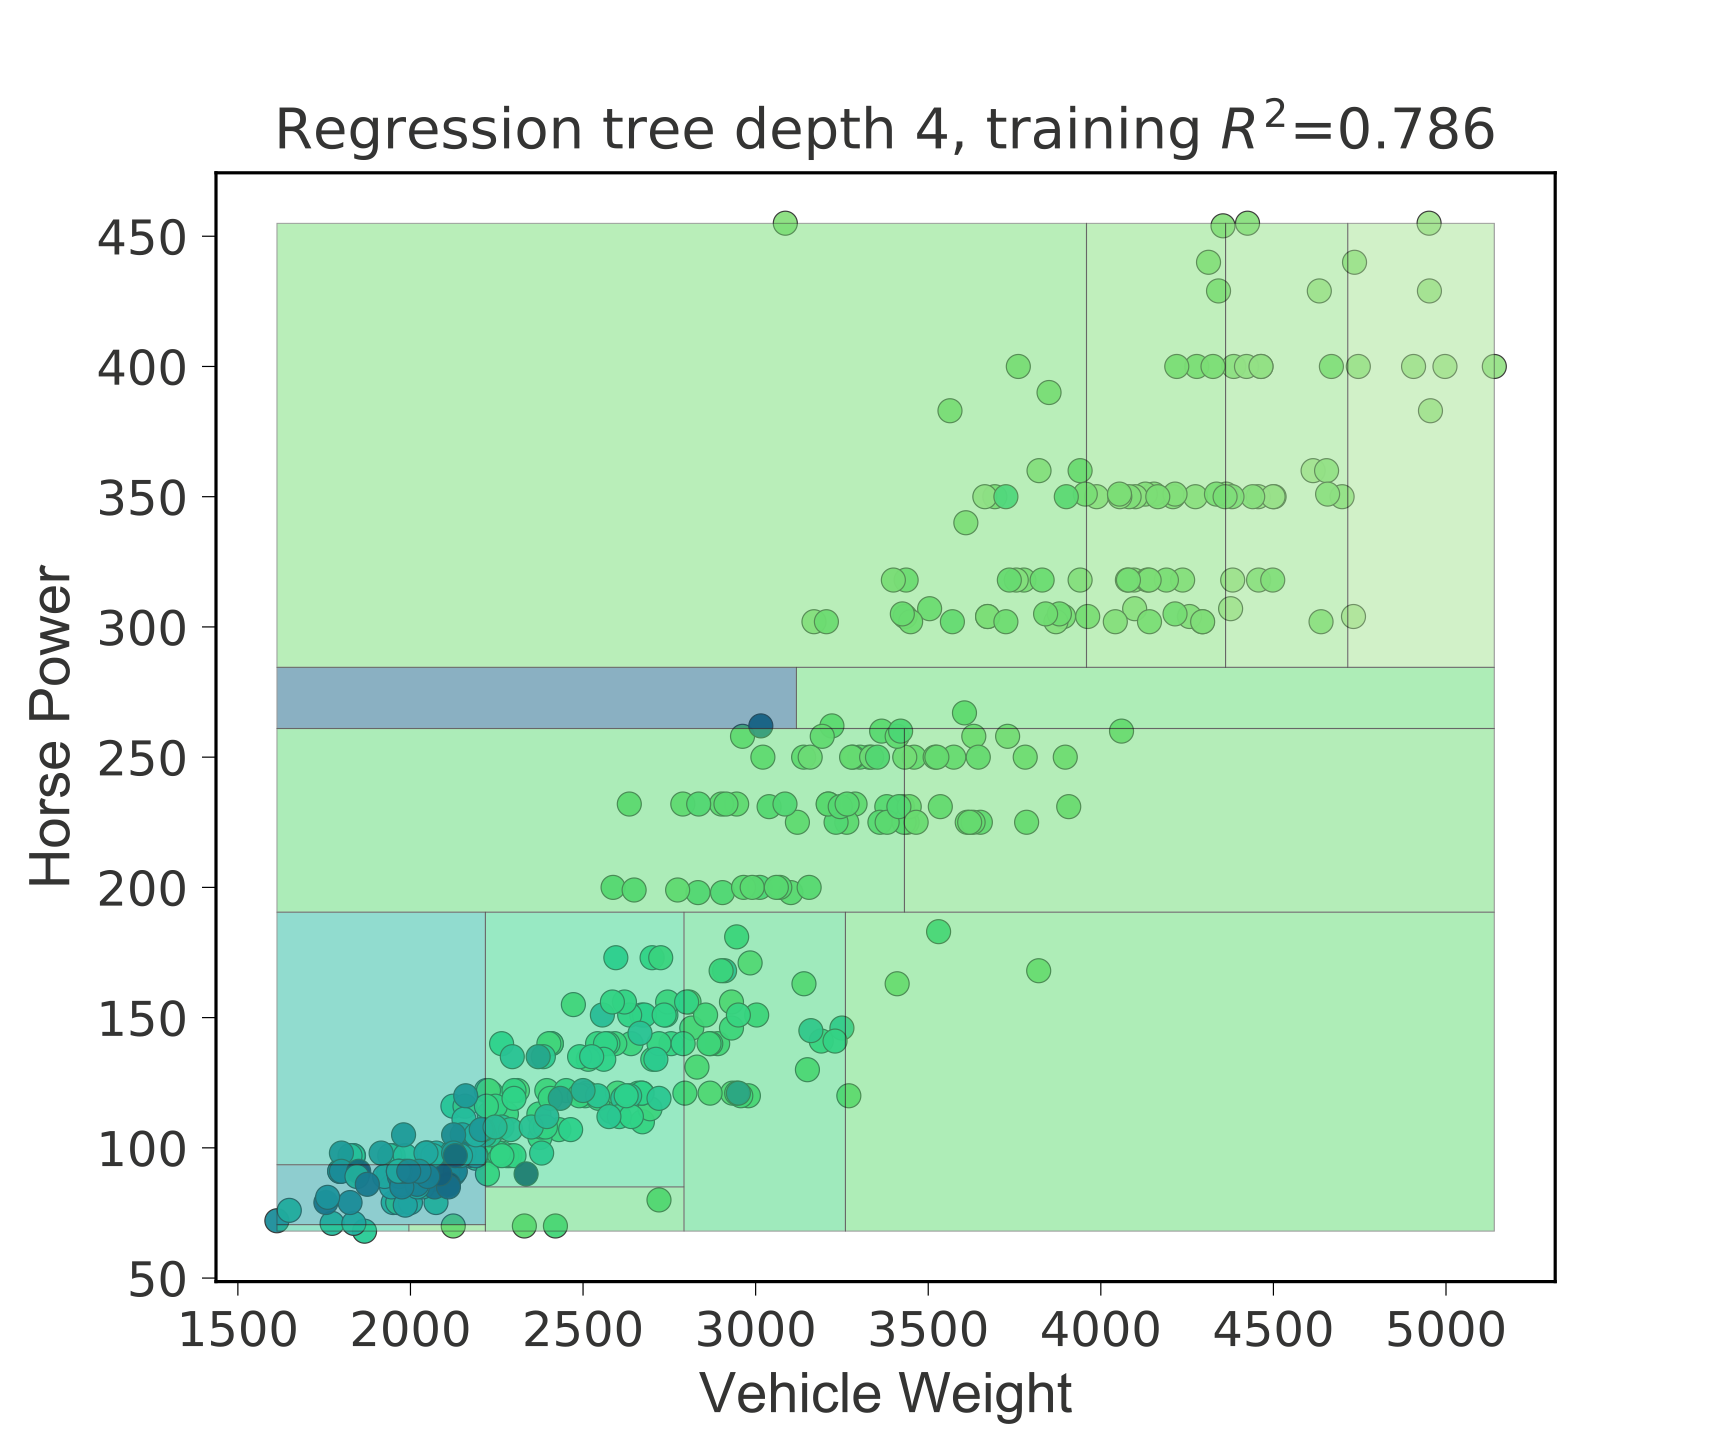
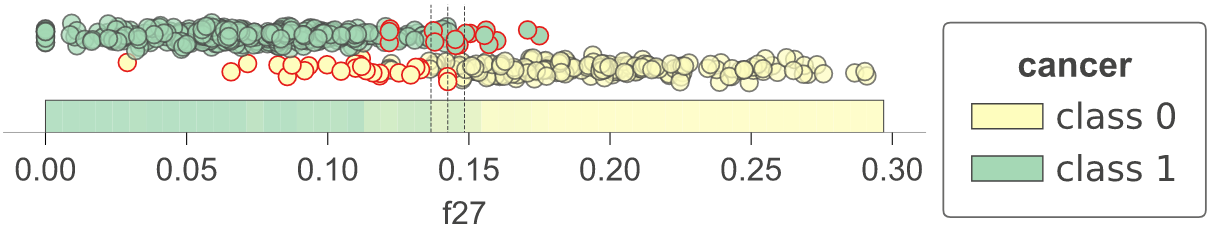
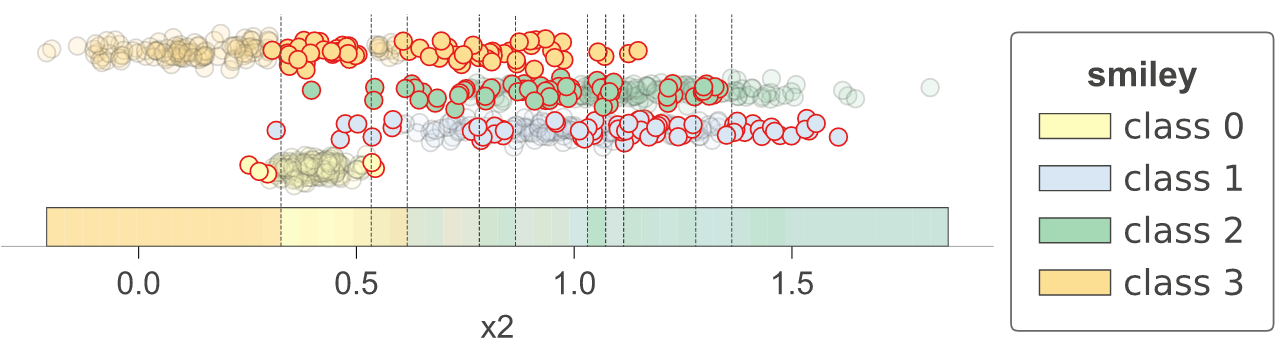
Feature space exploration
Regression
 |
 |
 |
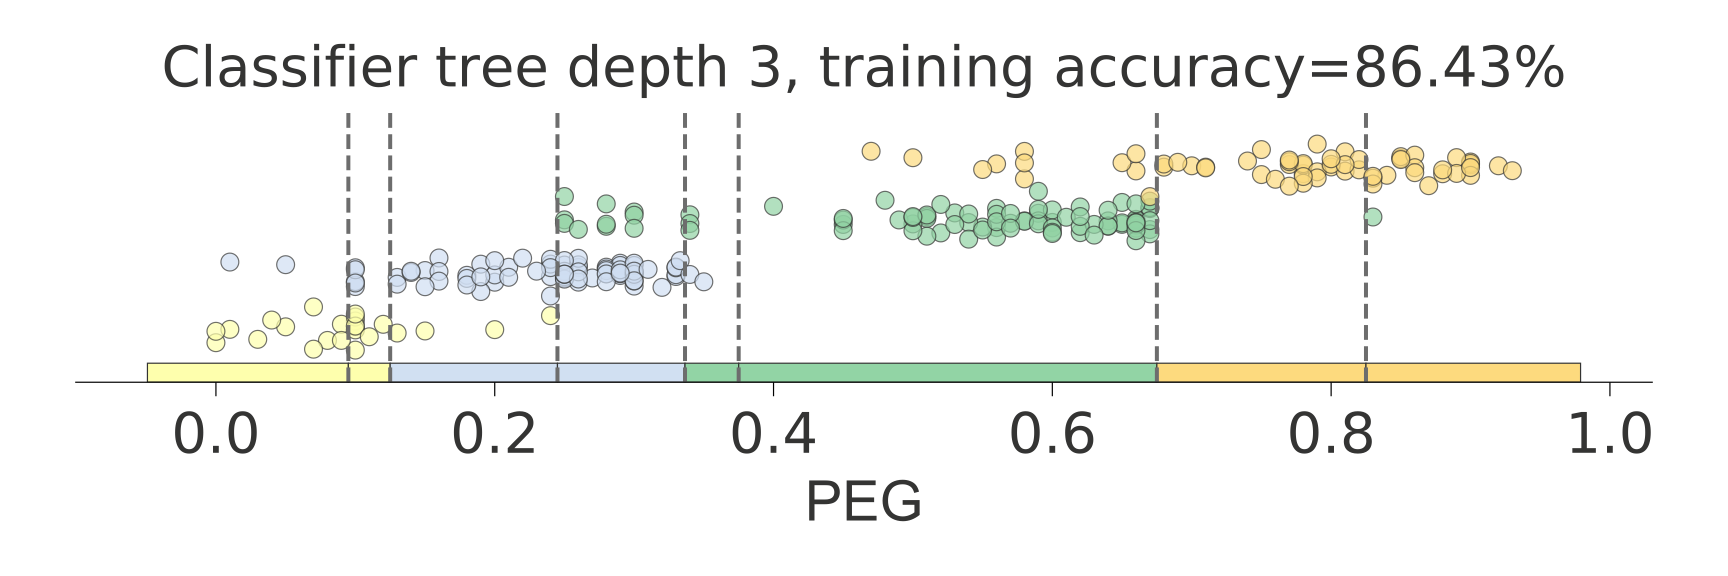
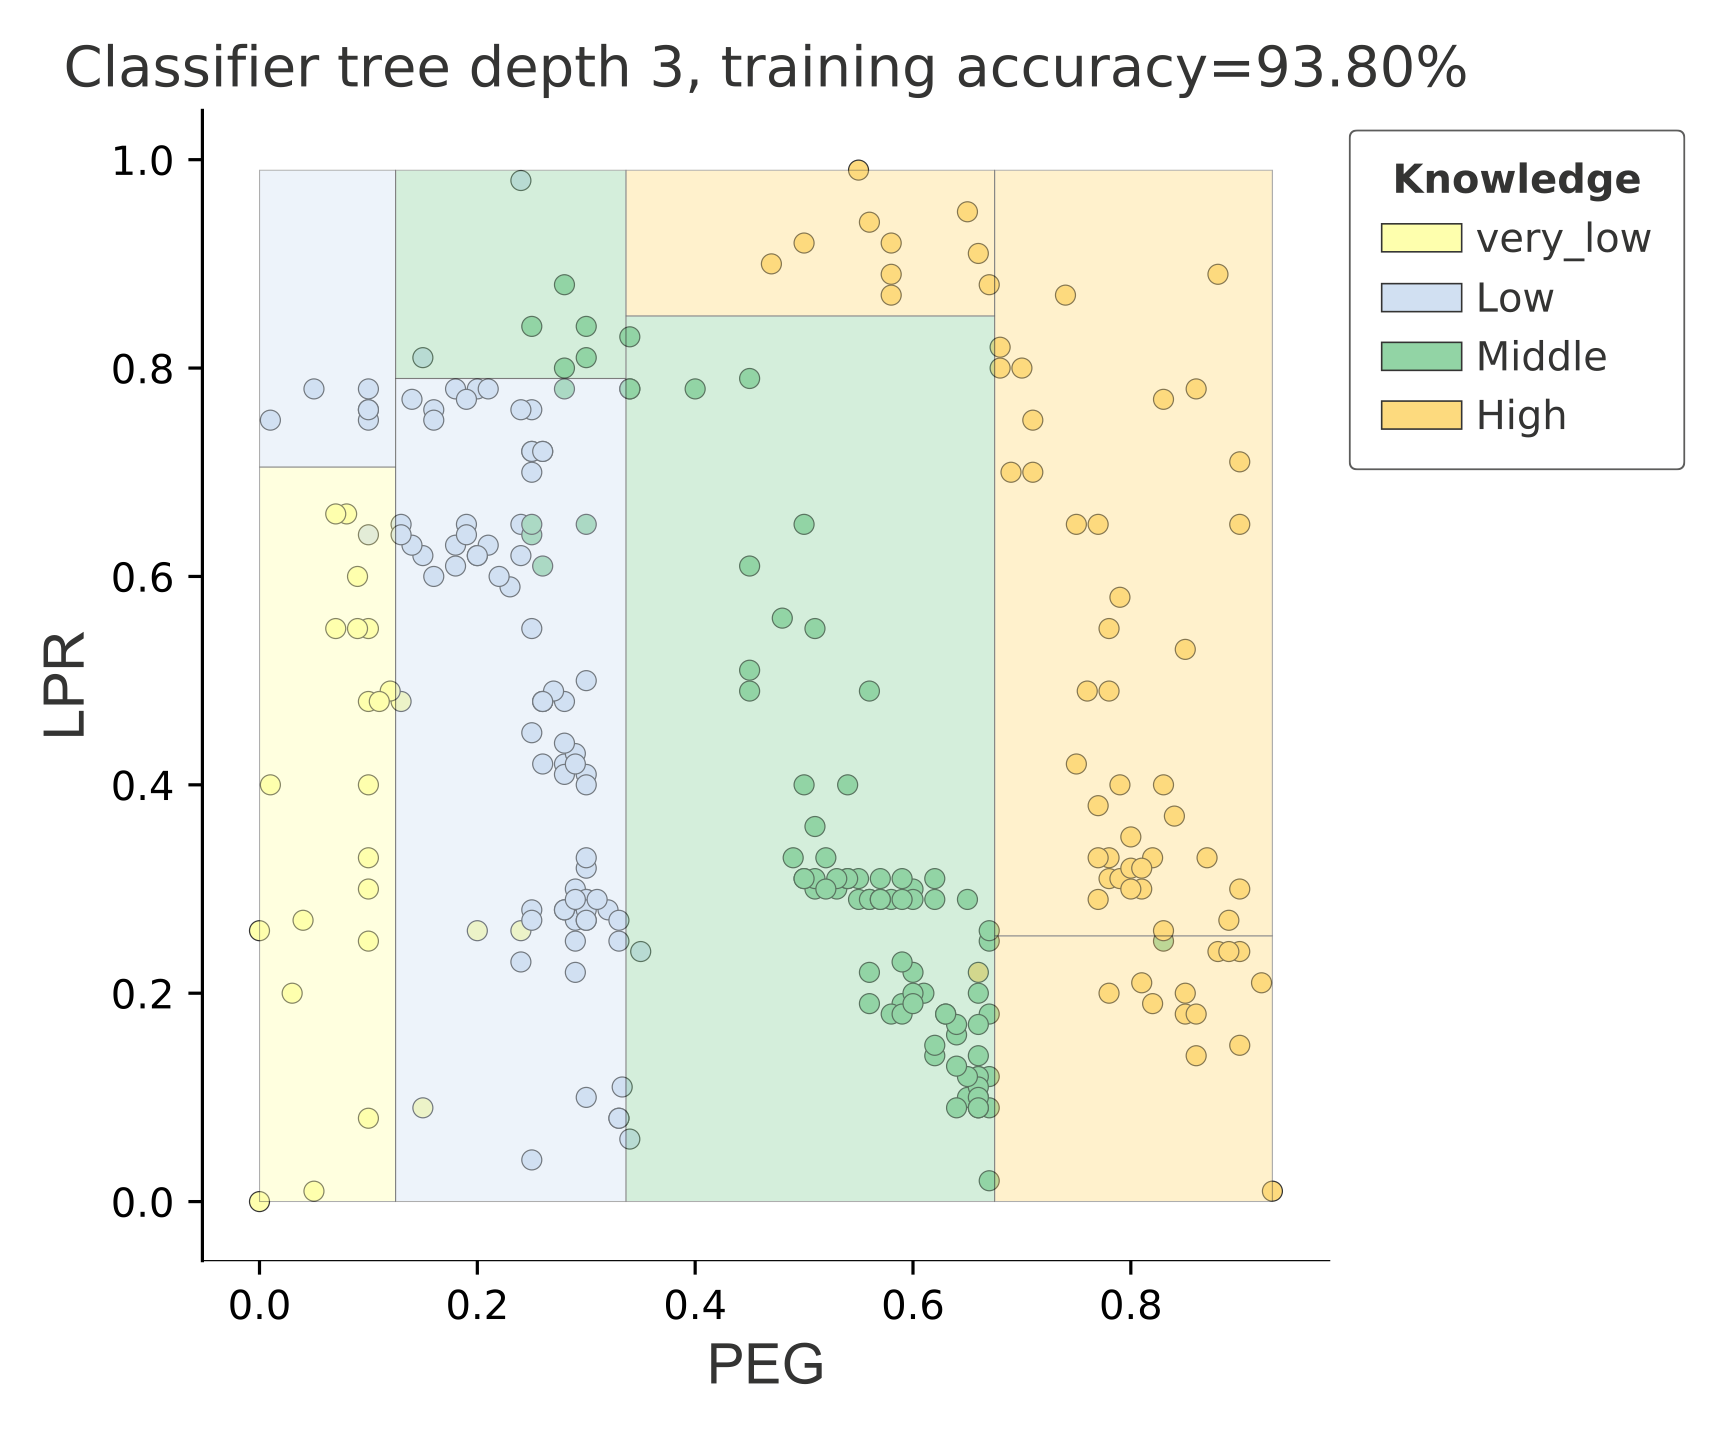
Classification
 |
 |
Classification boundaries
As a utility function, dtreeviz provides dtreeviz.decision_boundaries() that illustrates one and two-dimensional feature space for classifiers, including colors that represent probabilities, decision boundaries, and misclassified entities. This method is not limited to tree models, by the way, and should work with any model that answers method predict_proba(). That means any model from scikit-learn should work (but we also made it work with Keras models that define predict()). (As it does not work with trees specifically, the function does not use adaptors obtained from dtreeviz.model().) See classifier-decision-boundaries.ipynb.
  |
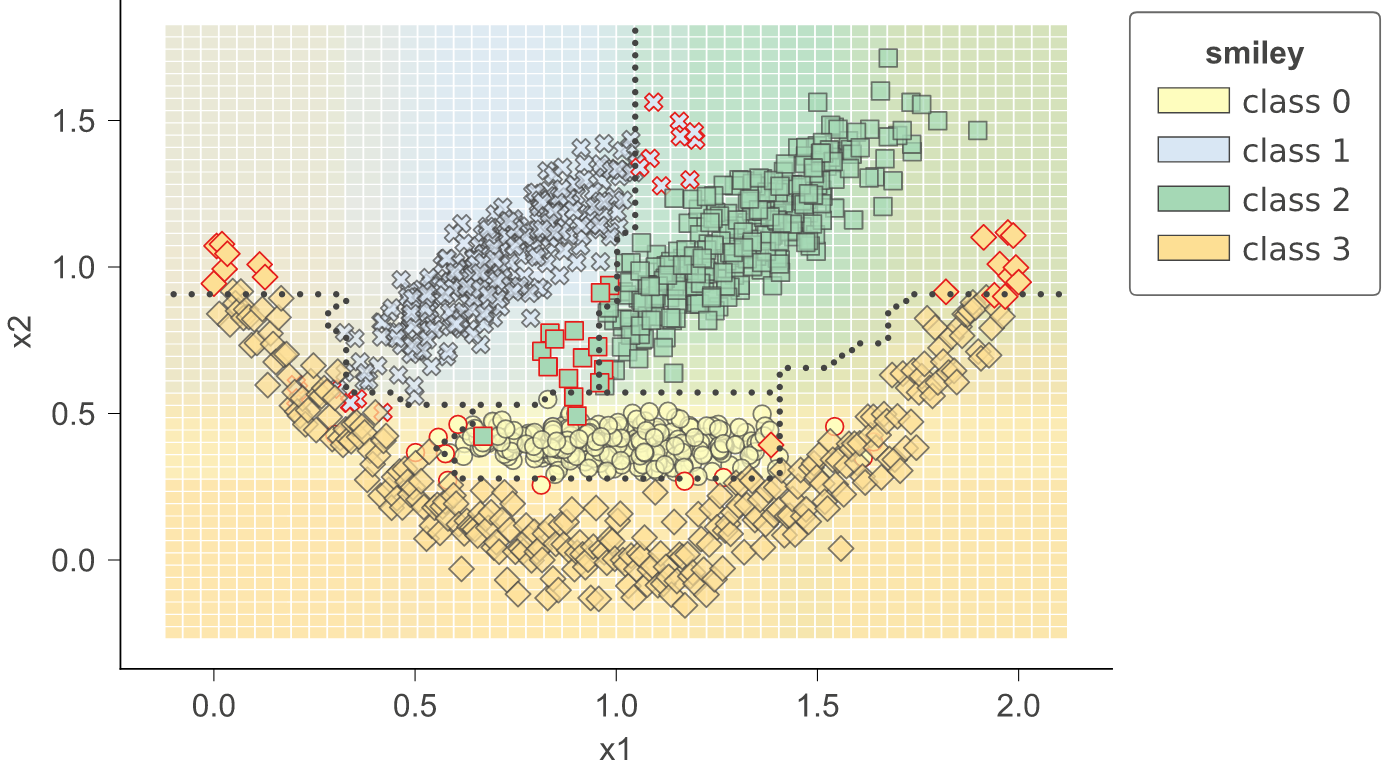 |
Sometimes it's helpful to see animations that change some of the hyper parameters. If you look in notebook classifier-boundary-animations.ipynb, you will see code that generates animations such as the following (animated png files):
 |
 |
Quick start
See Installation instructions then take a look at the specific notebooks for the supported ML library you're using:
- sklearn-based examples (colab)
- LightGBM-based examples (colab)
- Spark-based examples (colab)
- TensorFlow-based examples (colab) Also see blog at tensorflow.org Visualizing TensorFlow Decision Forest Trees with dtreeviz
- XGBoost-based examples (colab)
- Classifier decision boundaries for any scikit-learn model.ipynb (colab)
- Changing colors notebook (colab)
To interopt with these different libraries, dtreeviz uses an adaptor object, obtained from function dtreeviz.model(), to extract model information necessary for visualization. Given such an adaptor object, all of the dtreeviz functionality is available to you using the same programmer interface. The basic dtreeviz usage recipe is:
- Import dtreeviz and your decision tree library
- Acquire and load data into memory
- Train a classifier or regressor model using your decision tree library
- Obtain a dtreeviz adaptor model using
viz_model = dtreeviz.model(your_trained_model,...) - Call dtreeviz functions, such as
viz_model.view()orviz_model.explain_prediction_path(sample_x)
Example
Here's a complete example Python file that displays the following tree in a popup window:

```python from sklearn.datasets import load_iris from sklearn.tree import DecisionTreeClassifier
import dtreeviz
iris = load_iris() X = iris.data y = iris.target
clf = DecisionTreeClassifier(max_depth=4) clf.fit(X, y)
vizmodel = dtreeviz.model(clf, Xtrain=X, ytrain=y, featurenames=iris.featurenames, targetname='iris', classnames=iris.targetnames)
v = viz_model.view() # render as SVG into internal object v.show() # pop up window v.save("/tmp/iris.svg") # optionally save as svg ```
In a notebook, you can render inline without calling show(). Just call view():
python
viz_model.view()       # in notebook, displays inline
Installation
Install anaconda3 on your system, if not already done.
You might verify that you do not have conda-installed graphviz-related packages installed because dtreeviz needs the pip versions; you can remove them from conda space by doing:
bash
conda uninstall python-graphviz
conda uninstall graphviz
To install (Python >=3.6 only), do this (from Anaconda Prompt on Windows!):
bash
pip install dtreeviz             # install dtreeviz for sklearn
pip install dtreeviz[xgboost]    # install XGBoost related dependency
pip install dtreeviz[pyspark]    # install pyspark related dependency
pip install dtreeviz[lightgbm]   # install LightGBM related dependency
pip install dtreeviz[tensorflow_decision_forests]   # install tensorflow_decision_forests related dependency
pip install dtreeviz[all]        # install all related dependencies
This should also pull in the graphviz Python library (>=0.9), which we are using for platform specific stuff.
Limitations. Only svg files can be generated at this time, which reduces dependencies and dramatically simplifies install process.
Please email Terence with any helpful notes on making dtreeviz work (better) on other platforms. Thanks!
For your specific platform, please see the following subsections.
Mac
Make sure to have the latest XCode installed and command-line tools installed. You can run xcode-select --install from the command-line to install those if XCode is already installed. You also have to sign the XCode license agreement, which you can do with sudo xcodebuild -license from command-line. The brew install shown next needs to build graphviz, so you need XCode set up properly.
You need the graphviz binary for dot. Make sure you have latest version (verified on 10.13, 10.14):
bash
brew reinstall graphviz
Just to be sure, remove dot from any anaconda installation, for example:
bash
rm ~/anaconda3/bin/dot
From command line, this command
bash
dot -Tsvg
should work, in the sense that it just stares at you without giving an error. You can hit control-C to escape back to the shell. Make sure that you are using the right dot as installed by brew:
bash
$ which dot
/usr/local/bin/dot
$ ls -l $(which dot)
lrwxr-xr-x  1 parrt  wheel  33 May 26 11:04 /usr/local/bin/dot@ -> ../Cellar/graphviz/2.40.1/bin/dot
$
Limitations. Jupyter notebook has a bug where they do not show .svg files correctly, but Juypter Lab has no problem.
Linux (Ubuntu 18.04)
To get the dot binary do:
bash
sudo apt install graphviz
Limitations. The view() method works to pop up a new window and images appear inline for jupyter notebook but not jupyter lab (It gets an error parsing the SVG XML.) The notebook images also have a font substitution from the Arial we use and so some text overlaps. Only .svg files can be generated on this platform.
Windows 10
(Make sure to pip install graphviz, which is common to all platforms, and make sure to do this from Anaconda Prompt on Windows!)
Download graphviz-2.38.msi and update your Path environment variable. Add C:\Program Files (x86)\Graphviz2.38\bin to User path and C:\Program Files (x86)\Graphviz2.38\bin\dot.exe to System Path. It's windows so you might need a reboot after updating that environment variable. You should see this from the Anaconda Prompt:
(base) C:\Users\Terence Parr>where dot
C:\Program Files (x86)\Graphviz2.38\bin\dot.exe
(Do not use conda install -c conda-forge python-graphviz as you get an old version of graphviz python library.)
Verify from the Anaconda Prompt that this works (capital -V not lowercase -v):
dot -V
If it doesn't work, you have a Path problem. I found the following test programs useful. The first one sees if Python can find dot:
python
import os
import subprocess
proc = subprocess.Popen(['dot','-V'])
print( os.getenv('Path') )
The following version does the same thing except uses graphviz Python libraries backend support utilities, which is what we use in dtreeviz:
python
import graphviz.backend as be
cmd = ["dot", "-V"]
stdout, stderr = be.run(cmd, capture_output=True, check=True, quiet=False)
print( stderr )
If you are having issues with run command you can try copying the following files from: https://github.com/xflr6/graphviz/tree/master/graphviz.
Place them in the AppData\Local\Continuum\anaconda3\Lib\site-packages\graphviz folder.
Clean out the pycache directory too.
For graphviz windows install 8.0.5 and python interface v0.18+ :
python
import graphviz.backend as be
cmd = ["dot", "-V"]
stdout = be.execute.run_check(cmd, capture_output=True, check=True, quiet=False)
print( stdout )
Jupyter Lab and Jupyter notebook both show the inline .svg images well.
Verify graphviz installation
Try making text file t.dot with content digraph T { A -> B } (paste that into a text editor, for example) and then running this from the command line:
dot -Tsvg -o t.svg t.dot
That should give a simple t.svg file that opens properly. If you get errors from dot, it will not work from the dtreeviz python code. If it can't find dot then you didn't update your PATH environment variable or there is some other install issue with graphviz.
Limitations
Finally, don't use IE to view .svg files. Use Edge as they look much better. I suspect that IE is displaying them as a rasterized not vector images. Only .svg files can be generated on this platform.
Install dtreeviz locally
Make sure to follow the install guidelines above.
In order to run tests, you need to install the library with the [dev] extra:
bash
pip install dtreeviz[dev]        # Install develop dependencies
To push the dtreeviz library to your local egg cache (force updates) during development, do this (from anaconda prompt on Windows):
bash
python setup.py install -f
E.g., on Terence's box, it add /Users/parrt/anaconda3/lib/python3.6/site-packages/dtreeviz-2.2.2-py3.6.egg.
Feedback
We welcome info from users on how they use dtreeviz, what features they'd like, etc... via email (to parrt) or via an issue.
Useful Resources
- How to visualize decision trees
- How to explain gradient boosting
- The Mechanics of Machine Learning
- Animation by R2D3
- A visual introductionn to machine learning
- fast.ai's Introduction to Machine Learning for Coders MOOC
- Stef van den Elzen's Interactive Construction, Analysis and Visualization of Decision Trees
- Some similar feature-space visualizations in Towards an effective cooperation of the user and the computer for classification, SIGKDD 2000
- Beautiful Decisions: Inside BigML’s Decision Trees
- "SunBurst" approach to tree visualization: An evaluation of space-filling information visualizations for depicting hierarchical structures
License
This project is licensed under the terms of the MIT license, see LICENSE.
Owner
- Name: Terence Parr
- Login: parrt
- Kind: user
- Location: San Francisco
- Website: http://explained.ai
- Twitter: the_antlr_guy
- Repositories: 58
- Profile: https://github.com/parrt
Tech lead at Google, ex-Professor of computer/data science, active contributor to open-source projects supporting developers. Creator of ANTLR parser generator.
GitHub Events
Total
- Issues event: 2
- Watch event: 137
- Issue comment event: 3
- Push event: 1
- Fork event: 9
Last Year
- Issues event: 2
- Watch event: 137
- Issue comment event: 3
- Push event: 1
- Fork event: 9
Committers
Last synced: 10 months ago
Top Committers
| Name | Commits | |
|---|---|---|
| tlapusan | t****n@g****m | 181 |
| parrt | p****t@c****u | 144 |
| Terence Parr | p****t@a****g | 121 |
| Matthew Epland | m****d@g****m | 34 |
| Tobias Windisch | t****h@p****e | 7 |
| gautamkarnik | g****k@s****a | 7 |
| Oege Dijk | o****k@g****m | 5 |
| Ashafix | m****s@m****l | 4 |
| StepanWorkV | 1****V@u****m | 4 |
| David Schönleber | d****r@e****m | 3 |
| H4dr1en | h****n@p****e | 2 |
| Matthew Epland | m****d@u****m | 2 |
| Oliver Zeigermann | o****r@z****e | 2 |
| Praneet Nigam | n****0@g****m | 2 |
| Richard Stotz | r****z@c****g | 2 |
| Simon Turintech | s****n@t****i | 2 |
| Thom Sentner | 5****r@u****m | 2 |
| x1nyuan | y****o@g****m | 2 |
| 4SkyNet | n****n@g****m | 1 |
| Alex Moldovan | a****n@g****m | 1 |
| Demetrio92 | D****T@g****m | 1 |
| Federico Rosato | 3****o@u****m | 1 |
| Jordan Lubbers | j****r@g****m | 1 |
| Karthikeyan Singaravelan | t****i@g****m | 1 |
| Kento Mori | k****9@g****m | 1 |
| Matteo Bruno | m****o@v****m | 1 |
| Oliver Zeigermann | o****n@g****m | 1 |
| Tobias Windisch | t****h@h****e | 1 |
| Tyrion | h****d@l****t | 1 |
| borjagarciag | 9****g@u****m | 1 |
| and 1 more... | ||
Committer Domains (Top 20 + Academic)
Issues and Pull Requests
Last synced: 11 months ago
All Time
- Total issues: 89
- Total pull requests: 53
- Average time to close issues: 3 months
- Average time to close pull requests: 24 days
- Total issue authors: 51
- Total pull request authors: 13
- Average comments per issue: 4.24
- Average comments per pull request: 4.0
- Merged pull requests: 43
- Bot issues: 0
- Bot pull requests: 0
Past Year
- Issues: 7
- Pull requests: 1
- Average time to close issues: 7 days
- Average time to close pull requests: 7 days
- Issue authors: 6
- Pull request authors: 1
- Average comments per issue: 1.43
- Average comments per pull request: 4.0
- Merged pull requests: 1
- Bot issues: 0
- Bot pull requests: 0
Top Authors
Issue Authors
- tlapusan (15)
- parrt (14)
- mepland (8)
- masterfelu (2)
- RajdeepTarafder (2)
- lgi1sgm (2)
- craftsliu (2)
- mojitopop (1)
- rahulsound (1)
- hoangson5898 (1)
- CermakM (1)
- GavinBeattie (1)
- sergiocalde94 (1)
- 0ptimista (1)
- HarshKapadia (1)
Pull Request Authors
- mepland (16)
- tlapusan (13)
- parrt (13)
- rstz (2)
- simonTurintech (2)
- windisch (1)
- thomsentner (1)
- Alex-AMC (1)
- jlubbersgeo (1)
- MohammedAlsayed (1)
- StepanWorkV (1)
- ghost (1)
- StepanTita (1)
Top Labels
Issue Labels
Pull Request Labels
Packages
- Total packages: 3
-
Total downloads:
- pypi 81,147 last-month
- Total docker downloads: 248,344
-
Total dependent packages: 19
(may contain duplicates) -
Total dependent repositories: 95
(may contain duplicates) - Total versions: 63
- Total maintainers: 1
pypi.org: dtreeviz
A Python 3 library for sci-kit learn, XGBoost, LightGBM, Spark, and TensorFlow decision tree visualization
- Homepage: https://github.com/parrt/dtreeviz
- Documentation: https://dtreeviz.readthedocs.io/
- License: MIT
-
Latest release: 2.2.2
published about 3 years ago
Rankings
Maintainers (1)
conda-forge.org: dtreeviz
- Homepage: https://github.com/parrt/dtreeviz
- License: MIT
-
Latest release: 1.4.0
published over 3 years ago
Rankings
conda-forge.org: dtreeviz-extended
- Homepage: https://github.com/parrt/dtreeviz
- License: MIT
-
Latest release: 1.4.0
published over 3 years ago
Rankings
Dependencies
- colour *
- graphviz >=0.9
- matplotlib *
- numpy *
- pandas *
- scikit-learn *