3DQLayers
3DQLayers: Volumetric Layer Based Analysis for Quantitative Renal MRI - Published in JOSS (2025)
Science Score: 98.0%
This score indicates how likely this project is to be science-related based on various indicators:
-
✓CITATION.cff file
Found CITATION.cff file -
✓codemeta.json file
Found codemeta.json file -
✓.zenodo.json file
Found .zenodo.json file -
✓DOI references
Found 7 DOI reference(s) in README and JOSS metadata -
✓Academic publication links
Links to: researchgate.net, joss.theoj.org, zenodo.org -
○Academic email domains
-
○Institutional organization owner
-
✓JOSS paper metadata
Published in Journal of Open Source Software
Keywords
Repository
Quantitative layer based analysis for renal magnetic resonance imaging.
Basic Info
- Host: GitHub
- Owner: alexdaniel654
- License: gpl-3.0
- Language: Python
- Default Branch: main
- Homepage: https://qlayers.readthedocs.io/latest/
- Size: 43.5 MB
Statistics
- Stars: 1
- Watchers: 1
- Forks: 2
- Open Issues: 1
- Releases: 5
Topics
Metadata Files
README.md
QLayers
![]()
![]()
![]()
![]()


![]()
![]()

Quantitative layer based analysis for renal magnetic resonance imaging.
Installation
The easiest way to install qlayersis via pip:
bash
pip install qlayers
or if you're a conda user:
bash
conda install qlayers -c conda-forge
Alternatively, you can install qlayersfrom source in pips editable mode:
bash
git clone https://github.com/alexdaniel654/qlayers.git
cd qlayers
pip install -e .
Quick Start
Documentation for qlayers can be found here. This includes a full API
reference, tutorials and examples of how to use qlayers to generate layers and apply them to quantitative maps.
The tutorials can also be run through binder if
you want to have a go with qlayers without installing anything. However, if you want to get started on your machine
with the minimum lines of code, the snippet of code below should get you going.
```python import nibabel as nib from qlayers import QLayers
maskimg = nib.load("kidneymask.nii.gz") t2starimg = nib.load("t2starmap.nii.gz")
qlayers = QLayers(maskimg, pelvisdist=10) qlayers.addmap(t2starimg, "t2star")
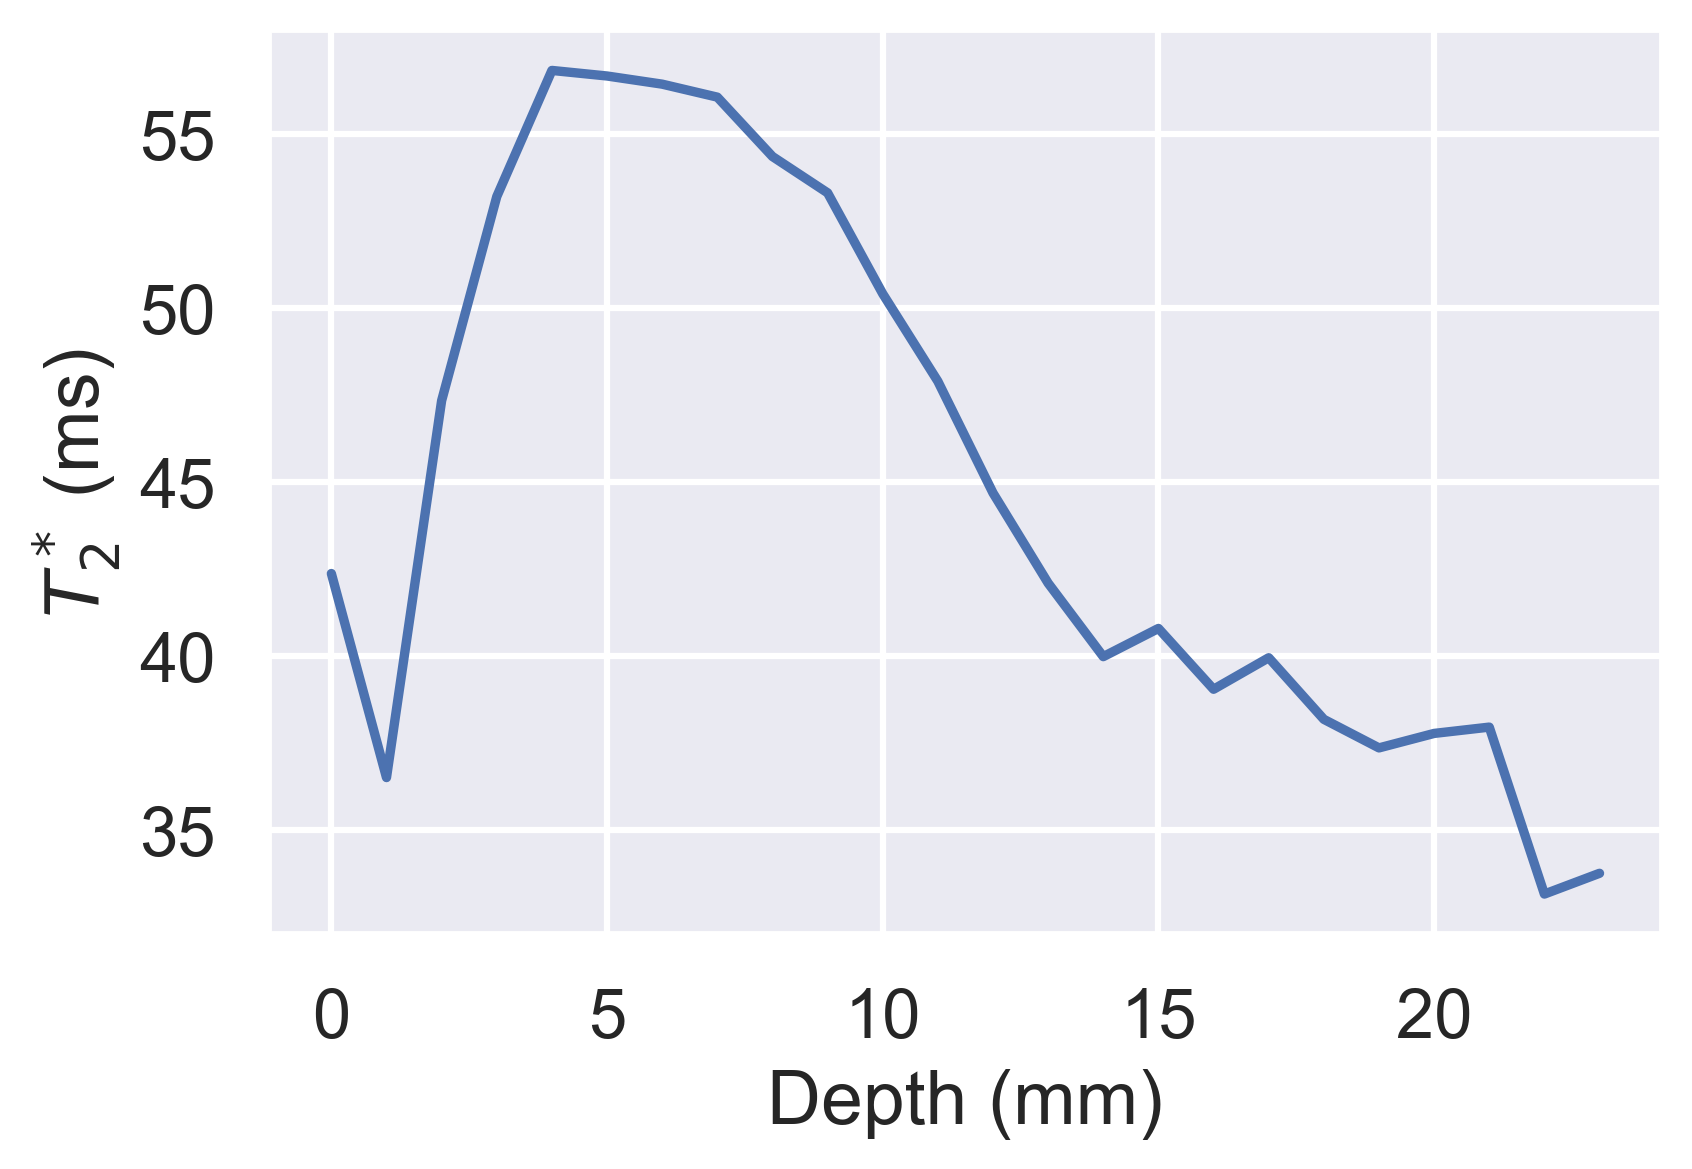
df = qlayers.getdf(format="wide") df.groupby("layer").median().loc[:, "t2star"].plot( xlabel="Depth (mm)", ylabel="$T2^*$ (ms)" ) ```
Theory
Background
The premise behind qlayers was first proposed by Pruijm et al and is based
on the idea to segment the kidney into layers based on each voxels distance from the surface of the kidney. The average of
a quantitative parameter can be calculated for each layer producing profiles of, for example, T2* with
depth. The outer and inner layers are analogous to the cortex and medulla respectively while the gradient of the profile is
representative of the cortico-medullary difference. qlayers extends this idea by allowing the user to define layers based on
a 3D mask and apply the layer to any quantitative parameter.
Generating Layers
Layers are generated via the process outlined in the figure below.
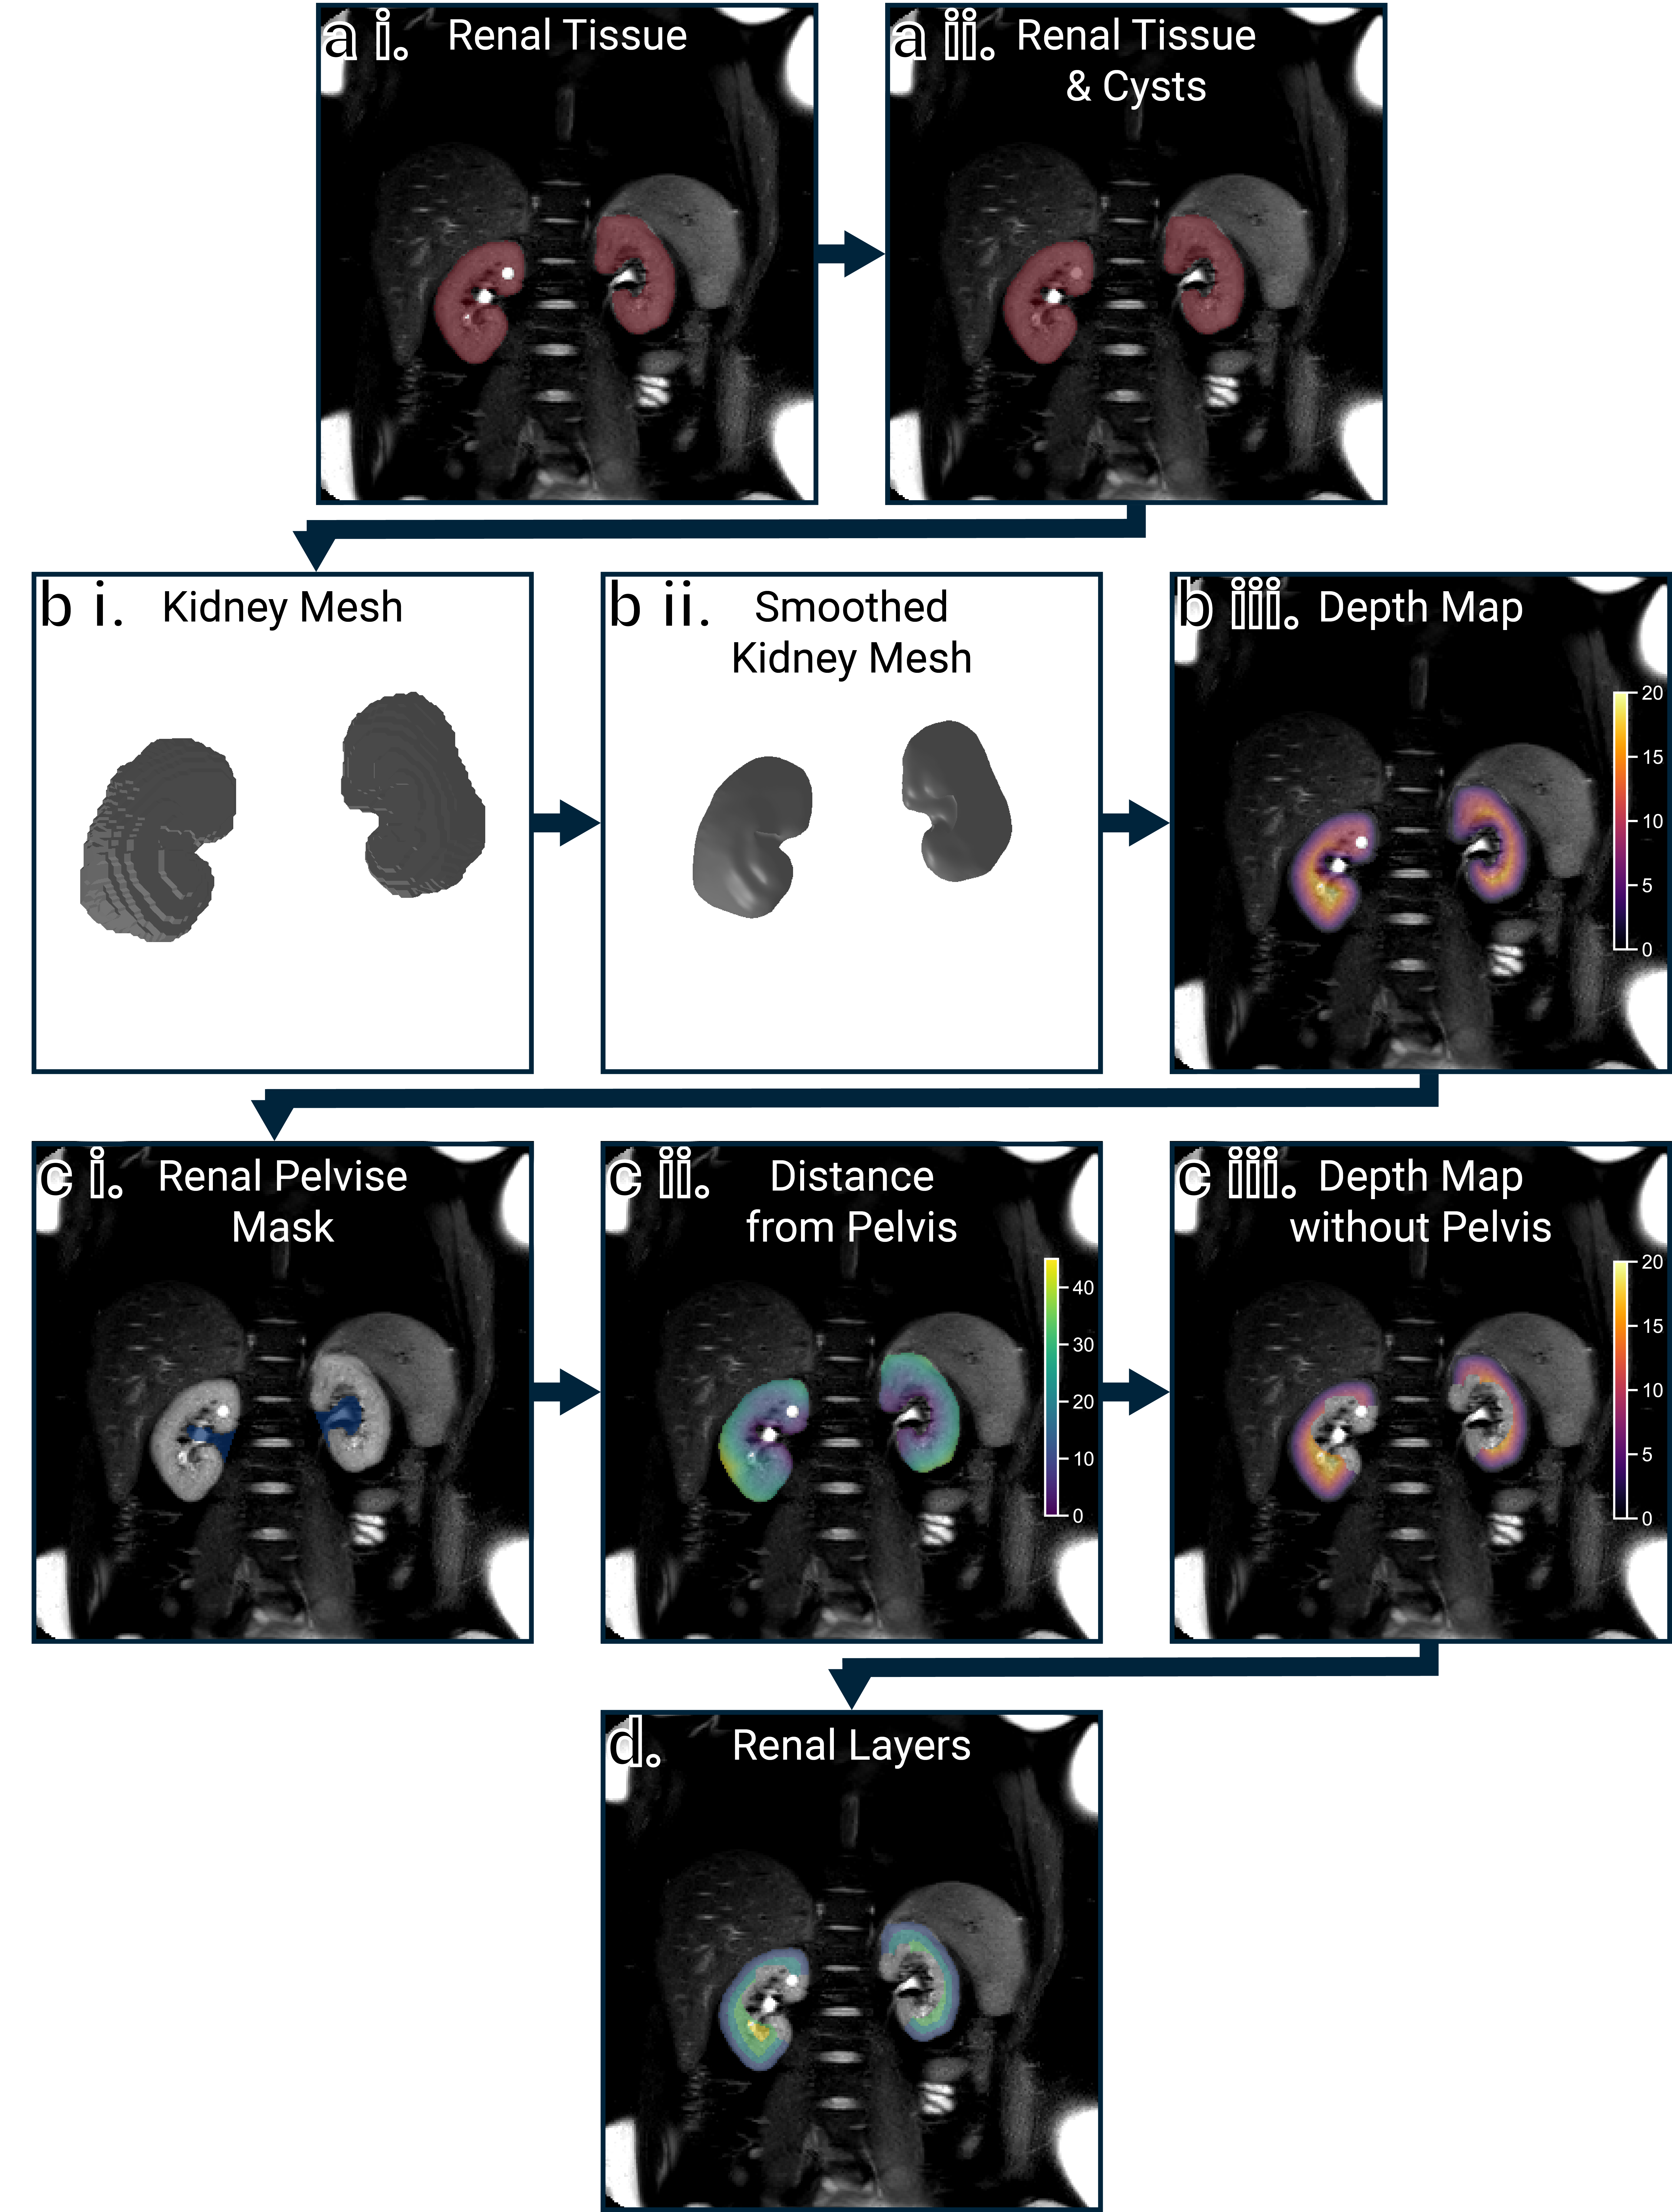
a i. Shows the mask thats input to the QLayers class. This mask then has any holes smaller than fill_ml filled as these are
most likely cysts
and therefore not cortical surfaces, a ii. The mask is then converted from a voxel representation to a mesh surface
representation, b i, this mesh is then smoothed because anatomical scans of the kidneys often have a low through-plane
resolution, b ii. The distance from the centre of each voxel in the kidneys to the closest surface on the mesh is then
calculated, b iii. As the tissue adjacent to the renal pelvis is not representative of the medulla, this is automatically
excluded from the resulting depth maps. Fist the pelvis is automatically segmented, c i, and the distance from each voxel
in the kidneys to the pelvis calculated as above, c ii. Voxels closer than a specified threshold pelvis_dist are then
excluded from the depth maps, c iii. Finally, a layer image is generated by quantising the depth map to a desired layer
thickness, typically 1 mm although shown with 5 mm layers here for illustrative purposes, d.
Applying Layers to Quantitative Data
If the space parameter of the QLayers object is set to layers, when a quantitative map is added to the QLayers
object, it is resampled to the same resolution and orientation as the layers. If the space parameter is set to map then
the layers are resampled to the resolution and orientation of the quantitative map. In both cases, Pandas DataFrames can
be generated with the quantitative value, depth and layer each voxel is in. These DataFrames can then be used for further
calculations such as generating profiles or linear regressions to explore the cortico-medullary difference. Some example
voxels are shown in the table below.
| Depth | Layer | T2* | R2* | |-------|-------|------|------| | 0 | 0 | 57 | 17.6 | | 13.2 | 14 | 35.5 | 28.2 | | 10.2 | 11 | 60.9 | 16.4 | | 3.05 | 4 | 51.6 | 19.4 | | 9.33 | 10 | 42.8 | 23.3 | | 10.4 | 11 | 29.6 | 33.8 | | 8.63 | 9 | 37.5 | 26.7 | | 6.66 | 7 | 49.2 | 20.3 | | 19.8 | 20 | 42.8 | 23.3 | | 12.1 | 13 | 39.4 | 25.4 |
Citing 3DQLayers
If you have used 3DQLayers in your research, please cite the following conference abstract:
Alternatively, if you want to cite a specific version of this software, each release has an individual DOI on Zenodo, the DOI for the latest release can be found here.
Contributing
We welcome contributions to QLayers, a full contributing guide can be found here.
Owner
- Name: Alex Daniel
- Login: alexdaniel654
- Kind: user
- Location: Nottingham
- Company: The University of Nottingham @SPMIC-UoN
- Website: alexdaniel.info
- Repositories: 21
- Profile: https://github.com/alexdaniel654
Computational physicist working on renal MRI at The University of Nottingham.
JOSS Publication
3DQLayers: Volumetric Layer Based Analysis for Quantitative Renal MRI
Authors

Sir Peter Mansfield Imaging Centre, University of Nottingham, Nottingham, United Kingdom
Sir Peter Mansfield Imaging Centre, University of Nottingham, Nottingham, United Kingdom, NIHR Nottingham Biomedical Research Centre, Nottingham University Hospitals NHS Trust and the University of Nottingham, Nottingham, United Kingdom
Editor
Kevin M. Moerman
Tags
Medical Imaging MRI Quantitative Imaging Image AnalysisCitation (CITATION.cff)
cff-version: 1.2.0
message: "If you use this software, please cite it as below."
authors:
- family-names: "Daniel"
  given-names: "Alexander J"
  orcid: "https://orcid.org/0000-0003-2353-3283"
- family-names: "Francis"
  given-names: "Susan T"
  orcid: "https://orcid.org/0000-0003-0903-7507"
title: "QLayers"
version: 1.0.0
date-released: 2025-06-16
url: "https://github.com/alexdaniel654/qlayers"
GitHub Events
Total
- Release event: 2
- Issue comment event: 2
- Push event: 19
- Pull request event: 1
- Fork event: 2
- Create event: 1
Last Year
- Release event: 2
- Issue comment event: 2
- Push event: 19
- Pull request event: 1
- Fork event: 2
- Create event: 1
Issues and Pull Requests
Last synced: 11 months ago
All Time
- Total issues: 7
- Total pull requests: 2
- Average time to close issues: 20 days
- Average time to close pull requests: 20 days
- Total issue authors: 1
- Total pull request authors: 1
- Average comments per issue: 0.29
- Average comments per pull request: 0.5
- Merged pull requests: 1
- Bot issues: 0
- Bot pull requests: 0
Past Year
- Issues: 0
- Pull requests: 2
- Average time to close issues: N/A
- Average time to close pull requests: 20 days
- Issue authors: 0
- Pull request authors: 1
- Average comments per issue: 0
- Average comments per pull request: 0.5
- Merged pull requests: 1
- Bot issues: 0
- Bot pull requests: 0
Top Authors
Issue Authors
- alexdaniel654 (7)
Pull Request Authors
- agahkarakuzu (2)
Top Labels
Issue Labels
Pull Request Labels
Packages
- Total packages: 1
-
Total downloads:
- pypi 13 last-month
- Total dependent packages: 0
- Total dependent repositories: 0
- Total versions: 5
- Total maintainers: 1
pypi.org: qlayers
Quantitative layer analysis for renal MRI
- Homepage: https://github.com/alexdaniel654/qlayers
- Documentation: https://qlayers.readthedocs.io/
- License: GPL-3.0
-
Latest release: 1.0.0
published about 1 year ago
Rankings
Maintainers (1)
Dependencies
- actions/checkout v4 composite
- actions/setup-python v4 composite
- codecov/codecov-action v3 composite
- myst-parser *
- nbsphinx *
- nbsphinx-link *
- sphinx *
- sphinx_rtd_theme *
- nibabel *
- numpy *
- pandas *
- pytest *
- rtree *
- scikit-image *
- tqdm *
- trimesh *
- actions/checkout v4 composite
- actions/download-artifact v4 composite
- actions/setup-python v5 composite
- actions/upload-artifact v4 composite
- ncipollo/release-action v1 composite
- pypa/gh-action-pypi-publish release/v1 composite