Fitspy
Fitspy: A Python package for spectral decomposition - Published in JOSS (2024)
Science Score: 98.0%
This score indicates how likely this project is to be science-related based on various indicators:
-
✓CITATION.cff file
Found CITATION.cff file -
✓codemeta.json file
Found codemeta.json file -
✓.zenodo.json file
Found .zenodo.json file -
✓DOI references
Found 10 DOI reference(s) in README and JOSS metadata -
✓Academic publication links
Links to: joss.theoj.org, zenodo.org -
○Committers with academic emails
-
○Institutional organization owner
-
✓JOSS paper metadata
Published in Journal of Open Source Software
Keywords
Repository
Generic tool dedicated to fit spectra in python
Basic Info
- Host: GitHub
- Owner: CEA-MetroCarac
- License: gpl-3.0
- Language: Python
- Default Branch: main
- Homepage: https://pypi.org/project/fitspy/
- Size: 22.5 MB
Statistics
- Stars: 7
- Watchers: 2
- Forks: 0
- Open Issues: 7
- Releases: 10
Topics
Metadata Files
README.md

![]()
![]()

![]()
Fitspy is a generic tool dedicated to fit spectra in python with GUIs that aims to be as simple and intuitive to use as possible.
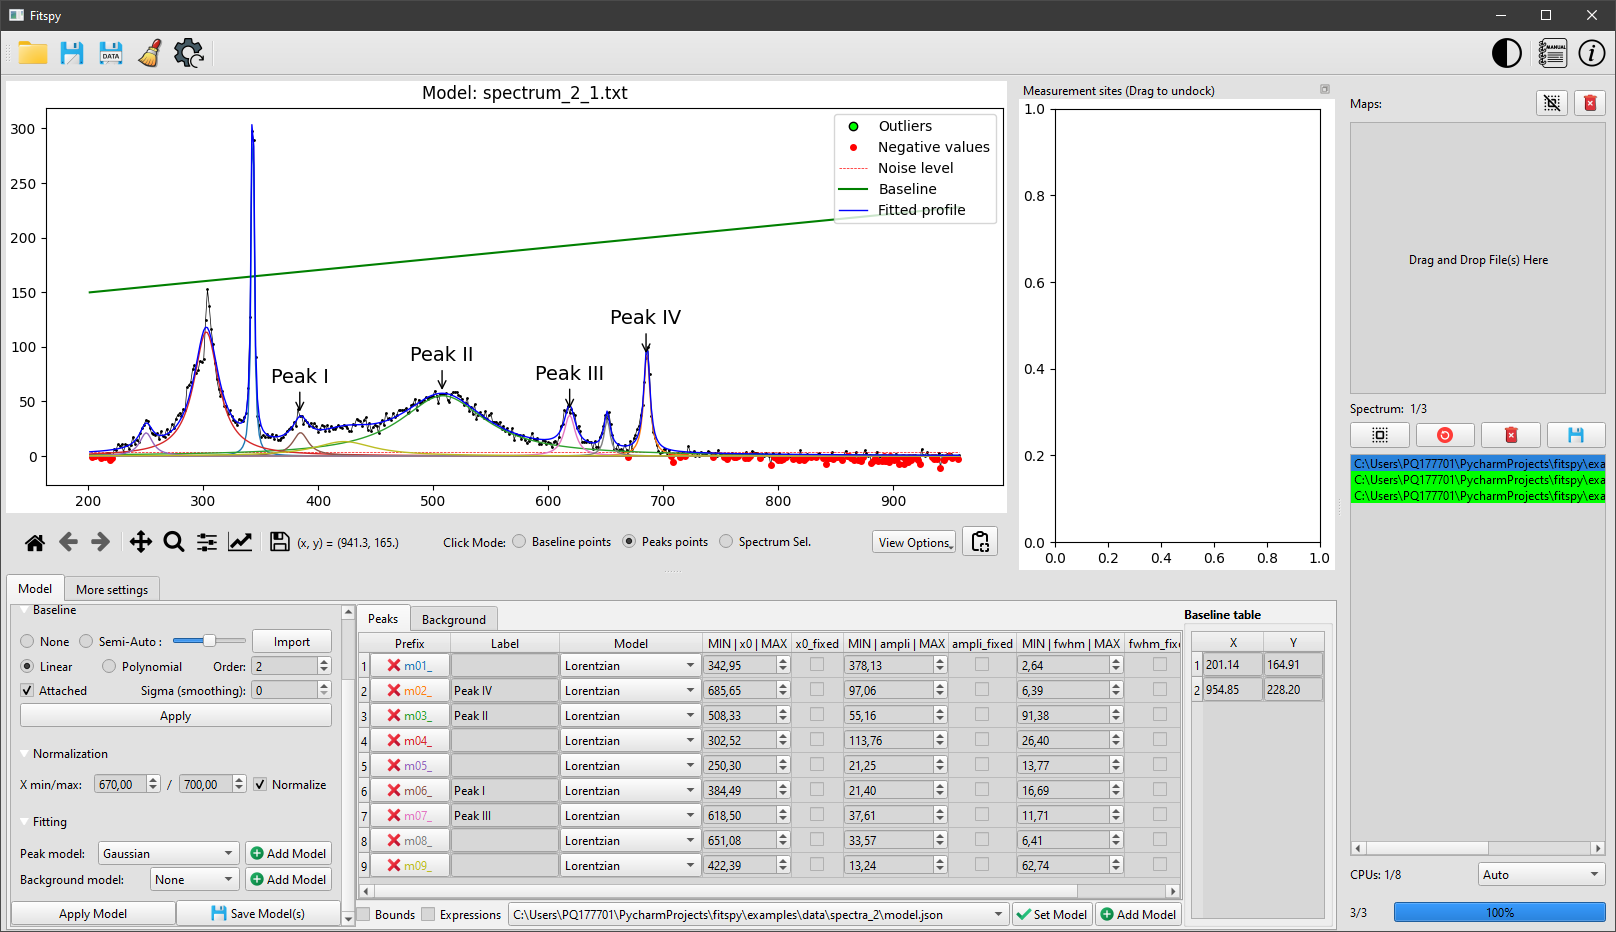
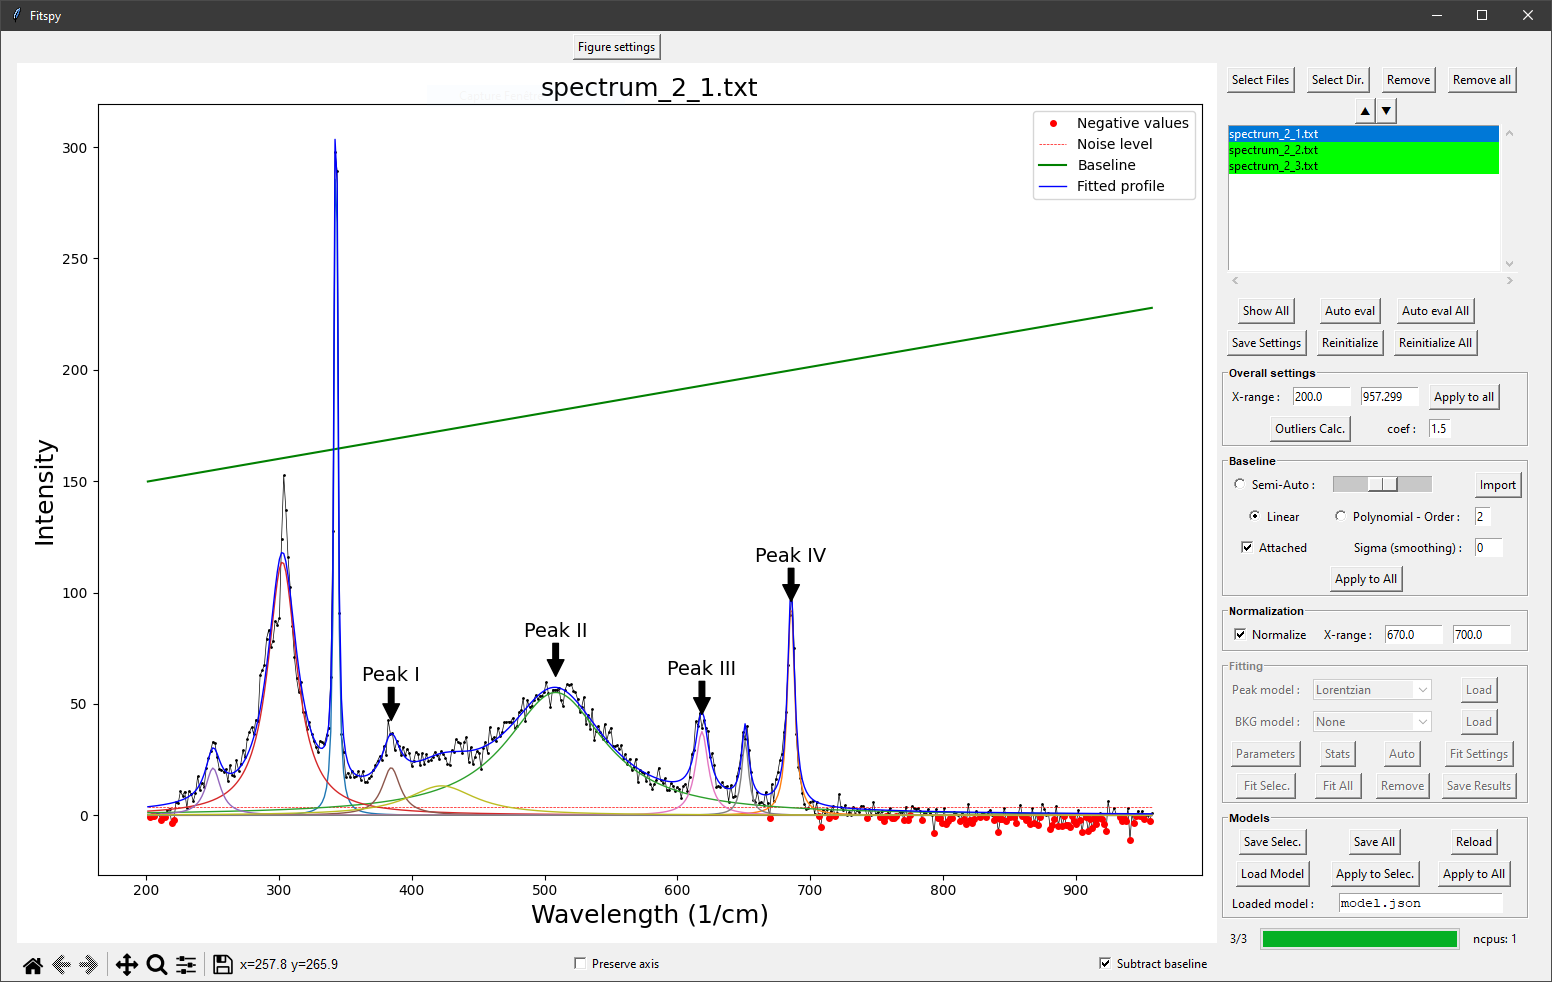
Illustration of the PySide GUI (left) and Tkinter GUI (right).
Processed spectra may be independent of each other or may result from 2D-maps acquisitions.
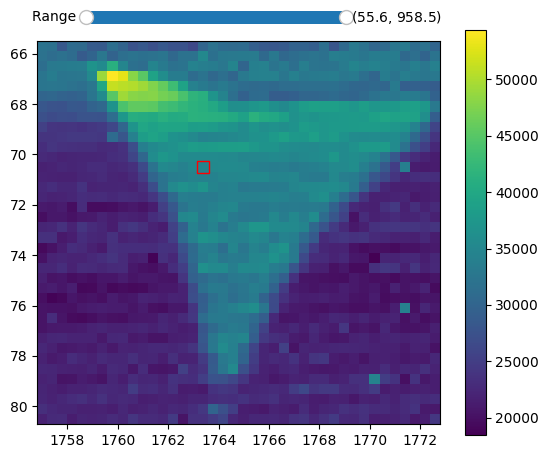
Example of fitspy 2D-map frame interacting with the main GUI.
The predefined peak models considered in Fitspy are Gaussian, Lorentzian, Asymetric Gaussian, Asymetric Lorentzian and Pseudovoigt. Some Bichromatic models related to bichromatic sources are also available as explained here
A Constant, Linear, Parabolic, Exponential or Power Law background model can also be added in the fitting.
In both cases, user-defined models can be added.
Fitspy main features:
- Fitspy uses the lmfit library to fit the spectra
- The fit processing can be multi-threaded
- Bounds and constraints can be set on each peaks models parameter
- From an automatic noise level estimation, according to the local noise, peak models can be automatically deactivated
- Fitspy also includes automatic outlier detection to be excluded during the fitting process
All actions allowed with the GUI can be executed in script mode (see examples here).
These actions (like baseline and peaks definition, parameters constraints, ...) can be saved in a Fitspy model and replayed as-is or applied to other new spectra datasets.
Installation
From PyPI (recommended)
bash
pip install fitspy
From GitHub (latest version)
bash
pip install git+https://github.com/CEA-MetroCarac/fitspy
(See the documentation for more details)
Upgrade
In the case of 'just' a Fitspy upgrade:
bash
pip uninstall fitspy
pip install fistspy # considering here the install from Pypi
For a full upgrade (Fitspy and its dependencies):
bash
pip install fitspy --upgrade # considering here the install from Pypi
Tests and examples execution
pip install pytest
git clone https://github.com/CEA-MetroCarac/fitspy.git
cd fitspy
pytest
python examples/ex_gui_auto_decomposition.py
python examples/ex_.......
(See the documentation for more details)
Quick start
Since its 2025.1 version, Fitspy can be launched using two interfaces: either the one corresponding to the original GUI built with Tkinter, or a more recent and advanced one, using PySide. As of 2025, both GUIs offer nearly identical features, but future efforts regarding fixes and updates will primarily focus on the PySide GUI.
PySide GUI:
Launch the application:
fitspy
From the right to the left, select the files to work with (considering the drag and drop capabilities). Then, use the Model panel to set the model parameters to be used during the fitting process. Peaks and an optional baseline associated with the model can be defined interactively by clicking on the desired position in the figure after activating Peak points (or Baseline points resp.) from the Click Mode radiobuttons located under the figure. Once the model build, The Fit can be launched. The corresponding model can be saved (in the Model panel) to be reload later (from the bottom-central panel) as-it with the same spectra (if the pathnames are still available) or just as a model for other spectra to be processed.
Tkinter GUI:
Launch the application:
fitspy-tk
From the top to the bottom of the right panel:
Selectfile(s)- (Optional) Define the X-range
- Define the baseline to
subtract(left or right click on the figure to add or delete (resp.) a baseline point) - (Optional) Normalize the spectrum/spectra
- Click on the
Fittingpanel to activate it - Select
Peak modeland add peaks (left or right click on the figure to add or delete (resp.) a peak) - (Optional) Add a background (BKG model) to be fitted
- (Optional) Use Parameters to set bounds and constraints
Fitthe selected spectrum/spectra- (Optional) Save the parameters in .csv format
- (Optional) Save the Model in a .json file (to be replayed later)
(See the documentation for more details)
Acknowledgements
This work, carried out on the CEA - Platform for Nanocharacterisation (PFNC), was supported by the “Recherche Technologique de Base” program of the French National Research Agency (ANR).
Warm thanks to the JOSS reviewers (@maurov and @FCMeng) and editor (@phibeck) for their contributions to enhancing Fitspy.
Citations
In case you use the results of this code in an article, please cite:
Quéméré P., (2024). Fitspy: A python package for spectral decomposition. Journal of Open Source Software. doi: 10.21105/joss.05868
Newville M., (2014). LMFIT: Non-Linear Least-Square Minimization and Curve-Fitting for Python. Zenodo. doi: 10.5281/zenodo.11813.
Owner
- Name: CEA-MetroCarac
- Login: CEA-MetroCarac
- Kind: organization
- Location: France
- Website: https://www.cea.fr/english
- Repositories: 1
- Profile: https://github.com/CEA-MetroCarac
Metrology and Characterization activities at the French Alternative Energies and Atomic Energy Commission
JOSS Publication
Fitspy: A Python package for spectral decomposition
Authors

Univ. Grenoble Alpes, CEA, Leti, F-38000 Grenoble, France
Editor
Sophie Beck
Tags
spectrum spectra decomposition fitCitation (CITATION.cff)
cff-version: "1.2.0"
authors:
- family-names: Quéméré
  given-names: Patrick
  orcid: "https://orcid.org/0009-0008-6936-1249"
doi: 10.5281/zenodo.10812332
message: If you use this software, please cite our article in the
  Journal of Open Source Software.
preferred-citation:
  authors:
  - family-names: Quéméré
    given-names: Patrick
    orcid: "https://orcid.org/0009-0008-6936-1249"
  date-published: 2024-04-15
  doi: 10.21105/joss.05868
  issn: 2475-9066
  issue: 96
  journal: Journal of Open Source Software
  publisher:
    name: Open Journals
  start: 5868
  title: "Fitspy: A Python package for spectral decomposition"
  type: article
  url: "https://joss.theoj.org/papers/10.21105/joss.05868"
  volume: 9
title: "Fitspy: A Python package for spectral decomposition"
GitHub Events
Total
- Create event: 18
- Commit comment event: 2
- Release event: 8
- Issues event: 105
- Watch event: 2
- Delete event: 11
- Issue comment event: 41
- Push event: 205
- Pull request event: 20
Last Year
- Create event: 18
- Commit comment event: 2
- Release event: 8
- Issues event: 105
- Watch event: 2
- Delete event: 11
- Issue comment event: 41
- Push event: 205
- Pull request event: 20
Committers
Last synced: 11 months ago
Top Committers
| Name | Commits | |
|---|---|---|
| patquem | p****e@c****r | 639 |
| Crackvignoule | k****n@g****m | 258 |
| Matthew Bryan | 7****2 | 14 |
| Crackvignoule | k****n@û****m | 1 |
Committer Domains (Top 20 + Academic)
Issues and Pull Requests
Last synced: 10 months ago
All Time
- Total issues: 65
- Total pull requests: 29
- Average time to close issues: 22 days
- Average time to close pull requests: about 1 month
- Total issue authors: 10
- Total pull request authors: 3
- Average comments per issue: 0.71
- Average comments per pull request: 0.0
- Merged pull requests: 27
- Bot issues: 0
- Bot pull requests: 0
Past Year
- Issues: 59
- Pull requests: 20
- Average time to close issues: 10 days
- Average time to close pull requests: less than a minute
- Issue authors: 8
- Pull request authors: 1
- Average comments per issue: 0.61
- Average comments per pull request: 0.0
- Merged pull requests: 20
- Bot issues: 0
- Bot pull requests: 0
Top Authors
Issue Authors
- patquem (30)
- Crackvignoule (20)
- thibautmeyer (3)
- AdrienT34490 (2)
- h0anle (2)
- maurov (2)
- erickmartinez (1)
- matbryan52 (1)
- gfreychet (1)
- kipavy (1)
Pull Request Authors
- Crackvignoule (20)
- patquem (7)
- matbryan52 (4)
Top Labels
Issue Labels
Pull Request Labels
Packages
- Total packages: 1
-
Total downloads:
- pypi 251 last-month
- Total dependent packages: 0
- Total dependent repositories: 0
- Total versions: 17
- Total maintainers: 1
pypi.org: fitspy
Fitspy: a generic tool to fit spectra in python
- Homepage: https://github.com/CEA-MetroCarac/fitspy
- Documentation: https://cea-metrocarac.github.io/fitspy/index.html
- License: GPL v3
-
Latest release: 2025.7
published 11 months ago