Science Score: 33.0%
This score indicates how likely this project is to be science-related based on various indicators:
-
○CITATION.cff file
-
✓codemeta.json file
Found codemeta.json file -
○.zenodo.json file
-
○DOI references
-
✓Academic publication links
Links to: sciencedirect.com, ieee.org -
✓Committers with academic emails
1 of 2 committers (50.0%) from academic institutions -
○Institutional organization owner
-
○JOSS paper metadata
-
○Scientific vocabulary similarity
Low similarity (10.5%) to scientific vocabulary
Keywords
Repository
an automated river analysis and mapping engine
Basic Info
Statistics
- Stars: 76
- Watchers: 14
- Forks: 33
- Open Issues: 4
- Releases: 1
Topics
Metadata Files
README.md
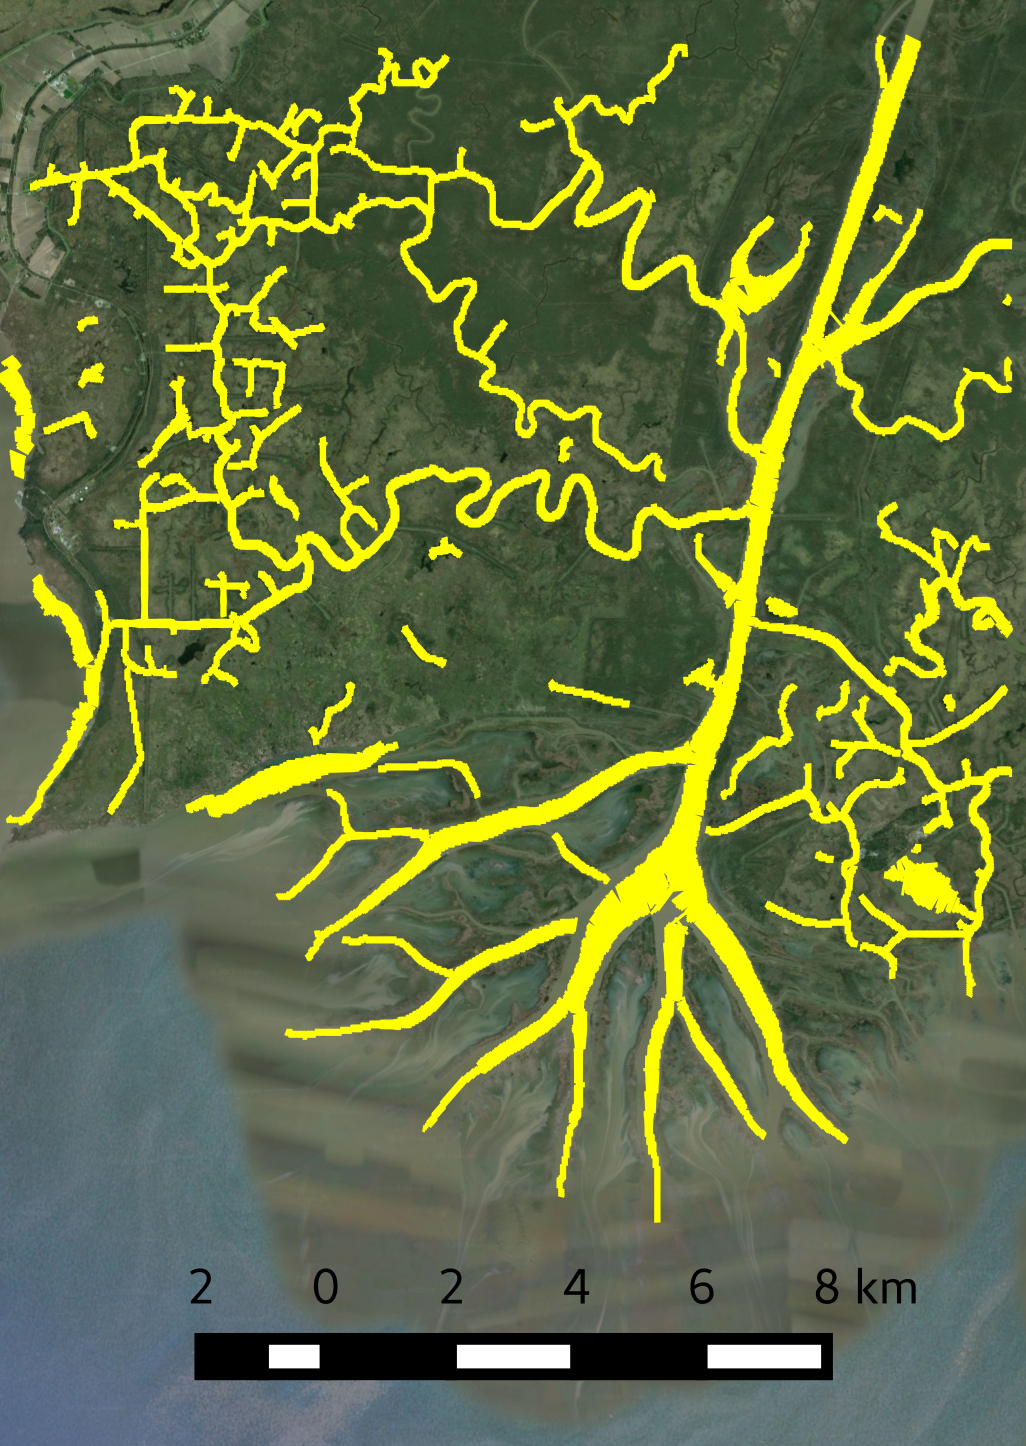
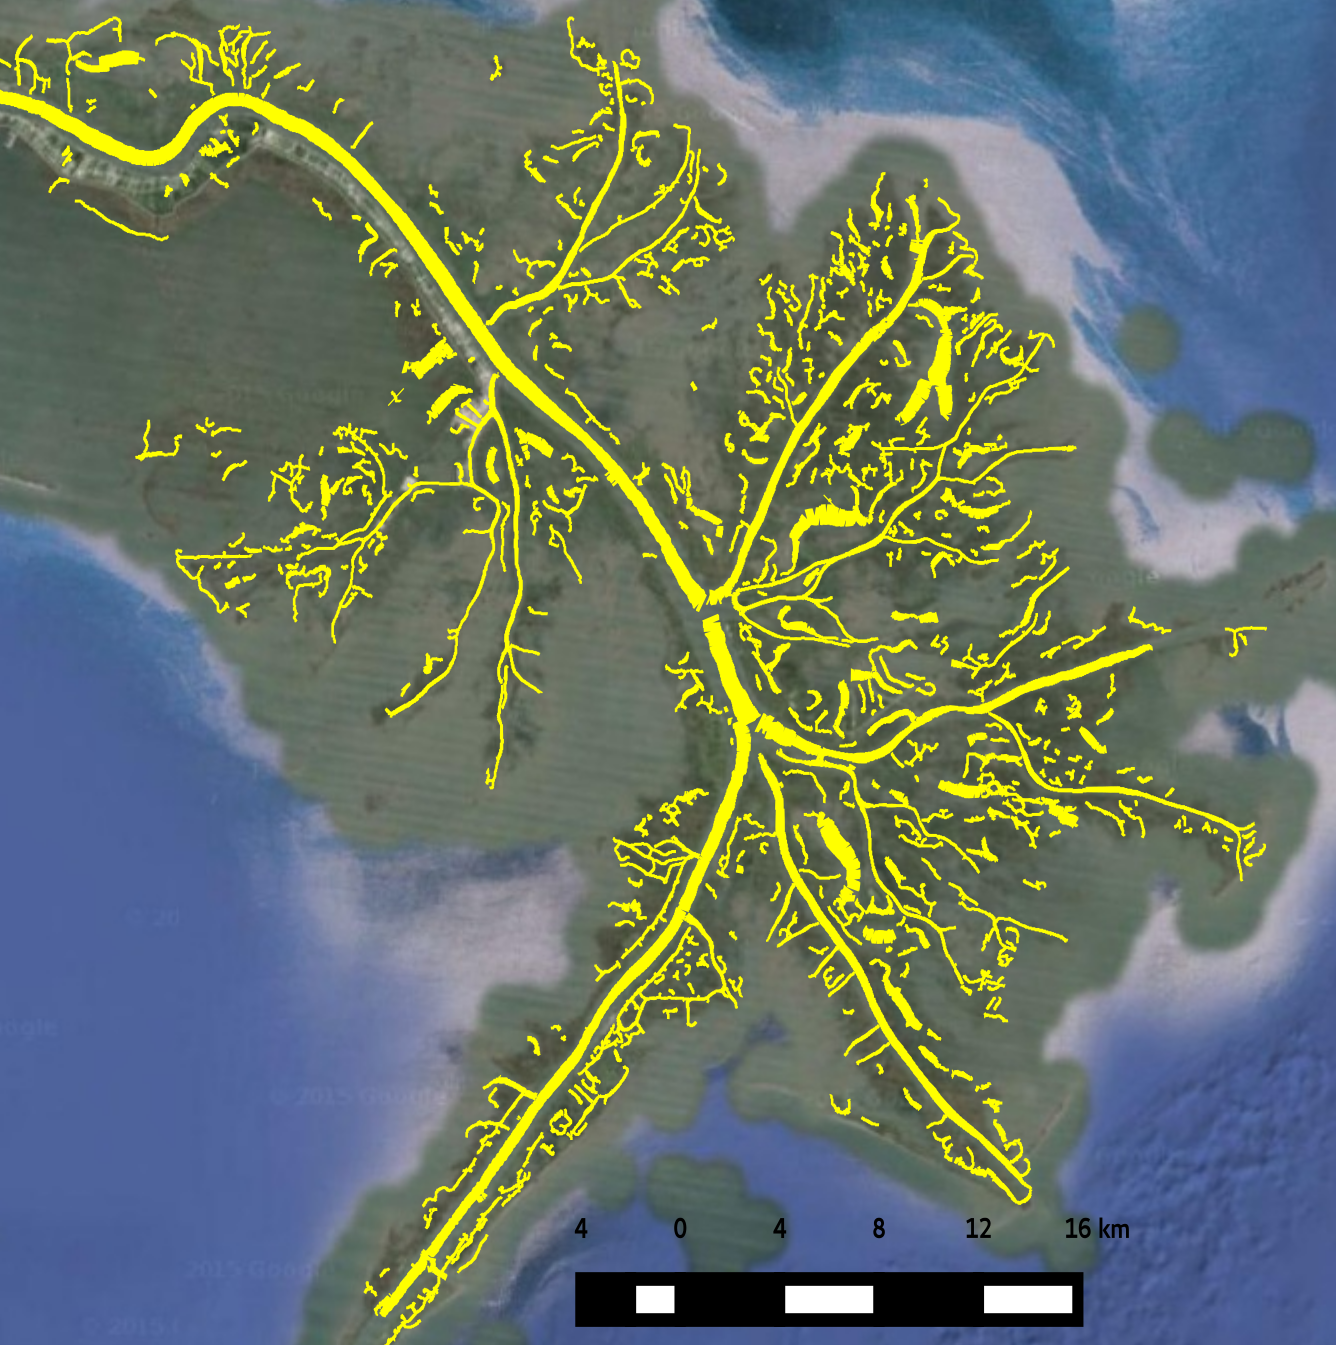
RivaMap: An Automated River Analysis and Mapping Engine

![]()
Related papers
- F. Isikdogan, A.C. Bovik, and P. Passalacqua, "RivaMap: an automated river analysis and mapping engine," Remote Sensing of Environment, Special Issue on Big Remotely Sensed Data, 2017. [Read at ScienceDirect], [PDF]
- F. Isikdogan, A.C. Bovik, and P. Passalacqua, "Automatic channel network extraction from remotely sensed images by singularity analysis," IEEE Geoscience and Remote Sensing Letters, 12, 11, 2218-2221, 2015. [Read at IEEExplore], [PDF]
Dependencies and Installation
Dependencies: * OpenCV 2.4 * Python 3.x * Numpy * Scipy * Matplotlib * GDAL * pyshp
Installing from PyPI:
$ sudo pip install rivamap
Installing from GitHub:
$ git clone https://github.com/isikdogan/rivamap.git
$ sudo python setup.py install
Example Use:
See example.ipynb
Example Results


Reference
|
Function |
Description |
|---|---|
|
preprocess.mndwi |
Computes the modified normalized difference water index.
Inputs:
Returns:
|
|
preprocess.contrastStretch |
Applies contrast stretch to an input image. Inputs and outputs an image. |
|
preprocess.im2double |
Converts image datatype to float. Inputs and outputs an image. |
|
preprocess.double2im |
Converts double data array to image. Inputs and outputs an image. |
|
singularity_index.SingularityIndexFilters |
Creates the filters that are needed for computing the modified multiscale singularity index response. The filters can be used for processing many input images once the filters are created.
Keyword arguments: |
|
singularity_index.applyMMSI |
Applies the filters to a given input image to compute the modified multiscale singularity index response. Estimates the width and the dominant orientation angle for each spatial location.
Inputs:
Returns: |
|
delineate.extractCenterlines |
Uses the previously computed singularity index response (psi) and the dominant orientation (orient) to extract centerlines.
Inputs: (can be obtained by running applyMMSI function)
Returns: |
|
delineate.thresholdCenterlines |
Uses a continuity-preserving hysteresis thresholding to classify centerlines.
Inputs:
Keyword Arguments:
Returns: |
|
georef.loadGeoMetadata |
Reads metadata from a GeoTIFF file.
Inputs:
Returns: |
|
georef.saveAsGeoTiff |
Saves a raster image as a GeoTIFF file
Inputs: |
|
georef.pix2lonlat |
Convers pixel coordinates into longitude and latitude.
Inputs:
Returns: |
|
georef.lonlat2pix |
Convers longitude and latitude into pixel coordinates.
Inputs:
Returns: |
|
georef.exportCSVfile |
Exports (coordinate, width) pairs to a comma separated text file.
Inputs: |
|
georef.exportShapeFile [NEW] |
Exports line segments to a ShapeFile.
Inputs: |
|
visualization.generateRasterMap |
Generates a raster map of channels. It draws a line of length w(x, y) and orientation θ(x, y) at each spatial location.
Inputs:
Keyword Arguments:
Returns: |
|
visualization.generateVectorMap |
Generates a vector map of channels. It draws a line of length w(x, y) and orientation θ(x, y) at each spatial location.
Inputs:
Keyword Arguments:
Returns: |
|
visualization.quiverPlot |
Generates a quiver plot that shows channel orientation and singularity index response strength.
Inputs:
Returns: |
Owner
- Name: Leo Isikdogan
- Login: isikdogan
- Kind: user
- Location: Cupertino, CA
- Website: http://www.isikdogan.com
- Repositories: 9
- Profile: https://github.com/isikdogan
GitHub Events
Total
- Issues event: 3
- Watch event: 5
- Push event: 1
Last Year
- Issues event: 3
- Watch event: 5
- Push event: 1
Committers
Last synced: 11 months ago
Top Committers
| Name | Commits | |
|---|---|---|
| Leo Isikdogan | l****o@i****m | 59 |
| jay | j****n@u****u | 14 |
Committer Domains (Top 20 + Academic)
Issues and Pull Requests
Last synced: 11 months ago
All Time
- Total issues: 10
- Total pull requests: 2
- Average time to close issues: 2 months
- Average time to close pull requests: about 2 hours
- Total issue authors: 9
- Total pull request authors: 1
- Average comments per issue: 1.6
- Average comments per pull request: 0.5
- Merged pull requests: 2
- Bot issues: 0
- Bot pull requests: 0
Past Year
- Issues: 2
- Pull requests: 0
- Average time to close issues: 1 minute
- Average time to close pull requests: N/A
- Issue authors: 2
- Pull request authors: 0
- Average comments per issue: 0.0
- Average comments per pull request: 0
- Merged pull requests: 0
- Bot issues: 0
- Bot pull requests: 0
Top Authors
Issue Authors
- unaschneck (2)
- shCampos (1)
- mossydidar (1)
- OmiDeLmI (1)
- lan-ling (1)
- elbeejay (1)
- huangjingyuan7 (1)
- LabSR-UT (1)
- GustavoWillyNagel (1)
Pull Request Authors
- elbeejay (2)
Top Labels
Issue Labels
Pull Request Labels
Packages
- Total packages: 1
-
Total downloads:
- pypi 4 last-month
- Total dependent packages: 0
- Total dependent repositories: 4
- Total versions: 2
- Total maintainers: 1
pypi.org: rivamap
An automated river analysis and mapping engine.
- Homepage: https://github.com/isikdogan/rivamap
- Documentation: https://rivamap.readthedocs.io/
-
Latest release: 1.1
published almost 3 years ago
Rankings
Maintainers (1)
Dependencies
- matplotlib *
- numpy *
- opencv-python *
- pyshp *
- scipy *
- gdal *
- matplotlib *
- numpy *
- scipy *