https://github.com/csinva/data-viz-utils
Functions for easily making publication-quality figures with matplotlib.
Science Score: 23.0%
This score indicates how likely this project is to be science-related based on various indicators:
-
○CITATION.cff file
-
✓codemeta.json file
Found codemeta.json file -
○.zenodo.json file
-
○DOI references
-
○Academic publication links
-
✓Committers with academic emails
2 of 2 committers (100.0%) from academic institutions -
○Institutional organization owner
-
○JOSS paper metadata
-
○Scientific vocabulary similarity
Low similarity (12.4%) to scientific vocabulary
Keywords
Keywords from Contributors
Repository
Functions for easily making publication-quality figures with matplotlib.
Basic Info
- Host: GitHub
- Owner: csinva
- License: mit
- Language: Jupyter Notebook
- Default Branch: master
- Homepage: https://csinva.io/data-viz-utils/
- Size: 9.88 MB
Statistics
- Stars: 19
- Watchers: 2
- Forks: 3
- Open Issues: 0
- Releases: 0
Topics
Metadata Files
readme.md
Data-viz utils 📈
Functions for data visualization in matplotlib
![]()


Can be installed using pip install dvu and then imported with import dvu.
You can also just copy the relatively short source code for the functions (easily viewable here).
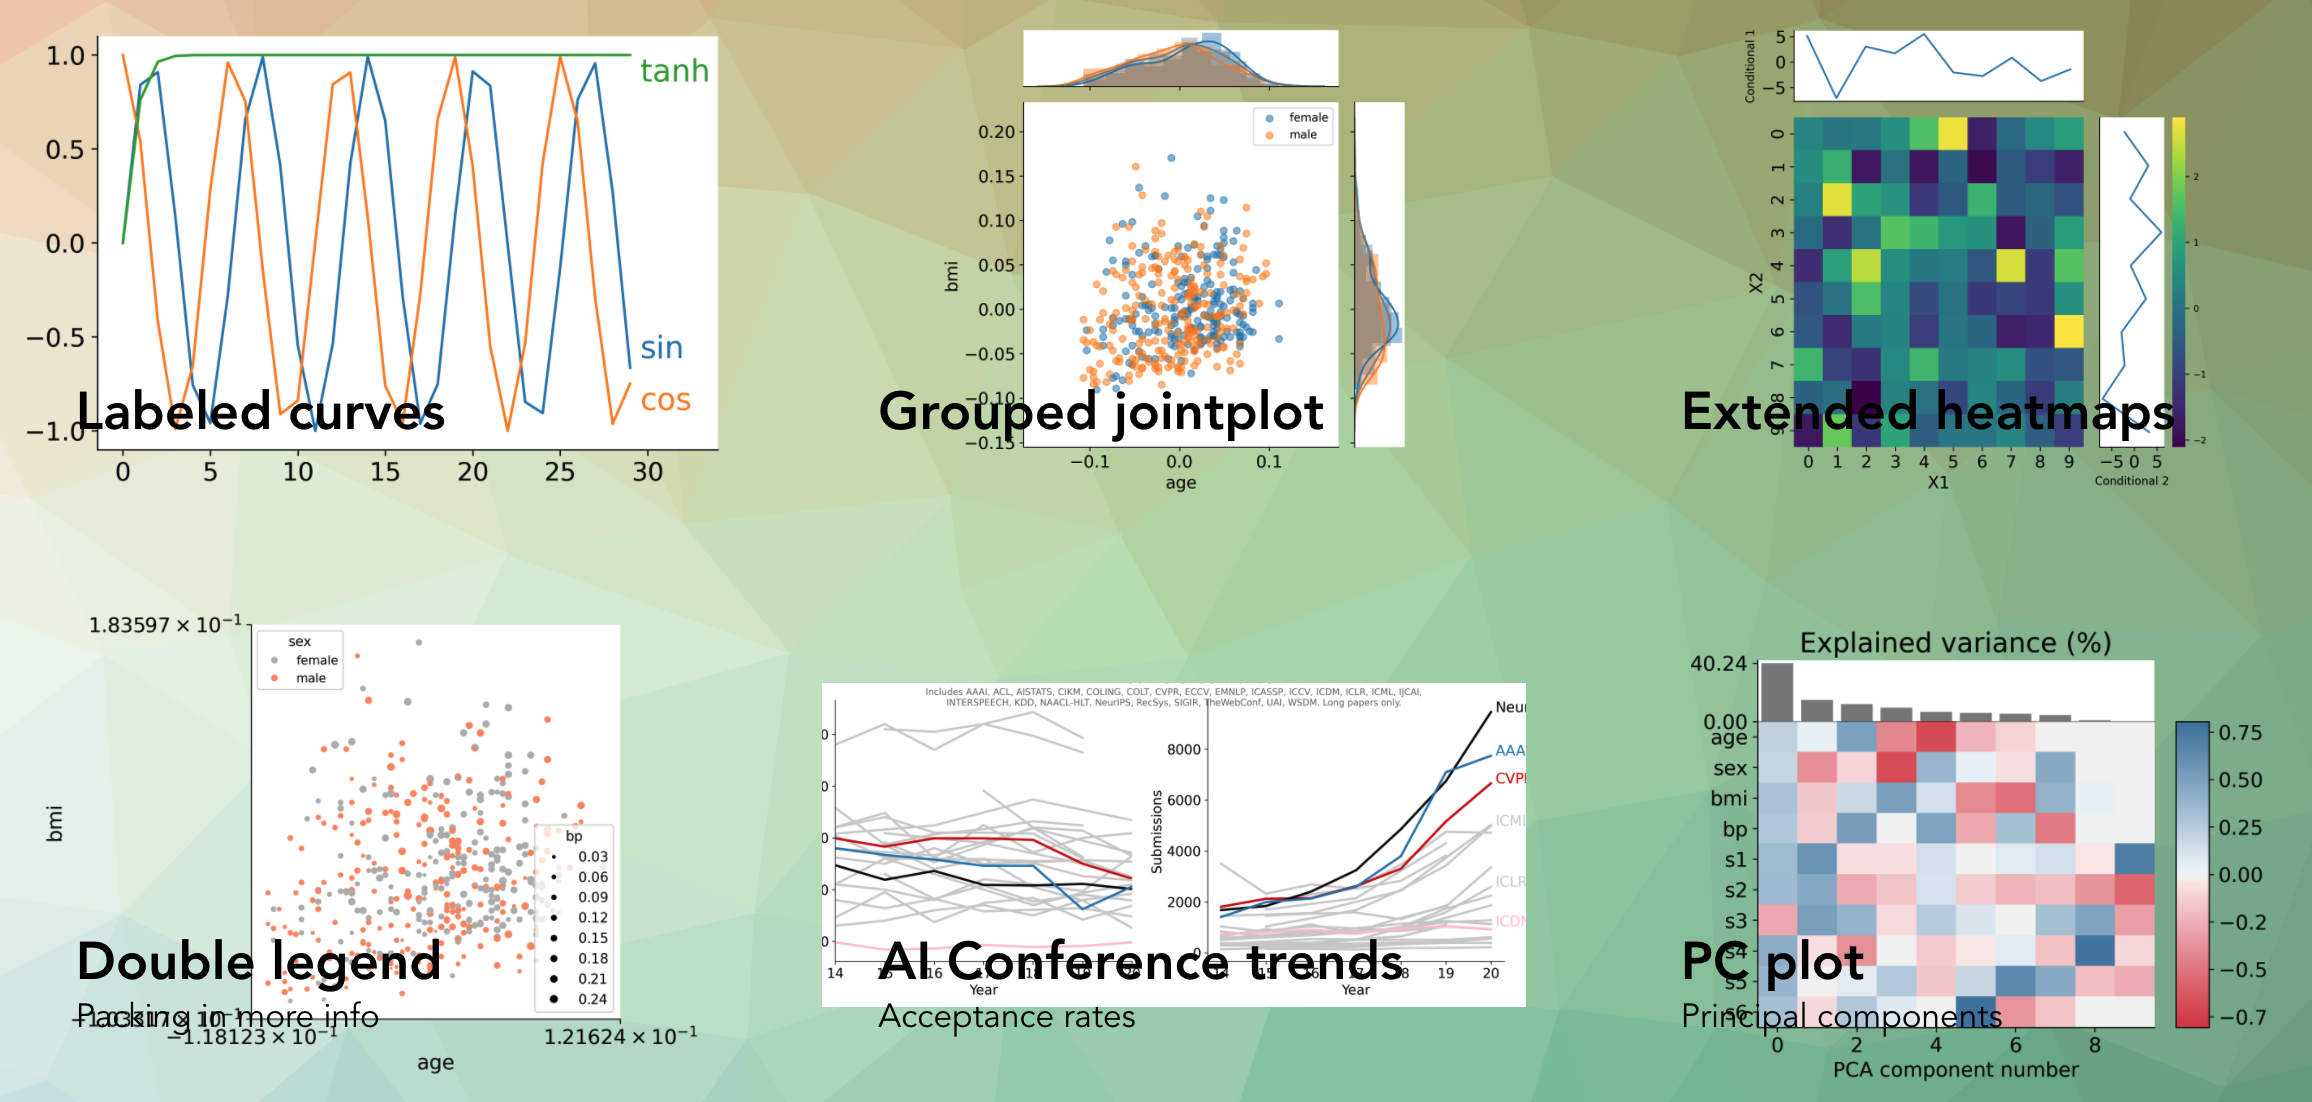
Helps create a bunch of different plots such as these:
One particularly useful function is dvu.line_legend() which replaces a typical matplotlib legend with labels for each line:
| Using plt.legend() | Using dvu.line_legend() |
| --------------------------------------------------- | ---------------------------------------------- |
|  |
|  |
|
Another one is dvu.invert_plot() which can be called after generating a plot to invert everything besides the line colors
| Original plot | After dvu.invert_plot() |
| ---------------------------------------------- | --------------------------------------------------- |
| |  |
|
Reference
- for updates, star the repo or follow @csinva_
- super-related and wonderful matplotlib-label-lines project
- PR for implementing line-labeling into matplotlib
- feel free to use openly!
- built with jekyll + github pages
- theme from here
- based off of this article from Codrops
Owner
- Name: Chandan Singh
- Login: csinva
- Kind: user
- Location: Microsoft research
- Company: Senior researcher
- Website: csinva.io
- Twitter: csinva_
- Repositories: 29
- Profile: https://github.com/csinva
Senior researcher @Microsoft interpreting ML models in science and medicine. PhD from UC Berkeley.
GitHub Events
Total
- Watch event: 1
Last Year
- Watch event: 1
Committers
Last synced: over 1 year ago
Top Committers
| Name | Commits | |
|---|---|---|
| Chandan Singh | c****h@b****u | 23 |
| keyan | k****3@b****u | 1 |
Committer Domains (Top 20 + Academic)
Issues and Pull Requests
Last synced: about 1 year ago
All Time
- Total issues: 0
- Total pull requests: 1
- Average time to close issues: N/A
- Average time to close pull requests: about 9 hours
- Total issue authors: 0
- Total pull request authors: 1
- Average comments per issue: 0
- Average comments per pull request: 0.0
- Merged pull requests: 1
- Bot issues: 0
- Bot pull requests: 0
Past Year
- Issues: 0
- Pull requests: 0
- Average time to close issues: N/A
- Average time to close pull requests: N/A
- Issue authors: 0
- Pull request authors: 0
- Average comments per issue: 0
- Average comments per pull request: 0
- Merged pull requests: 0
- Bot issues: 0
- Bot pull requests: 0
Top Authors
Issue Authors
Pull Request Authors
- keyan3 (1)
Top Labels
Issue Labels
Pull Request Labels
Packages
- Total packages: 1
-
Total downloads:
- pypi 162 last-month
- Total dependent packages: 1
- Total dependent repositories: 1
- Total versions: 3
- Total maintainers: 1
pypi.org: dvu
Functions for data visualization in matplotlib.
- Homepage: https://github.com/csinva/data-viz-utils
- Documentation: https://dvu.readthedocs.io/
- License: MIT License
-
Latest release: 0.0.2
published over 2 years ago
Rankings
Maintainers (1)
Dependencies
- adjustText *
- matplotlib *
- numpy *
- scikit-learn >=0.23.0
- seaborn *