https://github.com/spencerpresley/academicmetrics
AI-powered toolkit for analyzing and classifying academic research publications using LLMs and automated data collection. Output options: Mongodb database via providing your databse url. Json. Excel spreadsheet. See README for the quick setup, see documentation for implementation details.
Science Score: 26.0%
This score indicates how likely this project is to be science-related based on various indicators:
-
○CITATION.cff file
-
✓codemeta.json file
Found codemeta.json file -
✓.zenodo.json file
Found .zenodo.json file -
○DOI references
-
○Academic publication links
-
○Committers with academic emails
-
○Institutional organization owner
-
○JOSS paper metadata
-
○Scientific vocabulary similarity
Low similarity (9.1%) to scientific vocabulary
Keywords
Repository
AI-powered toolkit for analyzing and classifying academic research publications using LLMs and automated data collection. Output options: Mongodb database via providing your databse url. Json. Excel spreadsheet. See README for the quick setup, see documentation for implementation details.
Basic Info
- Host: GitHub
- Owner: SpencerPresley
- License: mit
- Language: Python
- Default Branch: master
- Homepage: https://academicmetrics.readthedocs.io/en/latest/
- Size: 44.3 MB
Statistics
- Stars: 3
- Watchers: 1
- Forks: 0
- Open Issues: 0
- Releases: 1
Topics
Metadata Files
README.md

Welcome to Academic Metrics


bash
pip install academic-metrics
What is Academic Metrics?
Academic Metrics is an AI-powered toolkit for collecting, classifying, and analyzing academic publications.
The system can be used to:
- Collect publication data from Crossref API based on institutional affiliation
- Classify research into NSF PhD research focus areas utilizing LLMs
- Extract and analyze themes and methodologies from abstracts
- Generate comprehensive analytics at article, author, and category levels
- Store results in MongoDB (local or live via atlas), local JSON files, and Excel files
[!TIP] Academic Metrics utilizes an early version of AIChainComposer for working with LLMs.
AIChainComposer is a powerful tool to quickly, easily, and efficiently build out programmatic workflows with LLMs.
AIChainComposer is now provided as a standalone package, and is available on PyPI, allowing you to use the same tools that allowed for the development of Academic Metrics in your own projects.
Table of Contents
- Welcome to Academic Metrics
- Table of Contents
- Features
- Documentation
- Example Site and Demo
- Installation and Setup Steps
- 0. External Setup
- 1. Installation
- 2. Creating the directory and necessary files
- 3. Virtual Environment (Optional but Recommended)
- 4. Environment Variables
- 5. Setting required environment variables
- 1. Open the
.envfile you just created, and add the following variables - 2. Retrieve and set your MongoDB URI
- 3. Set your database name
- 4. Set your OpenAI API Key
- 6. Using the package
- Option 1 (Short Script)
- Option 2 (Command Line Interface)
- Wrapping Up
Features
| Category | Features | Benefits |
|----------|----------|-----------|
| 📊 Data Collection | • Crossref API Integration
• Smart Web Scraping
• Automated DOI Processing
• Multi-Source Data Fusion | • Comprehensive data gathering
• Enhanced data completeness
• Reliable source tracking
• Efficient data collection |
| 🤖 AI Classification | • LLM-Powered Analysis
• NSF PhD Focus Areas
• Theme Extraction
• Methodology Detection | • Accurate categorization
• Standardized classifications
• Insightful themes
• Research trend analysis |
| 📈 Analytics Engine | • Citation Tracking
• Author Statistics
• Department Analytics
• Category Analysis | • Impact measurement
• Performance tracking
• Department insights
• Research trends |
| 💾 Data Management | • MongoDB Integration
• JSON Export
• Excel Reports
• Flexible Storage | • Scalable storage
• Easy data sharing
• Familiar formats
• Data accessibility |
| 🔄 Processing Pipeline | • Async Processing
• Error Handling
• Rate Limiting
• Retry Logic | • Fast performance
• Reliable operation
• API compliance
• Robust processing |
| 🎯 Research Metrics | • Citation Impact
• Author Collaboration
• Research Focus
• Publication Trends | • Research evaluation
• Collaboration insights
• Focus area tracking
• Trend analysis |
| 🛠️ Developer Tools | • AIChainComposer Integration
• Modular Design
• Extensive Documentation
• CLI Interface | • Easy LLM integration
• Simple customization
• Quick learning
• Flexible usage |
| 📱 Integration Ready | • Example Site
• Data Export
• Custom Endpoints | • Quick visualization
• Data portability
• System integration |
| 🔐 Security & Control | • API Key Management
• Rate Control
• Error Logging
• Data Validation | • Secure operation
• Resource protection
• Better monitoring
• Data integrity |
Documentation
To be able to see any and all implementation details regarding code logic, structure, prompts, and more you can check out our documentation. The documentation is built with Sphinx, allowing for easy use and a sense of famliarity.
Academic Metrics Documentation
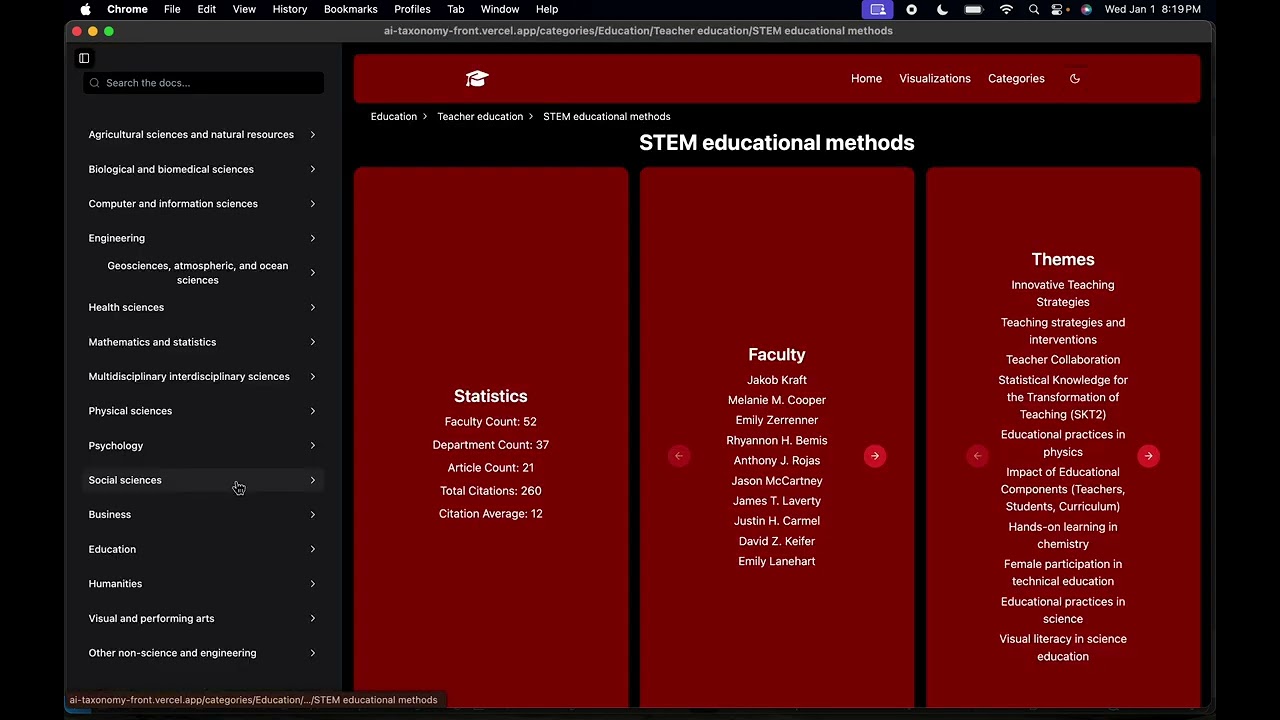
Example Site and Demo
We also built an example site with the data we collected so that you can get a small idea of the potential uses for the data. This is by no means the only use case, but it does serve as a nice introduction to decide if this package would be useful for you.
[!NOTE] The source code for the example site is available here
[!TIP] You can use our site source code for your own site! To easily launch your own website using the data you collect and classify via Academic Metrics see Site Creation Guide
To see a demo of the site, you can watch the below video:
Installation and Setup Steps
Hey all, Spencer here, we are pleased to announce as of January 1st, 2025, you can now install the Academic Metrics package via pip and easily run the entire system via a short script or command line interface.
Below is a step by step walkthrough of each piece of the process starting with installing python and setting up your environment, this is to help you get started if you are a non-technical user.
If you don't need help with starting steps such as python setup, mongodb setup, or virtual environment setup, or want to jump straight to the code, first see 1. Installation (or just install it via pip install academic-metrics), then skip to 6. Using the package.****
0. External Setup
Installing and setting up Python 3.12:
While you should be able to use any version of Python >= 3.7, we recommend using Python 3.12 as that is the version we used to develop the system, and the one it's been tested on.
For a detailed Python installation guide, see our Python Installation Guide.
Installing and setting up MongoDB:
For a detailed MongoDB installation and setup guide, see our MongoDB Installation Guide.
Once you have MongoDB installed and running, you can create a database to store your data in, if you haven't already.
To create a new database, you can run:
bash
use <db_name>
If you need more help, the MongoDB Installation Guide goes into more detail on how to create a database and verify it exists.
Collection creation is handled by the system, you do not need to create them.
1. Installation
Install academic_metrics>=1.0.98 via pip.
To install the latest version of the package, you can run the following command:
bash
pip install academic-metrics
2. Creating the directory and necessary files
- Create the directory and navigate into it:
For this example we will be using am_data_collection as the name of the directory, but you can name it whatever you want.
**All systems (seperate commands):**

```bash
mkdir am_data_collection
cd am_data_collection
```

Or as a single line:

**Linux / Mac / Windows Command Prompt**:

```bash
mkdir am_data_collection && cd am_data_collection
```

**Windows Powershell**:

```powershell
mkdir am_data_collection; cd am_data_collection
```
3. Virtual Environment (Optional but Recommended)
Now that you've created and entered your project directory, you can set up a virtual environment.
For detailed instructions on setting up and using virtual environments, see our Python Installation Guide - Virtual Environments Section.
After setting up your virtual environment, return here to continue with the next steps.
4. Environment Variables
Create a .env file inside the directory you just created.
Linux/Mac:
bash
touch .env
Windows (Command Prompt):
cmd
type nul > .env
Windows (PowerShell):
powershell
New-Item -Path .env -Type File
You should now have a .env file in your directory.
5. Setting required environment variables
1. Open the .env file you just created, and add the following variables
- a variable to store your MongoDB URI, I recommend
MONGODB_URI - a variable to store your database name, I recommend
DB_NAME - a variable to store your OpenAI API Key, I recommend
OPENAI_API_KEY
After each variable you should add ="" to the end of the variable.
Once you've done this, your .env file should look something like this:
python
MONGODB_URI=""
DB_NAME=""
OPENAI_API_KEY=""
2. Retrieve and set your MongoDB URI
For local MongoDB it's typically:
python
MONGODB_URI="mongodb://localhost:27017"
For live MongoDB:
For a live version you should use the MongoDB Atlas URI. It should look something like this:
bash
mongodb+srv://<username>:<password>@<cluster-name>.<unique-id>.mongodb.net/?retryWrites=true&w=majority&appName=<YourAppNameOnAtlas>
So in the .env file you should have something that looks like this:
Local:
python
MONGODB_URI="mongodb://localhost:27017"
Live:
python
MONGODB_URI="mongodb+srv://<username>:<password>@<cluster-name>.<unique-id>.mongodb.net/?retryWrites=true&w=majority&appName=<YourAppNameOnAtlas>"
[!WARNING] I recommend starting locally unless you need to use a live MongoDB instance. This will avoid the need to deal with setting up MongoDB Atlas, which while not difficult, it is an added step.
3. Set your database name
You can pick any name you want for DB_NAME, but it needs to be a name of a valid database on your mongodb server. To make one on the command line you can run:
bash
mongosh
use <db_name>
For this demonstration we will be using academic_metrics_data as the DB_NAME.
First we'll create the database on the command line:
bash
mongosh
use academic_metrics_data
This is to ensure the database actually exists so that the system can access it.
Now that the database exists, we'll set the DB_NAME in the .env file.
python
DB_NAME="academic_metrics_data"
4. Set your OpenAI API Key
If you do not have an OpenAI API key you will need to create one, but do not worry, it's easy.
Go to the following link and click on "+ Create new secret key":
https://platform.openai.com/api-keys
Give the key a name, and then copy the key.
Then in the .env file paste the key in the OPENAI_API_KEY variable.
It should look similar to this, but with the full key instead of sk-proj...:
python
OPENAI_API_KEY="sk-proj..."
[!IMPORTANT] You will need to add funds to your OpenAI account to use the API.
When using the default model for the system (gpt-4o-mini), it cost us about $3-4 dollars to process all of the data from Salisbury University from 2009-2024.
For larger models such as gpt-4o, the cost will be much higher.
We saw good results using gpt-4o-mini, and it's also the most cost effective. So I recommend starting with that.
Additionally, whether you opt to use our command line interface or your own script, the data is processed one month at a time and saved to the database, so if you run out of funds on your OpenAI account you will not lose data for the entire run, only the current month being processed. Simply add funds to your account and continue.
You do not have to change anything in the code once you run it again, the system checks for existing data and only processes data that has not yet been processed.
All together your .env file should look like this:
python
MONGODB_URI="mongodb://localhost:27017"
DB_NAME="academic_metrics_data"
OPENAI_API_KEY="sk-proj..."
6. Using the package
To use the system, you have 2 options:
Writing a short script (code provided) to loop over a range of dates you'd like to collect.
Using a provided function to run a command line interface version.
For most users, I recommend the second option, it's only a few lines of code which you can copy and paste, the rest of the usage is handled by the command line interface and doesn't require any additional coding, you can find the second option in the Option 2 (Command Line Interface) section.
On the other hand, if you plan on using the main system, or other tools within the package within your own scripts, or just don't enjoy using command line interfaces, I recommend the first option.
While I recommend the second option unless you're planning on using the package's offerings in a more complex manner, the basic code to run the system for the first option is provided in full in Option 1 (Short Script) section.
To see some examples of more complex use cases with examples, you can check out the Other Uses section.
Option 1 (Short Script)
For this option you need to do the following:
1. Create the python file
Within your directory, create a new python file, for this example we will be using run_am.py, but you can name it whatever you want.
Linux/Mac:
bash
touch run_am.py
Windows (Command Prompt):
cmd
type nul > run_am.py
Windows (PowerShell):
powershell
New-Item -Path run_am.py -Type File
You should now have a python file in your directory whose name matches the one you created.
2. Copy paste the following code into the file you just created
```python
dotenv is the python package responsible for handling env files
from dotenv import load_dotenv
os is used to get the environment variables from the .env file
import os
PipelineRunner is the main class used to run the pipeline
from academic_metrics.runners import PipelineRunner
load_dotenv is used to load the environment variables from the .env file
load_dotenv()
Get the environment variables from the .env file
aiapikey = os.getenv("OPENAIAPIKEY") mongodburi = os.getenv("MONGODBURI") dbname = os.getenv("DBNAME")
Set the date range you want to process
Years is a list of years as strings you want to process
Months is a list of strings representing the months you want processed for each year
For example if you want to process data from 2009-2024 for all months out of the year, you would do:
Note: the process runs left to right, so from beginning of list to the end of the list,
so this will process 2024, then 2023, then 2022, etc.
Data will be saved after each month is processed.
years = [ "2024", "2023", "2022", "2021", "2020", "2019", "2018", "2017", "2016", "2015", "2014", "2013", "2012", "2011", "2010", "2009", ] months = ["1", "2", "3", "4", "5", "6", "7", "8", "9", "10", "11", "12"]
Loop over the years and months and run the pipeline for each month
New objects are created for each month to avoid memory issues as well as to avoid overwriting data
for year in years: for month in months:
    # Create a new PipelineRunner object for each month
    # parameters:
    # ai_api_key: the OpenAI API key
    # crossref_affiliation: the affiliation to use for the Crossref API
    # data_from_month: the month to start collecting data from
    # data_to_month: the month to end collecting data on
    # data_from_year: the year to start collecting data from
    # data_to_year: the year to end collecting data on
    # mongodb_uri: the URL of the MongoDB server
    # db_name: the name of the database to use
    pipeline_runner = PipelineRunner(
        ai_api_key=ai_api_key,
        crossref_affiliation="Salisbury University",
        data_from_month=int(month),
        data_to_month=int(month),
        data_from_year=int(year),
        data_to_year=int(year),
        mongodb_uri=mongodb_uri,
        db_name=db_name,
    )

    # Run the pipeline for the current month
    pipeline_runner.run_pipeline()
```
If you'd like to save the data to excel files in addition to the other data formats, you can do so via importing the function get_excel_report from academic_metrics.runners and calling it at the end of the script.
Full code for convenience:
```python
dotenv is the python package responsible for handling env files
from dotenv import load_dotenv
os is used to get the environment variables from the .env file
import os
PipelineRunner is the main class used to run the pipeline
getexcelreport is the function used to save the data to excel files
it takes in a DatabaseWrapper object as a parameter, which connects to the database
and retrives the data before writing it to 3 seperate excel files. One for each data type.
from academicmetrics.runners import PipelineRunner, getexcel_report
DatabaseWrapper is the class used to connect to the database and retrieve the data
from academic_metrics.DB import DatabaseWrapper
load_dotenv is used to load the environment variables from the .env file
load_dotenv()
Get the environment variables from the .env file
If you used the same names as the ones in the examples, you can just copy paste these
if you used different names, you will need to change them to match the ones in your .env file
aiapikey = os.getenv("OPENAIAPIKEY") mongodburi = os.getenv("MONGODBURI") dbname = os.getenv("DBNAME")
Set the date range you want to process
Years is a list of years as strings you want to process
Months is a list of strings representing the months you want processed for each year
For example if you want to process data from 2009-2024 for all months out of the year, you would do:
Note: the process runs left to right, so from beginning of list to the end of the list,
so this will process 2024, then 2023, then 2022, etc.
Data will be saved after each month is processed.
years = [ "2024", "2023", "2022", "2021", "2020", "2019", "2018", "2017", "2016", "2015", "2014", "2013", "2012", "2011", "2010", "2009", ] months = ["1", "2", "3", "4", "5", "6", "7", "8", "9", "10", "11", "12"]
Loop over the years and months and run the pipeline for each month
New objects are created for each month
to avoid memory issues as well as to avoid overwriting data
for year in years: for month in months:
    # Create a new PipelineRunner object for each month
    # parameters:
    # ai_api_key: the OpenAI API key
    # crossref_affiliation: the affiliation to use for the Crossref API
    # data_from_month: the month to start collecting data from
    # data_to_month: the month to end collecting data on
    # data_from_year: the year to start collecting data from
    # data_to_year: the year to end collecting data on
    # mongodb_uri: the URL of the MongoDB server
    # db_name: the name of the database to use
    pipeline_runner = PipelineRunner(
        ai_api_key=ai_api_key,
        crossref_affiliation="Salisbury University",
        data_from_month=int(month),
        data_to_month=int(month),
        data_from_year=int(year),
        data_to_year=int(year),
        mongodb_uri=mongodb_uri,
        db_name=db_name,
    )

    # Run the pipeline for the current month
    pipeline_runner.run_pipeline()
Create a new DatabaseWrapper object so it can be given to getexcelreport
db = DatabaseWrapper(dbname=dbname, mongouri=mongodburi)
Call the getexcelreport function, passing in the db object, to save the data to excel files
Once this finishes running, you should have 3 excel files in your directory:
articledata.xlsx, facultydata.xlsx, and category_data.xlsx
getexcelreport(db) ```
3. Run the script
bash
python run_am.py
Option 2 (Command Line Interface)
For this options you will still need to create a python file, but the code will only be a couple lines long as you'll be passing in your arguments via the command line.
1. Create the python file
Within your directory, create a new python file, for this example we will be using run_am.py, but you can name it whatever you want.
Linux/Mac:
bash
touch run_am.py
Windows (Command Prompt):
cmd
type nul > run_am.py
Windows (PowerShell):
powershell
New-Item -Path run_am.py -Type File
You should now have a python file in your directory whose name matches the one you created.
2. Copy and paste the following code into the file you just created
```python from dotenv import loaddotenv from academicmetrics.runners import commandlinerunner
load_dotenv()
commandlinerunner() ```
[!WARNING] If you did not use
MONGODB_URIandOPENAI_API_KEYas the variable names in the .env file, you will need to make a couple changes to the above code.
How to use with different variable names:
The command_line_runner function takes in 2 optional arguments:
openai_api_key_env_var_namemongodb_uri_env_var_name
Which correspond to the names of the environment variables you used in your .env file.
To use the different names, do the following:
```python from dotenv import loaddotenv from academicmetrics.runners import commandlinerunner
load_dotenv()
The strings should be changes to match the names you used in your .env file
commandlinerunner( openaiapikeyenvvarname="YOUROPENAIAPIKEYENVVARNAME", mongodburienvvarname="YOURMONGODBURIENVVARNAME", ) ```
3. Run the script
For this option you will still run the script from command line, but you will also be passing in arguments, details laid out below.
There are various command line arguments you can pass in, almost all are detailed here, but to see a complete list you can run:
bash
python run_am.py --help
When running the script, you can configure the pipeline by passing in the following arguments:
--from-month- The month to start collecting data from, defaults to 1--to-month- The month to end collecting data on, defaults to 12--from-year- The year to start collecting data from, defaults to 2024--to-year- The year to end collecting data on, defaults to 2024--db-name- The name of the database to use (required)--crossref-affiliation- The affiliation to use for the Crossref API, defaults to Salisbury University (required)
If you want to save the data to excel files you can pass in the --as-excel argument.
[!NOTE] The
--as-excelargument is an additional action, it doesn't remove the the saving to other data formats, but merely adds the excel saving functionality.
Examples
Say you want to collect data for every month from 2019 to 2024 for Salisbury University and save it to excel files. You would run the following command:
bash
python run_am.py --from-month=1 \
--to-month=12 \
--from-year=2019 \
--to-year=2024 \
--crossref-affiliation="Salisbury University" \
--as-excel \
--db-name="Your_Database_Name"
To make this simpler, we can actually take advantage of the default values for some of the arguments.
Recall from before:
--from-monthdefaults to1--to-monthdefaults to12--from-yeardefaults to2024--to-yeardefaults to2024--crossref-affiliationdefaults toSalisbury University
Using the defaults, we can make that command much more concise:
bash
python run_am.py \
--from-year=2019 \
--as-excel \
--db-name="Your_Database_Name"
On AI Models:
The default AI (LLM) model used for all phases is gpt-4o-mini. You can specify a different model for each phase independently by passing in the following arguments:
--pre-classification-model- The model to use for the pre-classification step--classification-model- The model to use for the classification step--theme-model- The model to use for the theme extraction step
Here's how you would run the pipeline using the larger gpt-4o model:
bash
python run_am.py --from-month=1 \
--to-month=12 \
--from-year=2019 \
--to-year=2024 \
--crossref-affiliation="Salisbury University" \
--as-excel \
--db-name="Your_Database_Name" \
--pre-classification-model="gpt-4o" \
--classification-model="gpt-4o" \
--theme-model="gpt-4o"
and taking advantage of the defaults:
bash
python run_am.py \
--from-year=2019 \
--as-excel \
--db-name="Your_Database_Name" \
--pre-classification-model="gpt-4o" \
--classification-model="gpt-4o" \
--theme-model="gpt-4o"
[!WARNING] This process consumes a lot of tokens, and OpenAI API service usage is based off the number of input/output tokens used, with each model having different cost per input/output token.
You can check the cost of each model at https://openai.com/api/pricing/.
During testing we found that using
gpt-4o-miniwas the most cost effective.In addition we spent a lot of time testing prompts and models, our prompts have been tuned to a point where they elicit good results from
gpt-4o-mini, thus a larger model may not be necessary to get the results you want.If you want to use a larger model like
gpt-4o, whether it be out of curiosity or you want to see if it provides better results, I still recommend you start with a smaller date range to get an idea of what it will cost. If you find the cost to be acceptable, then you can start expanding the date range.
Other institutions:
Our system uses the Crossref API to collect available data, then it scrapes the DOI link to get any missing data as well as any additional data that may be available.
We found that the Crossref API sometimes misses some Abstracts for example, our scraping process will fill in nearly all, if not all, of the missing abstracts.
Due to this, and the wealth of institutions Crossref covers, you can use the system for any institution that has a DOI link.
Here's how you'd run the same query on the system but for University of Maryland data:
bash
python run_am.py \
--from-year=2019 \
--as-excel \
--db-name="Your_Database_Name" \
--crossref-affiliation="University of Maryland"
You can even go back as far as you want, for example say you want to collect all data from the beginning of the 21st century:
bash
python run_am.py \
--from-year=2000 \
--as-excel \
--db-name="Your_Database_Name" \
--crossref-affiliation="University of Maryland"
Or maybe you want to collect all data as far back as possible, so you can see longterm trends and history of the institution:
bash
python run_am.py \
--from-year=1900 \
--as-excel \
--db-name="Your_Database_Name" \
--crossref-affiliation="University of Maryland"
The from year does not require that there be data that far back, it simply means that is the cutoff point for the data you want to collect.
So say you're not entirely sure what year your University started, or aren't sure how far back Crossref covers, you can simply enter a very far back year, like 1900, and the system will collect all data from that year and onwards.
Wrapping Up
That's it! You've now successfully installed and run the system.
If you have any questions, need help, or have interest in collaborating on this project or others, feel free to reach out to me, contact information is provided below.
If you are a potential employer, please reach out to me by email or linkedin, contact information is provided below.
Contact information:
- Email: spencerpresley96@gmail.com
- LinkedIn: https://www.linkedin.com/in/spencerpresley96/
Happy coding!
Owner
- Name: Spencer Presley
- Login: SpencerPresley
- Kind: user
- Location: Salisbury, MD
- Repositories: 1
- Profile: https://github.com/SpencerPresley
Computer Science Major at Salisbury University | Class of 2025
GitHub Events
Total
- Release event: 1
- Watch event: 3
- Push event: 18
- Create event: 3
Last Year
- Release event: 1
- Watch event: 3
- Push event: 18
- Create event: 3
Committers
Last synced: about 1 year ago
Top Committers
| Name | Commits | |
|---|---|---|
| Spencer Presley | 1****y | 219 |
| Cole | c****2@g****m | 34 |
| Jude Maggitti | j****3@g****m | 1 |
| Cole Barbes | c****s@d****p | 1 |
Committer Domains (Top 20 + Academic)
Issues and Pull Requests
Last synced: 11 months ago
All Time
- Total issues: 0
- Total pull requests: 0
- Average time to close issues: N/A
- Average time to close pull requests: N/A
- Total issue authors: 0
- Total pull request authors: 0
- Average comments per issue: 0
- Average comments per pull request: 0
- Merged pull requests: 0
- Bot issues: 0
- Bot pull requests: 0
Past Year
- Issues: 0
- Pull requests: 0
- Average time to close issues: N/A
- Average time to close pull requests: N/A
- Issue authors: 0
- Pull request authors: 0
- Average comments per issue: 0
- Average comments per pull request: 0
- Merged pull requests: 0
- Bot issues: 0
- Bot pull requests: 0
Top Authors
Issue Authors
Pull Request Authors
Top Labels
Issue Labels
Pull Request Labels
Packages
- Total packages: 1
-
Total downloads:
- pypi 184 last-month
- Total dependent packages: 0
- Total dependent repositories: 0
- Total versions: 20
- Total maintainers: 1
pypi.org: academic-metrics
A tool to extract and format academic data from Web of Science and Crossref
- Homepage: https://github.com/SpencerPresley/AcademicMetrics
- Documentation: https://academic-metrics.readthedocs.io/
- License: MIT License
-
Latest release: 1.0.99
published over 1 year ago