https://github.com/nixtla/tsfeatures
Calculates various features from time series data. Python implementation of the R package tsfeatures.
Science Score: 13.0%
This score indicates how likely this project is to be science-related based on various indicators:
-
○CITATION.cff file
-
✓codemeta.json file
Found codemeta.json file -
○.zenodo.json file
-
○DOI references
-
○Academic publication links
-
○Committers with academic emails
-
○Institutional organization owner
-
○JOSS paper metadata
-
○Scientific vocabulary similarity
Low similarity (12.9%) to scientific vocabulary
Keywords
Repository
Calculates various features from time series data. Python implementation of the R package tsfeatures.
Basic Info
Statistics
- Stars: 421
- Watchers: 9
- Forks: 45
- Open Issues: 8
- Releases: 11
Topics
Metadata Files
README.md
![]()
![]()
![]()
![]()
tsfeatures
Calculates various features from time series data. Python implementation of the R package tsfeatures.
Installation
You can install the released version of tsfeatures from the Python package index with:
python
pip install tsfeatures
Usage
The tsfeatures main function calculates by default the features used by Montero-Manso, Talagala, Hyndman and Athanasopoulos in their implementation of the FFORMA model.
python
from tsfeatures import tsfeatures
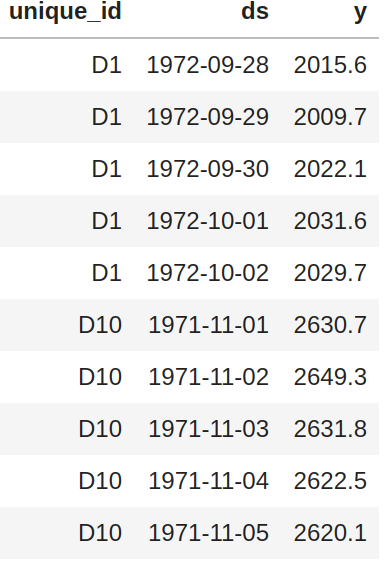
This function receives a panel pandas df with columns unique_id, ds, y and optionally the frequency of the data.
python
tsfeatures(panel, freq=7)
By default (freq=None) the function will try to infer the frequency of each time series (using infer_freq from pandas on the ds column) and assign a seasonal period according to the built-in dictionary FREQS:
python
FREQS = {'H': 24, 'D': 1,
         'M': 12, 'Q': 4,
         'W':1, 'Y': 1}
You can use your own dictionary using the dict_freqs argument:
python
tsfeatures(panel, dict_freqs={'D': 7, 'W': 52})
List of available features
| Features ||| |:--------|:------|:-------------| |acffeatures|heterogeneity|serieslength| |archstat|holtparameters|sparsity| |countentropy|hurst|stability| |crossingpoints|hwparameters|stlfeatures| |entropy|intervals|unitrootkpss| |flatspots|lumpiness|unitrootpp| |frequency|nonlinearity|| |guerrero|pacffeatures||
See the docs for a description of the features. To use a particular feature included in the package you need to import it:
```python from tsfeatures import acf_features
tsfeatures(panel, freq=7, features=[acf_features]) ```
You can also define your own function and use it together with the included features:
```python def number_zeros(x, freq):
number = (x == 0).sum()
return {'number_zeros': number}
tsfeatures(panel, freq=7, features=[acffeatures, numberzeros]) ```
tsfeatures can handle functions that receives a numpy array x and a frequency freq (this parameter is needed even if you don't use it) and returns a dictionary with the feature name as a key and its value.
R implementation
You can use this package to call tsfeatures from R inside python (you need to have installed R, the packages forecast and tsfeatures; also the python package rpy2):
```python from tsfeatures.tsfeaturesr import tsfeaturesr
tsfeaturesr(panel, freq=7, features=["acffeatures"]) ```
Observe that this function receives a list of strings instead of a list of functions.
Comparison with the R implementation (sum of absolute differences)
Non-seasonal data (100 Daily M4 time series)
| feature | diff | feature | diff | feature | diff | feature | diff | |:----------------|-------:|:----------------|-------:|:----------------|-------:|:----------------|-------:| | eacf10 | 0 | eacf1 | 0 | diff2acf1 | 0 | alpha | 3.2 | | seasonalperiod | 0 | spike | 0 | diff1acf10 | 0 | archacf | 3.3 | | nperiods | 0 | curvature | 0 | xacf1 | 0 | beta | 4.04 | | linearity | 0 | crossingpoints | 0 | nonlinearity | 0 | garchr2 | 4.74 | | hwgamma | 0 | lumpiness | 0 | diff2xpacf5 | 0 | hurst | 5.45 | | hwbeta | 0 | diff1xpacf5 | 0 | unitrootkpss | 0 | garchacf | 5.53 | | hwalpha | 0 | diff1acf10 | 0 | xpacf5 | 0 | entropy | 11.65 | | trend | 0 | archlm | 0 | xacf10 | 0 | | flatspots | 0 | diff1acf1 | 0 | unitrootpp | 0 | | serieslength | 0 | stability | 0 | arch_r2 | 1.37 |
To replicate this results use:
console
python -m tsfeatures.compare_with_r --results_directory /some/path
                                    --dataset_name Daily --num_obs 100
Sesonal data (100 Hourly M4 time series)
| feature | diff | feature | diff | feature | diff | feature | diff | |:------------------|-------:|:-------------|-----:|:----------|--------:|:-----------|--------:| | serieslength | 0 |seasacf1 | 0 | trend | 2.28 | hurst | 26.02 | | flatspots | 0 |xacf1|0| archr2 | 2.29 | hwbeta | 32.39 | | nperiods | 0 |unitrootkpss|0| alpha | 2.52 | trough | 35 | | crossingpoints | 0 |nonlinearity|0| beta | 3.67 | peak | 69 | | seasonalperiod | 0 |diff1acf10|0| linearity | 3.97 | | lumpiness | 0 |xacf10|0| curvature | 4.8 | | stability | 0 |seaspacf|0| eacf10 | 7.05 | | archlm | 0 |unitrootpp|0| garchr2 | 7.32 | | diff2acf1 | 0 |spike|0| hwgamma | 7.32 | | diff2acf10 | 0 |seasonalstrength|0.79| hwalpha | 7.47 | | diff1acf1 | 0 |eacf1|1.67| garchacf | 7.53 | | diff2xpacf5 | 0 |archacf|2.18| entropy | 9.45 |
To replicate this results use:
console
python -m tsfeatures.compare_with_r --results_directory /some/path \
                                    --dataset_name Hourly --num_obs 100
Authors
- Federico Garza - FedericoGarza
- Kin Gutierrez - kdgutier
- Cristian Challu - cristianchallu
- Jose Moralez - jose-moralez
- Ricardo Olivares - rolivaresar
- Max Mergenthaler - mergenthaler
Owner
- Name: Nixtla
- Login: Nixtla
- Kind: organization
- Email: ops@nixtla.io
- Location: United States of America
- Website: https://www.nixtla.io/
- Twitter: nixtlainc
- Repositories: 13
- Profile: https://github.com/Nixtla
Open Source Time Series Ecosystem
GitHub Events
Total
- Issues event: 2
- Watch event: 58
- Issue comment event: 10
- Fork event: 2
Last Year
- Issues event: 2
- Watch event: 58
- Issue comment event: 10
- Fork event: 2
Committers
Last synced: over 2 years ago
Top Committers
| Name | Commits | |
|---|---|---|
| Fede | f****z@g****m | 184 |
| José Morales | j****s@g****m | 6 |
| FedericoGarza | F****a@g****m | 2 |
| rolivaresar | o****o@g****m | 1 |
Committer Domains (Top 20 + Academic)
Issues and Pull Requests
Last synced: 11 months ago
All Time
- Total issues: 21
- Total pull requests: 21
- Average time to close issues: about 2 months
- Average time to close pull requests: 11 days
- Total issue authors: 17
- Total pull request authors: 4
- Average comments per issue: 1.48
- Average comments per pull request: 0.38
- Merged pull requests: 18
- Bot issues: 0
- Bot pull requests: 0
Past Year
- Issues: 1
- Pull requests: 0
- Average time to close issues: 18 minutes
- Average time to close pull requests: N/A
- Issue authors: 1
- Pull request authors: 0
- Average comments per issue: 2.0
- Average comments per pull request: 0
- Merged pull requests: 0
- Bot issues: 0
- Bot pull requests: 0
Top Authors
Issue Authors
- AzulGarza (3)
- FedericoGarza (3)
- ngupta23 (1)
- Saina199 (1)
- AlbertoAlmuinha (1)
- chillerobscuro (1)
- Pascal66 (1)
- rpanai (1)
- nrcjea001 (1)
- fgvenegas (1)
- iLampard (1)
- david-waterworth (1)
- ltsaprounis (1)
- Jean-Reinhold (1)
- ronkremser (1)
Pull Request Authors
- FedericoGarza (13)
- jope35 (3)
- tracykteal (2)
- rolivaresar (2)
Top Labels
Issue Labels
Pull Request Labels
Packages
- Total packages: 3
-
Total downloads:
- pypi 30,373 last-month
-
Total dependent packages: 3
(may contain duplicates) -
Total dependent repositories: 3
(may contain duplicates) - Total versions: 22
- Total maintainers: 3
pypi.org: tsfeatures
Calculates various features from time series data.
- Homepage: https://github.com/Nixtla/tsfeatures
- Documentation: https://tsfeatures.readthedocs.io/
- License: MIT License
-
Latest release: 0.4.5
published about 3 years ago
Rankings
Maintainers (3)
proxy.golang.org: github.com/nixtla/tsfeatures
- Documentation: https://pkg.go.dev/github.com/nixtla/tsfeatures#section-documentation
- License: apache-2.0
-
Latest release: v0.4.5
published about 3 years ago
Rankings
proxy.golang.org: github.com/Nixtla/tsfeatures
- Documentation: https://pkg.go.dev/github.com/Nixtla/tsfeatures#section-documentation
- License: apache-2.0
-
Latest release: v0.4.5
published about 3 years ago
Rankings
Dependencies
- antropy >=0.1.4
- arch >=4.14
- pandas >=1.0.5
- scikit-learn >=0.23.1
- statsmodels >=0.12.2
- supersmoother >=0.4
- antropy >=0.1.4
- arch >=4.11
- pandas >=1.0.5
- scikit-learn >=0.23.1
- statsmodels >=0.12.2
- supersmoother >=0.4
- actions/checkout v2 composite
- actions/setup-python v2 composite
- actions/checkout v2 composite
- actions/setup-python v2 composite