https://github.com/atomiechen/matsense
A toolkit for matrix sensor data processing 阵列传感器数据处理工具库
Science Score: 26.0%
This score indicates how likely this project is to be science-related based on various indicators:
-
○CITATION.cff file
-
✓codemeta.json file
Found codemeta.json file -
✓.zenodo.json file
Found .zenodo.json file -
○DOI references
-
○Academic publication links
-
○Committers with academic emails
-
○Institutional organization owner
-
○JOSS paper metadata
-
○Scientific vocabulary similarity
Low similarity (12.7%) to scientific vocabulary
Keywords
Repository
A toolkit for matrix sensor data processing 阵列传感器数据处理工具库
Basic Info
- Host: GitHub
- Owner: atomiechen
- Language: Python
- Default Branch: main
- Homepage: https://pypi.org/project/MatSense/
- Size: 546 KB
Statistics
- Stars: 5
- Watchers: 1
- Forks: 0
- Open Issues: 0
- Releases: 4
Topics
Metadata Files
README.md
MatSense

A toolkit that supports both real-time and off-line matrix sensor data processing and 3D visualization.

A typical real-time data flow would be in a client-server manner:
- Matrix sensor data: collected (e.g. by Arduino) and transmitted via a serial port to the computer.
- Data processing: the series of matrix data frames are processed and served by the server.
- Applications: clients connect to server to get processed data and do further work.
Data can also be recorded to and processed from files.
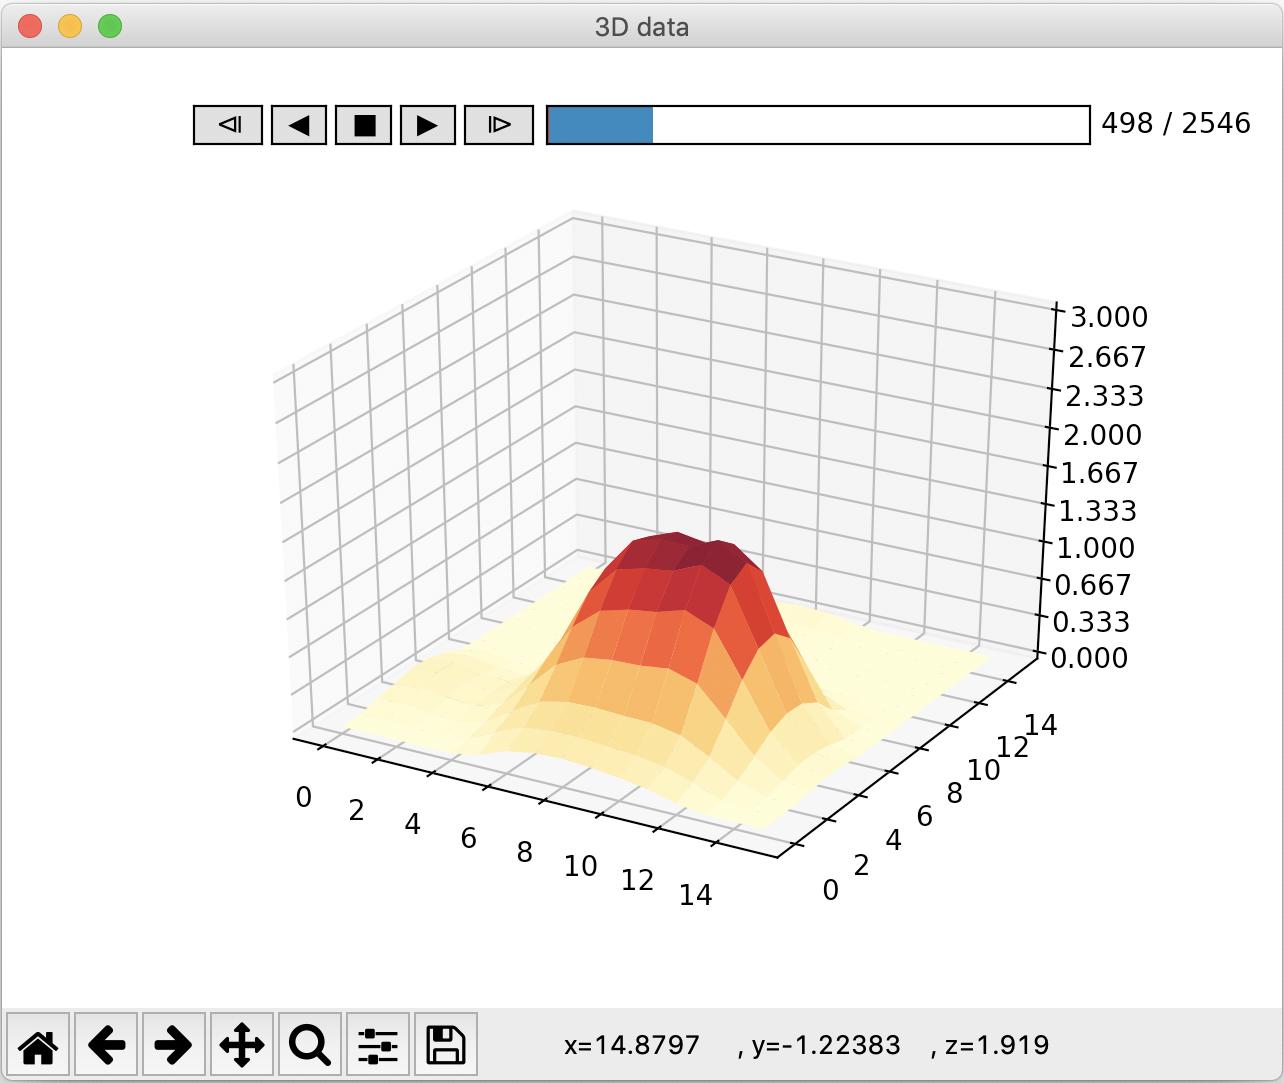
3D visualization tools are provided to play real-time stream or recorded data.
Installation
From PyPI:
sh
pip install MatSense
This will install Matplotlib to implement 3D visualization tools.
If you want to further try PyQtGraph as visualization method:
sh
pip install MatSense[pyqtgraph]
Usage
Off-the-shelf tools
3 handy tools are provided. Pass -h to get detailed information.
matserver/python -m matsense.server- functions:
- receive data from serial port, process and serve
- process data from file(s) and output to file
- other helpful functions
- supported processing methods:
- voltage-pressure conversion (optional for pressure data)
- spatial filter (in-frame denoising): none, ideal, butterworth, gaussian
- temporal filter (pixel-wise between-frame denoising): none, moving average, rectangular window
- calibration: static or dynamic
matclient/python -m matsense.client: receive server data, process and visualize; or control server via interactive commands- supported processing methods:
- interpolation
- blob parsing
matdata/python -m matsense.data: visualize file data, or process off-line data
Configuration
All 3 tools can be totally configured by a YAML configuration file:
```sh
server console
matserver --config your_config.yaml
client console
matclient --config your_config.yaml
off-line data processing
matdata --config your_config.yaml ```
Priority: commandline arguments > config file > program defaults.
A template YAML configuration (unused options can be set to ~ or removed):
```yaml
template configurations
~ for defaults
configurations for matserver mode
server_mode: ## enable backend service service: ~ ## enable visualization or not (suppress service) visualize: ~ ## enumerate all serial ports enumerate: ~
## (suppress serial) simulated data source without actual serial connection ## debug mode: true, false debug: ~
## (suppress serial) use file as data source or not: true, false use_file: ~
configurations for matclient mode
client_mode: ## make client present raw data raw: ~ ## interactive command line mode interactive: ~
configurations for matdata mode
data_mode: ## process file data instead of visualization process: ~
configurations for file data
data: ## input filename(s), filename or a list of filenames: [a.csv, b.csv, ...] infilenames: ~ ## output filename, default filename is used when not provided outfilename: ~
configurations for matrix sensor
sensor: ## sensor shape: [16, 16], [8, 8], [6, 24] shape: ~ ## total points, can be set to ~ total: ~ ## 0/1 mask to exclude non-existent points ## |- for multiline without a newline in the end mask: ~
configurations for serial port
serial: ## baudrate: 9600, 250000, 500000, 1000000 baudrate: ~ ## serial port timeout, in seconds timeout: ~ ## serial port port: ~ ## data transmission protocol: simple, secure protocol: ~ ## support IMU data imu: ~
configurations for client-server connections
connection: ## use UDP or UNIX domain socket udp: ~ ## udp address format: 127.0.0.1:20503 ## UNIX deomain socket address format: /var/tmp/unix.socket.server serveraddress: ~ clientaddress: ~
configurations for data processing
process: ### voltage to the reciprocal of resistance ## reference voltage: 255, 255/3.6*3.3 V0: ~ ## constant factor: 1 R0_RECI: ~ ## convert voltage to resistance: true convert: ~
### server data processing ## no filtering and calibration raw: ~ ## time of warming up in seconds: 1 warmup: ~ ## spatial filter: none, ideal, butterworth, gaussian filterspatial: ~ ## spatial filter cut-off freq: 3.5 filterspatialcutoff: ~ ## Butterworth filter order: 2 butterworthorder: ~ ## temporal filter: none, moving average, rectangular window filtertemporal: ~ ## temporal filter size: 15 filtertemporalsize: ~ ## rectangular window filter cut-off frequency: 0.04 rwcutoff: ~ ## calibrative frames, 0 for no calibration: 0, 200 califrames: ~ ## calibration frame window size, 0 for static and >0 for dynamic: 0, 10000 caliwinsize: ~ ## intermediate result: 0, 1, 2 ## 0: convert voltage to reciprocal resistance ## 1: convert & spatial filter ## 2: convert & spatial filter & temporal filter intermediate: ~
### (optional) client data processing ## interpolation shape, default to sensor.shape interp: ~ ## interpolation order: 3 interporder: ~ ## filter out blobs: true blob: ~ ## total blob number: 3 blobnum: ~ ## blob filter threshole: 0.1, 0.15 threshold: ~ ## special check for certain hardwares: false special_check: ~
pointing: ## value bound for checking cursor moving state: 0 bound: ~ ## directly map coordinates or relatively (suppress trackpoint) direct_map: ~ ## use ThinkPad's TrackPoint (red dot) control style trackpoint: ~ ## smoothing alpha: ~
configurations for visualization
visual: ## using pyqtgraph or matplotlib pyqtgraph: ~ ## z-axis limit: 3, 5 zlim: ~ ## frame rate: 100 fps: ~ ## scatter plot: false scatter: ~ ## show text value: false show_value: ~ ```
Useful modules
matsense.uclientUclient: interface to receive data from server
matsense.process: data processing toolsDataHandlerPressure: process pressure data (conversion & filtering & calibration)BlobParserInterpolatorPointSmootherCursorControllerPressureSelector
matsense.datasetter: data setter, using serial port or file dataDataSetterSerialDataSetterFile
matense.tools: configuration and other helpful toolsmatsense.filemanager: file I/O toolsmatsense.visual: visualization toolsfrom matsense.visual.player_matplot import Player3DMatplot: 3D player using Matplotlibfrom matsense.visual.player_pyqtgraph import Player3DPyqtgraph: 3D player using PyQtGraph
Server-Client Protocol
Use matclient -i to control server.
The underlying server-client communication protocol is:
| Name | meaning | Value | Format | Return | Return format | | ------------ | ------------------------------------- | ------------------ | ------------ | -------------------- | -------------- | | CLOSE | close server | 0 | 1byte | status | 1byte | | DATA | get a data frame | 1 | 1byte | frame+index | 256double+1int | | RAW | get a raw data frame | 2 | 1byte | frame+index | 256double+1int | | RECDATA | ask server to record data to file | 3(+filename) | 1byte+string | status+filename | 1byte+string | | RECRAW | ask server to record raw data to file | 4(+filename) | 1byte+string | status+filename | 1byte+string | | RECSTOP | ask server to stop recording | 5 | 1byte | status | 1byte | | RESTART | restart server with config string | 6(+configstr) | 1byte+string | status+configstring | 1byte+string | | RESTARTFILE | restart server with config filename | 10+configfilename | 1byte+string | status+configstring | 1byte+string | | CONFIG | get server config | 7 | 1byte | status+configstring | 1byte+string | | DATAIMU | get IMU data | 9 | 1byte | IMU_frame+index | 6double+1int |
status(1 byte): 0 for success and 255 for failure
Author
Atomie CHEN: atomic_cwh@163.com
Owner
- Name: Atomie CHEN
- Login: atomiechen
- Kind: user
- Company: Tsinghua University
- Repositories: 29
- Profile: https://github.com/atomiechen
GitHub Events
Total
Last Year
Committers
Last synced: over 3 years ago
All Time
- Total Commits: 77
- Total Committers: 1
- Avg Commits per committer: 77.0
- Development Distribution Score (DDS): 0.0
Top Committers
| Name | Commits | |
|---|---|---|
| Atomie CHEN | a****h@1****m | 77 |
Committer Domains (Top 20 + Academic)
Issues and Pull Requests
Last synced: 11 months ago
All Time
- Total issues: 0
- Total pull requests: 2
- Average time to close issues: N/A
- Average time to close pull requests: less than a minute
- Total issue authors: 0
- Total pull request authors: 1
- Average comments per issue: 0
- Average comments per pull request: 0.0
- Merged pull requests: 2
- Bot issues: 0
- Bot pull requests: 0
Past Year
- Issues: 0
- Pull requests: 2
- Average time to close issues: N/A
- Average time to close pull requests: less than a minute
- Issue authors: 0
- Pull request authors: 1
- Average comments per issue: 0
- Average comments per pull request: 0.0
- Merged pull requests: 2
- Bot issues: 0
- Bot pull requests: 0
Top Authors
Issue Authors
Pull Request Authors
- atomiechen (4)
Top Labels
Issue Labels
Pull Request Labels
Packages
- Total packages: 1
-
Total downloads:
- pypi 28 last-month
- Total dependent packages: 0
- Total dependent repositories: 1
- Total versions: 6
- Total maintainers: 1
pypi.org: matsense
A toolkit for matrix sensor data processing 阵列传感器数据处理工具库
- Homepage: https://github.com/atomiechen/MatSense
- Documentation: https://matsense.readthedocs.io/
-
Latest release: 0.4.1
published about 2 years ago
Rankings
Maintainers (1)
Dependencies
- Optional *
- PyYAML >=5.4.1
- matplotlib >=3.3
- numpy >=1.19.2
- pyparsing >=2.4.7
- pyserial >=3.5
- scipy >=1.5.4