https://github.com/holoviz/holoviews
With Holoviews, your data visualizes itself.
Science Score: 36.0%
This score indicates how likely this project is to be science-related based on various indicators:
-
○CITATION.cff file
-
✓codemeta.json file
Found codemeta.json file -
✓.zenodo.json file
Found .zenodo.json file -
○DOI references
-
○Academic publication links
-
✓Committers with academic emails
13 of 150 committers (8.7%) from academic institutions -
○Institutional organization owner
-
○JOSS paper metadata
-
○Scientific vocabulary similarity
Low similarity (9.1%) to scientific vocabulary
Keywords
Keywords from Contributors
Repository
With Holoviews, your data visualizes itself.
Basic Info
- Host: GitHub
- Owner: holoviz
- License: bsd-3-clause
- Language: Python
- Default Branch: main
- Homepage: https://holoviews.org
- Size: 33.7 MB
Statistics
- Stars: 2,819
- Watchers: 55
- Forks: 406
- Open Issues: 1,099
- Releases: 85
Topics
Metadata Files
README.md
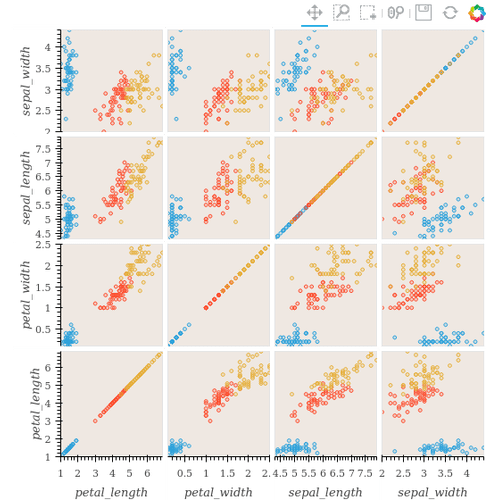
 HoloViews
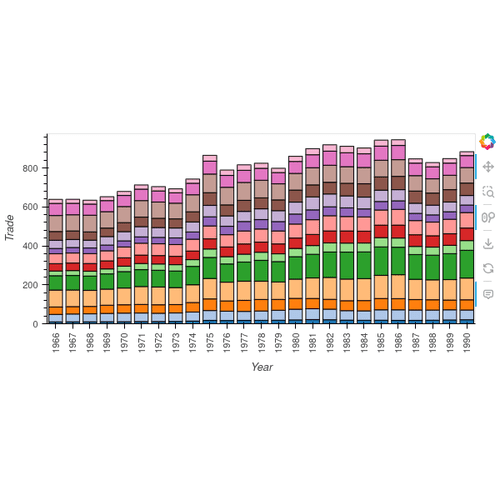
Stop plotting your data - annotate your data and let it visualize itself.
| | |
| --- | --- |
| Downloads | 
![]() | Build Status |
| Build Status | ![]() |
| Coverage |
|
| Coverage | ![]() |
| Latest dev release |
|
| Latest dev release | 
 |
| Latest release |
|
| Latest release | 


 |
| Python |
|
| Python |  |
| Docs |
|
| Docs | ![]()
 |
| Binder |
|
| Binder | ![]() |
| Support |
|
| Support | 
HoloViews is an open-source Python library designed to make data analysis and visualization seamless and simple. With HoloViews, you can usually express what you want to do in very few lines of code, letting you focus on what you are trying to explore and convey, not on the process of plotting.
Check out the HoloViews web site for extensive examples and documentation.
Installation
HoloViews works with Python on Linux, Windows, or Mac, and works seamlessly with Jupyter Notebook and JupyterLab.
You can install HoloViews either with conda or pip, for more information see the install guide.
conda install holoviews

pip install holoviews
Developer Guide
If you want to help develop HoloViews, you can checkout the developer guide, this guide will help you get set-up. Making it easy to contribute.
Support & Feedback
If you find any bugs or have any feature suggestions please file a GitHub issue.
If you have any usage questions, please ask them on HoloViz Discourse,
For general discussion, we have a Discord channel.
Owner
- Name: HoloViz
- Login: holoviz
- Kind: organization
- Website: https://holoviz.org
- Repositories: 14
- Profile: https://github.com/holoviz
High-level tools to simplify visualization in Python
Committers
Last synced: about 1 year ago
Top Committers
| Name | Commits | |
|---|---|---|
| philippjfr | P****r@e****k | 6,163 |
| jlstevens | j****s@e****k | 2,655 |
| Simon Høxbro Hansen | s****n@m****m | 446 |
| James A. Bednar | j****r@i****f | 142 |
| James A. Bednar | j****r@c****o | 141 |
| jlstevens | j****k | 136 |
| Maxime Liquet | 3****t | 84 |
| Andrew | 1****1 | 51 |
| Jon Mease | j****e@g****m | 34 |
| Bas Nijholt | b****t@g****m | 33 |
| Chris B | c****l | 25 |
| Achim Randelhoff | 3****t | 17 |
| Vasco Tenner | v****o@t****l | 16 |
| Maximilian Albert | m****t@g****m | 11 |
| Demetris Roumis | r****d@g****m | 10 |
| Markus Kaiser | m****r@i****e | 9 |
| ea42gh | e****b@m****m | 8 |
| stonebig | s****4@g****m | 8 |
| jordansamuels | j****s@g****m | 8 |
| ea42gh | e****b@m****m | 7 |
| Theom | 4****n | 6 |
| Ian Thomas | i****3@g****m | 6 |
| Douglas Raillard | d****d@a****m | 6 |
| Kim Pevey | k****y@g****m | 5 |
| Stan West | 3****t | 5 |
| Azaya | 9****9 | 5 |
| Philipp Rudiger | p****r@a****m | 4 |
| Florian LB | f****s@g****m | 4 |
| Marc Skov Madsen | m****n@g****m | 4 |
| Peter Roelants | P****s@g****m | 4 |
| and 120 more... | ||
Committer Domains (Top 20 + Academic)
Issues and Pull Requests
Last synced: 10 months ago
All Time
- Total issues: 548
- Total pull requests: 976
- Average time to close issues: over 1 year
- Average time to close pull requests: 26 days
- Total issue authors: 205
- Total pull request authors: 49
- Average comments per issue: 2.59
- Average comments per pull request: 2.57
- Merged pull requests: 801
- Bot issues: 0
- Bot pull requests: 0
Past Year
- Issues: 102
- Pull requests: 366
- Average time to close issues: 14 days
- Average time to close pull requests: 8 days
- Issue authors: 40
- Pull request authors: 17
- Average comments per issue: 1.38
- Average comments per pull request: 2.17
- Merged pull requests: 286
- Bot issues: 0
- Bot pull requests: 0
Top Authors
Issue Authors
- ahuang11 (57)
- droumis (53)
- maximlt (40)
- MarcSkovMadsen (24)
- Hoxbro (22)
- TheoMathurin (20)
- jbednar (16)
- jlstevens (10)
- philippjfr (9)
- BMM3 (9)
- GeoVizNow (8)
- hoxbro (8)
- Azaya89 (7)
- arafune (6)
- MatusGasparik (5)
Pull Request Authors
- hoxbro (372)
- Hoxbro (204)
- philippjfr (141)
- maximlt (58)
- ahuang11 (39)
- Azaya89 (21)
- jlstevens (21)
- droumis (15)
- basnijholt (8)
- vascotenner (7)
- jbednar (7)
- grapesmoker (6)
- TheoMathurin (6)
- douglas-raillard-arm (5)
- stanwest (5)
Top Labels
Issue Labels
Pull Request Labels
Packages
- Total packages: 3
-
Total downloads:
- pypi 713,213 last-month
- Total docker downloads: 19,100,068
-
Total dependent packages: 182
(may contain duplicates) -
Total dependent repositories: 2,008
(may contain duplicates) - Total versions: 295
- Total maintainers: 2
pypi.org: holoviews
A high-level plotting API for the PyData ecosystem built on HoloViews.
- Homepage: https://holoviews.org
- Documentation: https://holoviews.org/
- License: bsd-3-clause
-
Latest release: 1.21.0
published about 1 year ago
Rankings
Funding
- https://opencollective.com/holoviz
conda-forge.org: holoviews
HoloViews is an open-source Python library designed to make data analysis and visualization seamless and simple. With HoloViews, you can usually express what you want to do in very few lines of code, letting you focus on what you are trying to explore and convey, not on the process of plotting.
- Homepage: https://holoviews.org
- License: BSD-3-Clause
-
Latest release: 1.15.2
published over 3 years ago
Rankings
anaconda.org: holoviews
HoloViews is an open-source Python library designed to make data analysis and visualization seamless and simple. With HoloViews, you can usually express what you want to do in very few lines of code, letting you focus on what you are trying to explore and convey, not on the process of plotting.
- Homepage: https://holoviews.org
- License: BSD-3-Clause
-
Latest release: 1.21.0
published about 1 year ago
Rankings
Dependencies
- actions/checkout v3 composite
- conda-incubator/setup-miniconda v2 composite
- actions/checkout v3 composite
- conda-incubator/setup-miniconda v2 composite
- actions/cache v3 composite
- actions/checkout v3 composite
- pre-commit/action v3.0.0 composite
- pyviz-dev/holoviz_tasks/install v0.1a9 composite
- colorcet *
- numpy *
- packaging *
- pandas *
- panel *
- param *
- pyviz_comms *
- bokeh >=2.4.0,<3.0
- bzip2
- cftime
- dask
- datashader
- ffmpeg
- holoviews 1.15.*
- ibis-sqlite
- matplotlib >=2.2
- netcdf4
- networkx
- phantomjs
- pillow
- plotly >=4.0
- python 3.9.*
- scipy
- selenium
- spatialpandas
- streamz >=0.5.0
- xarray >=0.10.4